Six-for-Six Midterm August Slide: Silver (SI) Has Dropped Every Aug 9-21 Since 2002
Silver futures are hovering near $61 as an August 9–21 midterm-year window approaches that has seen prices drop in every cycle since 2002, setting up a potentially choppy stretch for a key safe-haven metal.
Price as of Aug 5, 2026: $61.02 (intraday).
What is the seasonal pattern for Silver (SI)?
Silver has fallen in 6 of 6 midterm-year August 9–21 windows, with an average gain of 4.04% in winning years for a short position.
- 6 for 6 in this window, averaging 4.04% gains in winning years for shorts across the last 6 midterm election cycles.
- Seasonal bias is bearish for price from Aug 9 through Aug 21, a 13-day Silver trading window grouped by midterm election years.
- Percent Profitable is 100%, with 6 winners and 0 losers for the short-side pattern in this historical sample.
- Annualized return for the window is 4.02% for shorts, with a Sharpe ratio of 1.62 and a TradeWave Ratio of 2.44 indicating meaningful directional travel.
- Cumulative return from stacking this specific window across cycles is 26%, even though individual years have seen sizable intraperiod swings.
- Maximum adverse moves within the window have reached as deep as around 9% against the short, so downside risk for bears has been real even in winning years.
According to historical data from TradeWave.ai, this mid-August stretch in midterm election years has behaved very differently from an average month on the Silver calendar, and the next iteration is only days away.
How has Silver (SI) traded in the upcoming August 9–21 window?
Silver has closed lower in every August 9–21 window across the last six midterm election years, with shorts averaging a 4.04% gain per cycle. Futures settled at 61.02 in the prior session, up 2.2% on the day and sitting about 49.9% below the 52-week high of 121.785, a reminder of how far the market has already come off last year’s spike. That combination of a strong short-side seasonal trend and a market still trading at a steep discount to its prior-year peak gives this year’s window unusual tactical importance for macro and precious-metals traders.
Because this pattern is grouped by the presidential election cycle, it only looks at midterm election years, a phase that often brings shifting fiscal priorities and regulatory noise. For commodities like Silver, that mid-cycle backdrop can change how investors hedge geopolitical risk and inflation, which is why the August 9–21 slice behaves differently from the same dates in other years.
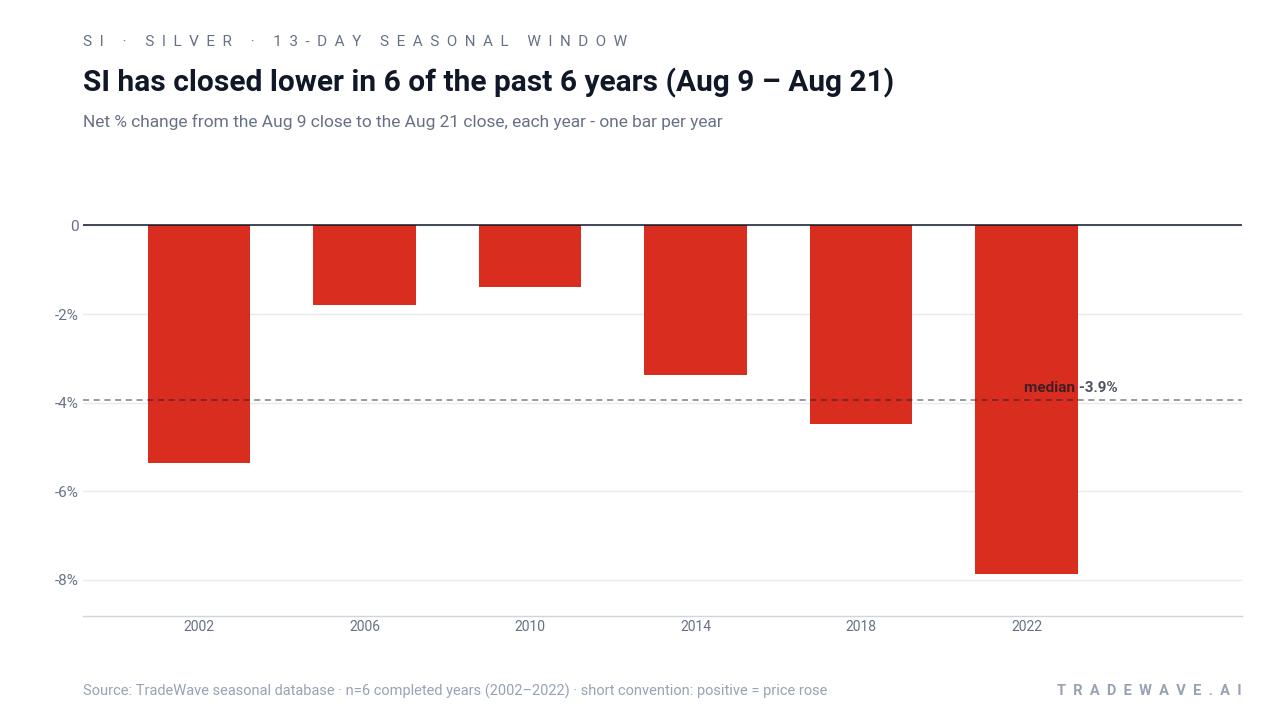
The trade direction for this setup is explicitly short. In every one of the six midterm-year samples from 2002 through 2022, Silver finished the 13-day window below its August 9 close, with net returns ranging from a 1.39% drop in 2010 to a 7.86% slide in 2022. For a short position, those negative net returns are the “good” years, and they line up with the 100% Percent Profitable record and 4.04% average profit.
Looking at individual cycles, 2022 stands out as the strongest year for the pattern, with Silver falling 7.86% from entry to exit while the best intraperiod move against the short was a modest 1.36% rally. At the other end of the spectrum, 2010 delivered a smaller 1.39% net decline but still offered a 2.07% best favorable move for shorts at the trough, showing that even quieter years have given the trade room to work.
A second view of the same window highlights how far Silver has tended to swing inside the range before settling at the close.
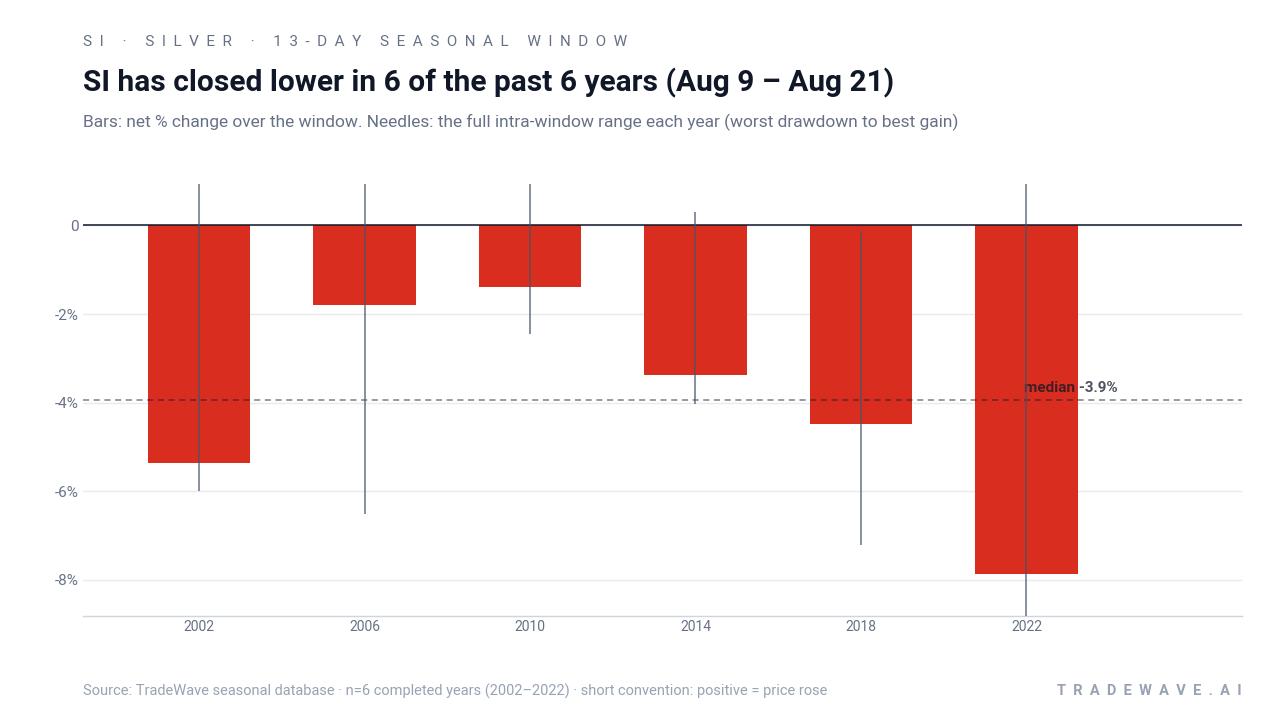
The maximum favorable move within the window, the best point-to-peak drop for shorts, has often been larger than the final net result, which is what the TradeWave Ratio of 2.44 is flagging. At the same time, maximum adverse moves have reached roughly 6% to 9% against the short in several years, underscoring that Silver can squeeze higher before rolling over, especially when macro headlines hit.
The cumulative chart of this mid-August window compounds to a 26% gain for shorts across the six completed midterm cycles, a clean staircase rather than a choppy line. Add it up: six for six, no losing years, and a steady build in cumulative return that makes this one of the more consistent short-side seasonal stretches on the Silver calendar.
History does not guarantee future results; adverse excursions within the window can be large even when the pattern ultimately finishes in the trade direction.
Why does Silver (SI) follow this seasonal pattern?
One likely driver is commodity supply and demand seasonality, as industrial users and miners adjust hedges ahead of late-summer production and inventory decisions. Analysts also point to the midterm election year policy calendar, when fiscal debates and geopolitical posturing can briefly cool safe-haven demand before markets refocus on the pre-election year. This pattern may also reflect portfolio rebalancing in August, when investors trim precious-metals exposure after earlier-year risk events.
What is driving Silver (SI) today?
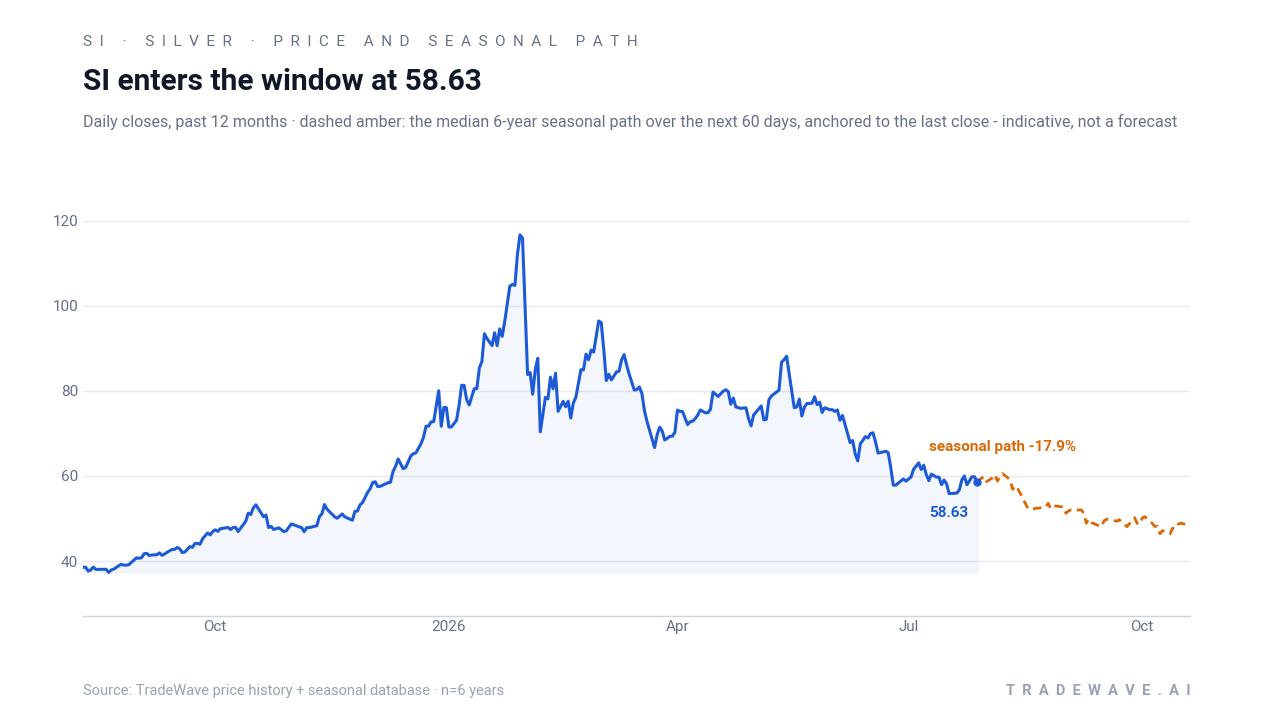
Silver futures last settled at 61.02, up 1.29 points or 2.2% on the prior session, with the contract trading between 59.62 and 61.07 on relatively light volume of 3,751 lots versus a 20-day average of about 26,000. That bounce comes just days after prices opened higher on Aug 3, 2026, when a pause in planned U.S. airstrikes and a restart of peace talks briefly boosted safe-haven demand for the metal.[1]
In the broader precious-metals market, Silver continues to serve as both an industrial input and a risk-management tool, with futures on the CME Group platform giving investors a liquid way to express views on inflation, growth and geopolitical stress.[2] The fact that the contract is still roughly 49.9% below its 52-week high despite the latest pop shows how much air was taken out of last year’s rally, leaving room for both tactical short-covering spikes and renewed selling if macro conditions calm.
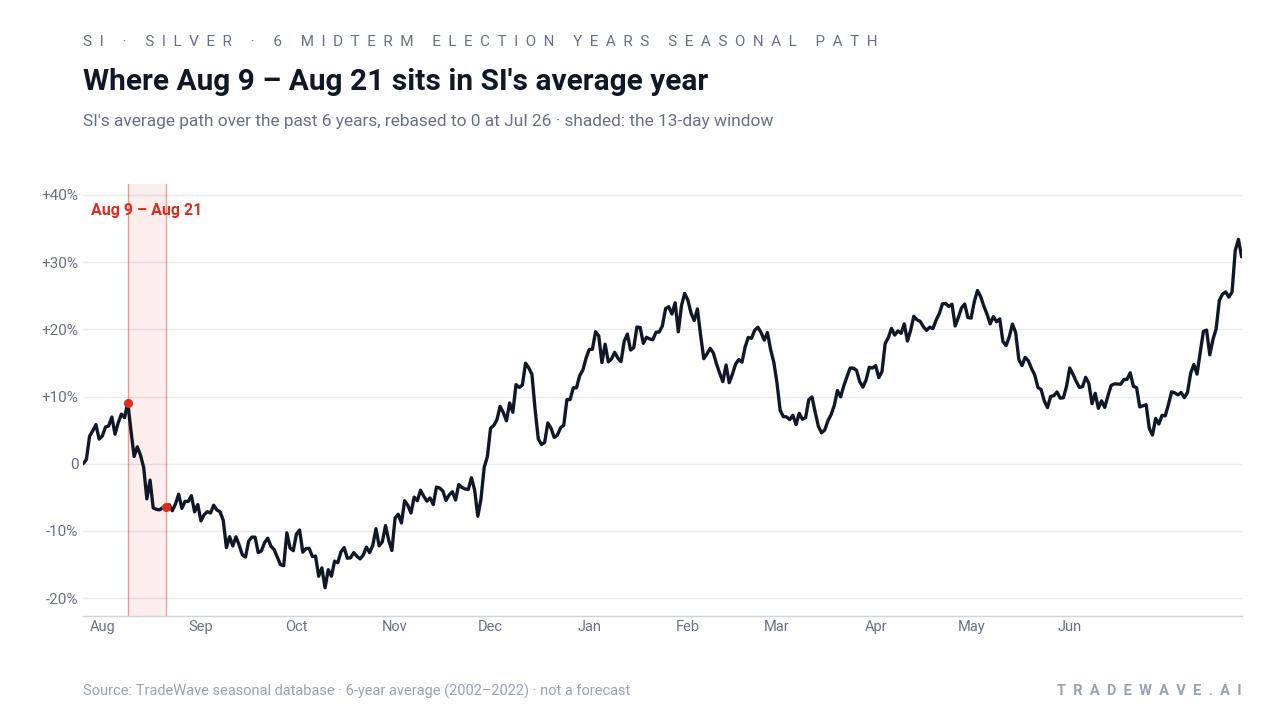
The chart below situates the latest move in its recent multi-month context and overlays the historical seasonal path for the next 60 days.
What should traders watch as this Silver (SI) window approaches?
First, the calendar: the August 9–21 window lands in the back half of the midterm election year, just before markets pivot into the historically stronger pre-election phase for risk assets. If Silver respects its past pattern and softens in this stretch, it would fit the script of mid-cycle jitters giving way to a more constructive backdrop later in the presidential cycle.
Second, levels and volatility: traders will be watching whether Silver can hold above the recent low near 59.62 or whether rallies toward the 50-day moving average around 61.95 attract selling. A failure to see any downside pressure during the window would be a clear break from the six-for-six historical record, while a quick drop followed by aggressive dip-buying would echo prior years where the maximum favorable move for shorts arrived early.
Third, the macro tape: further headlines around the paused airstrikes and broader geopolitical de-escalation could sap some safe-haven demand, reinforcing the bearish seasonal tendency, while any renewed tension could trigger squeezes against short positions.[1] How Silver behaves around those catalysts inside the August 9–21 band will tell traders whether this midterm-year seasonal trend is still in force or finally starting to fade.
Sources
About this seasonal analysis
Seasonal pattern data is sourced from TradeWave.ai, which analyzes historical price behavior across annual calendar windows going back up to 30 years. Read the full data methodology or the book The 100-Year Pattern by Afshin Moshrefi (2026 edition). Past performance of seasonal patterns does not guarantee future results. This article is for informational purposes only and does not constitute investment advice.