S&P 500 Energy Sector SPDR (XLE) Eyes Upside as Sector Discount Meets Geopolitical Risk
S&P 500 Energy Sector SPDR is entering a historically strong 24-day midterm-year stretch just as traders lean into bullish options structures and debate whether the sector’s discount is a buying opportunity or a value trap.

Key takeaways
- XLE’s 24-day window starting Mar 24 in midterm election years has been bullish, with gains in 5 of 6 cycles.
- Long trades in this slice of the calendar have averaged 5.33% in winning years, with a 4% average when all years are included.
- The pattern is long-biased, with an 83% win rate, a Sharpe ratio of 1.81 and a TradeWave Ratio of 9.48, pointing to meaningful directional follow-through.
- Intraperiod swings have been real: the weakest year still saw a 4.83% peak rally before a flat finish, while adverse moves have reached roughly 4% in some cycles.
- Options traders are already positioning for upside in XLE, using structures such as risk reversals to express a rebound view in the sector.[1]
- History does not guarantee a repeat, but this midterm-year window has tended to reward patient longs who can tolerate drawdowns along the way.
According to historical data from TradeWave.ai, this specific midterm-year stretch for XLE has behaved very differently from an average month on the calendar, and the next iteration begins today.
Seasonal window
S&P 500 Energy Sector SPDR has risen in 5 of the last 6 midterm election years during this 24-day window starting Mar 24, averaging 5.33% gains in the winning runs. The ETF opens this year’s window with energy still trading at a discount narrative and no clear breakout yet confirmed.[2][3] Options traders have been leaning into upside structures on XLE, including risk reversals designed to capture a sector rebound, which makes this historically strong slice of the calendar more than just a statistical curiosity.[3]
Grouping the data by the presidential election cycle matters here because energy often trades as a policy and geopolitics proxy, and midterm years tend to feature regulatory noise, supply headlines and shifting expectations for the next administration’s stance on drilling and climate. In this context, the fact that XLE has usually pushed higher in this early-spring midterm slice suggests that, historically, policy uncertainty has not prevented the sector from grinding up once this window opens.
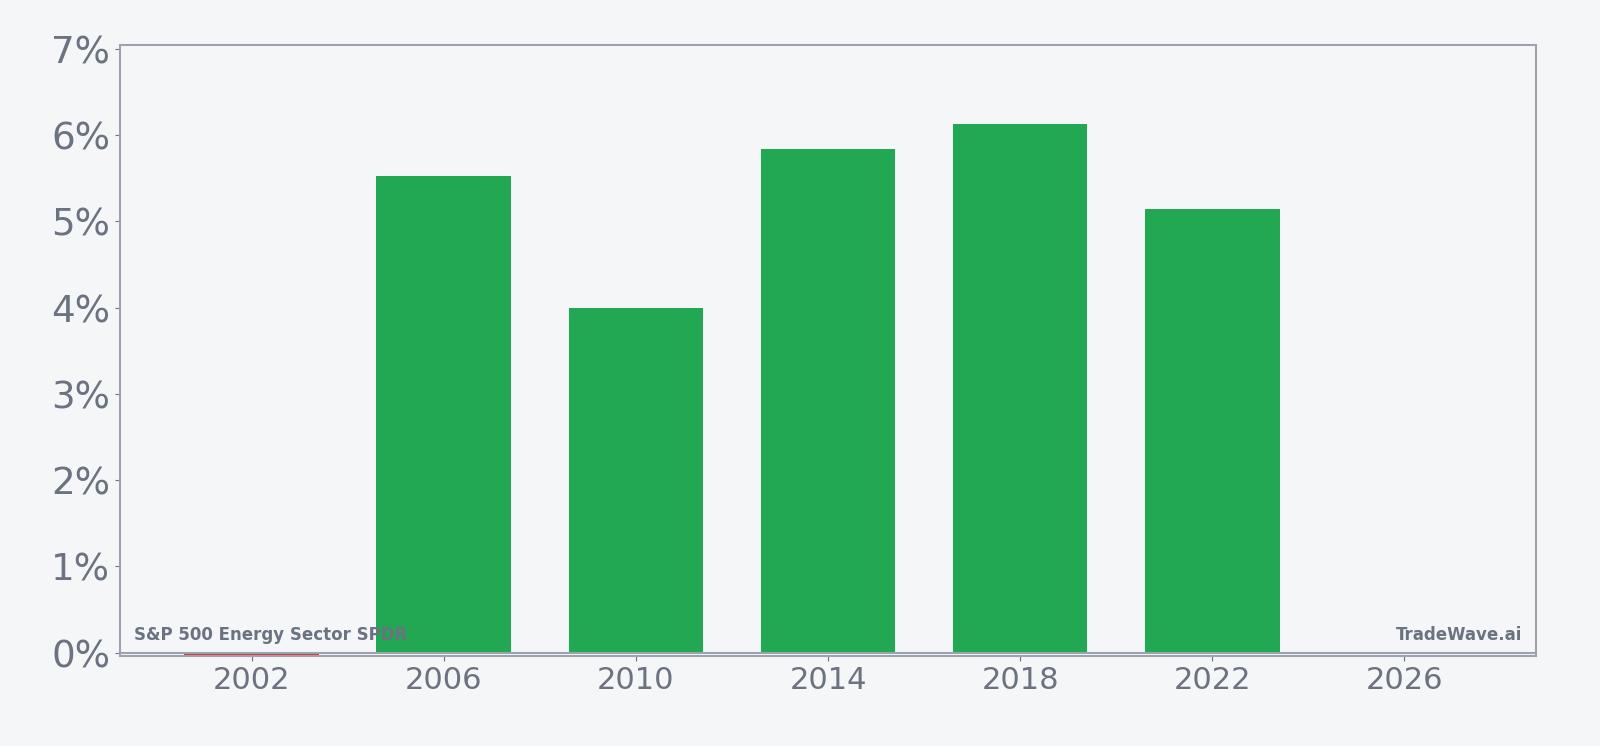
This seasonal window begins on Mar 24 and spans 24 trading days. Historically, during this period, S&P 500 Energy Sector SPDR has shown a strong long-biased tendency, with 5 winners and just 1 essentially flat outcome across the last six midterm election years. The 4% Avg Profit - All shows that even after including the lone non-gainer, the typical result has still been a solid positive move for longs.
The per-year breakdown shows how that plays out in practice. The strongest midterm-year run in this sample delivered a 6.13% net gain, while other winning years clustered in the 4% to 6% range, which is meaningful for a diversified sector ETF over less than a month. The one outlier year, 2002, finished almost exactly flat at -0.04%, but even that window saw a 4.83% maximum favorable move before giving it back, which speaks to the intraperiod opportunity and noise.
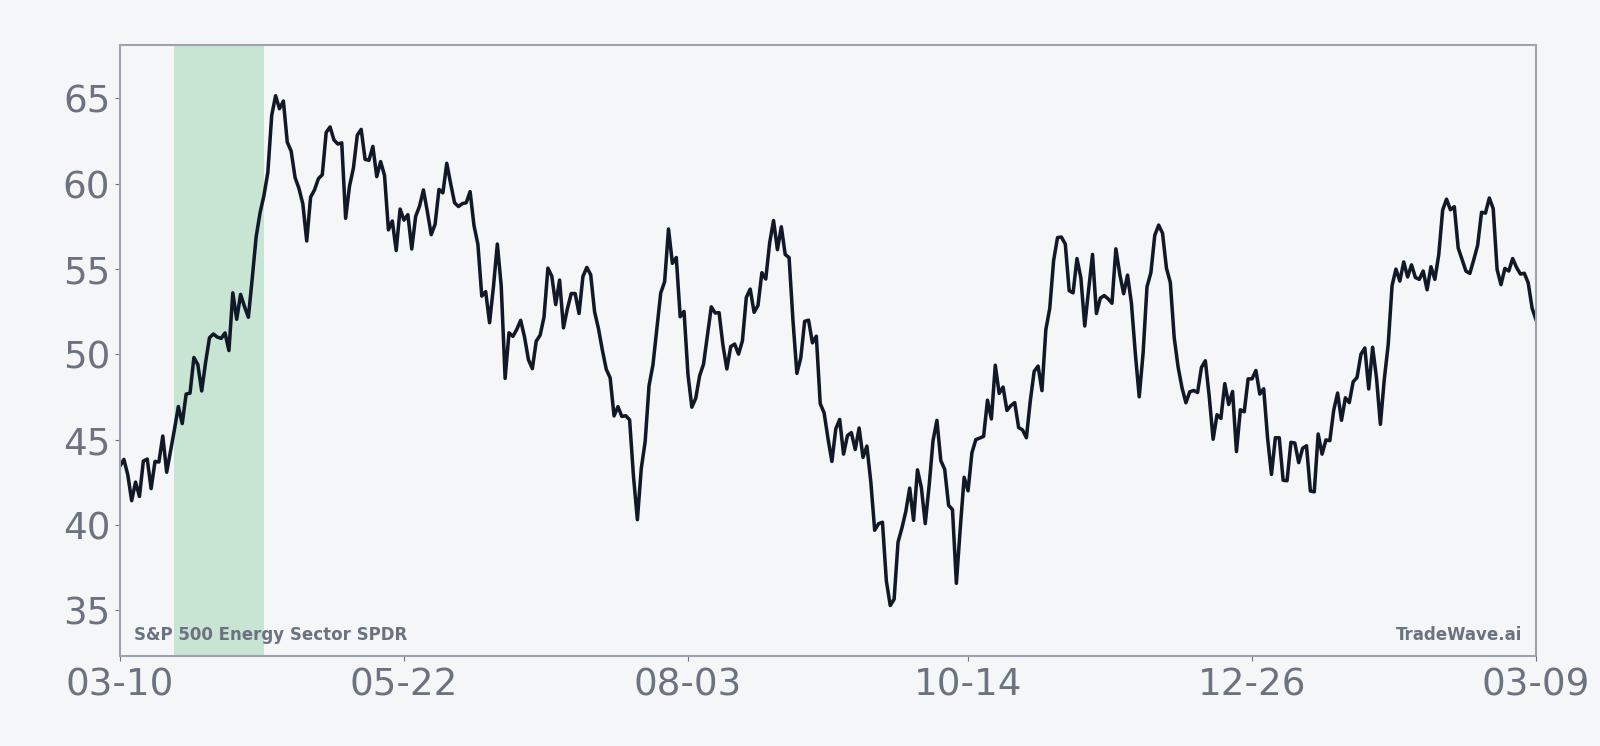
The historical average path within the window tilts higher fairly consistently rather than relying on one big day. In prior midterm years, XLE has tended to build gains gradually across the 24 sessions, which fits with a story of improving sentiment and incremental buying rather than a one-off headline shock.
The next view combines net results with the best and worst intraperiod swings to show how much XLE has typically moved inside the window.
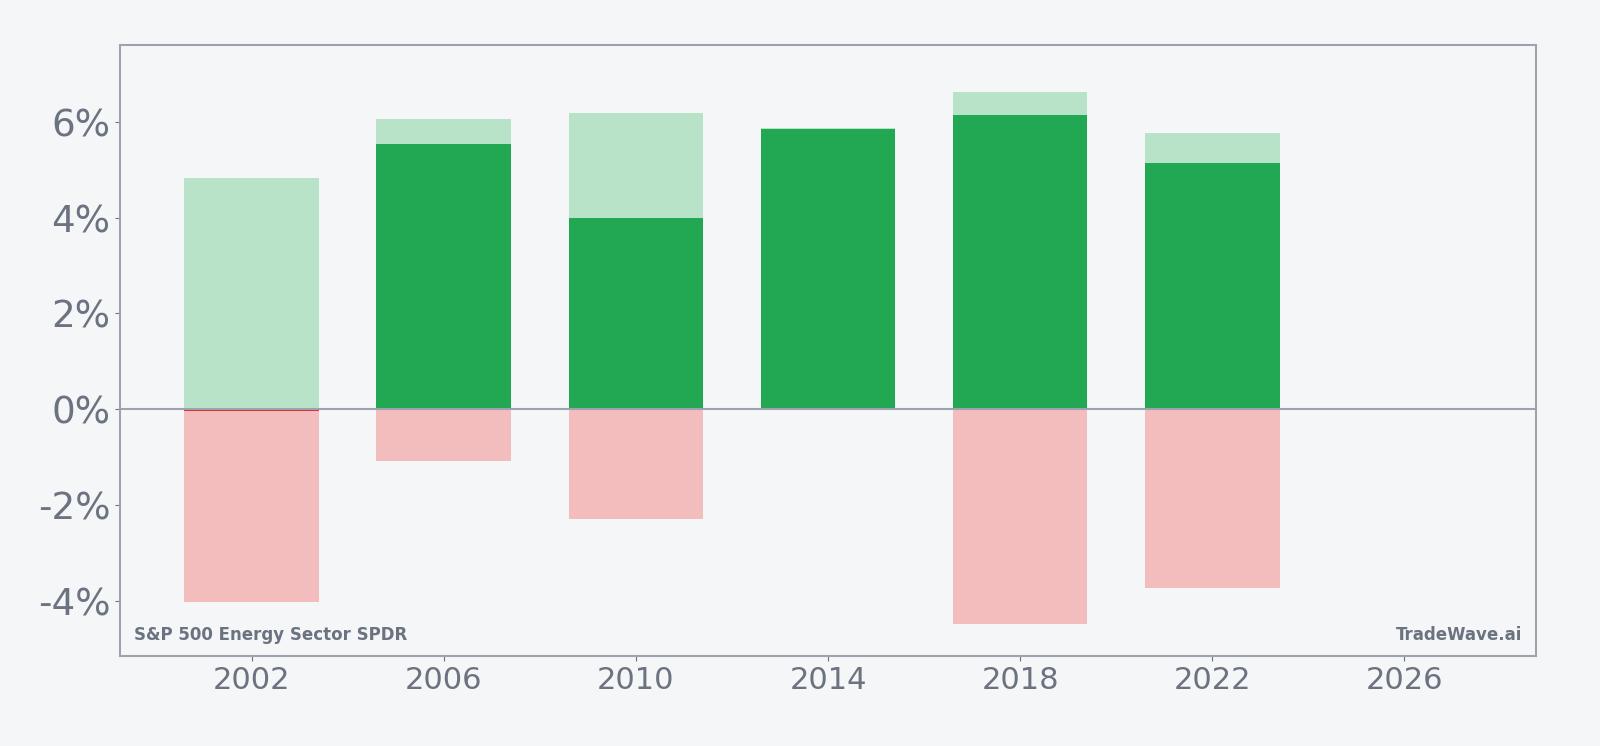
The combined net, peak favorable move and worst drawdown profile shows why this window has appealed to active traders. In the winning years, maximum favorable excursions have run between about 5% and 6.61%, while maximum adverse moves have ranged from modest to roughly 4.48% at the worst. That mix lines up with the long trade direction: the pattern has rewarded staying with upside swings, but it has also demanded tolerance for mid-window pullbacks that can be several percentage points deep.
History does not guarantee future results; adverse excursions can be large even in winning windows, and past midterm-year behavior may not repeat.
Price and near-term drivers
With no fresh quote data available for Mar 24, the focus for XLE is less about today’s exact print and more about where the sector sits in the broader narrative: still framed as “cheap but controversial,” with technicians watching converging trendlines for a potential breakout and macro investors weighing geopolitical risk against slowing global growth.[2] Strategists have flagged that energy stocks, including XLE, are trading at a discount amid uncertainty, while options desks report investors using structures such as risk reversals to position for a bounce rather than a collapse.[3]
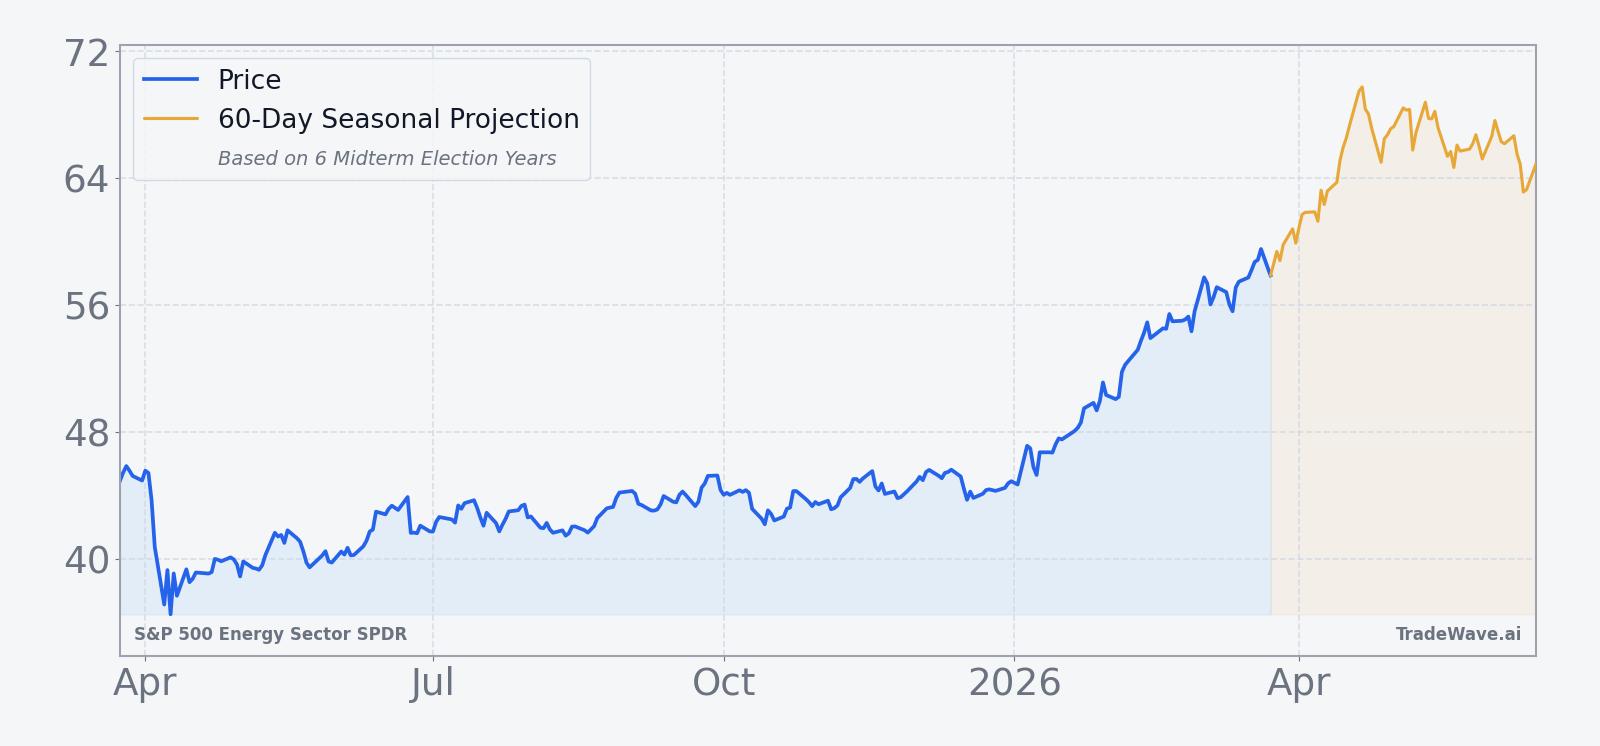
The chart below situates the latest move in its recent multi-month context, alongside a 60-day seasonal projection based on prior midterm-year behavior.
Macro headlines are adding fuel to the debate. U.S. oil CEOs have warned that disruptions in key chokepoints such as the Strait of Hormuz could intensify an already fragile global energy backdrop, a scenario that would typically support upstream producers and, by extension, XLE.[1] At the same time, some strategists argue that the sector is “due for a bounce” after a period of underperformance, pointing to the combination of discounted valuations and constructive options positioning as evidence that investors are quietly rebuilding exposure rather than abandoning the space.[2][3]
Layered on top of that is the political calendar. Midterm election years often bring noise around drilling permits, export policy and climate regulation, which can weigh on sentiment early in the year. Yet the historical pattern for this specific 24-day window suggests that, in prior cycles, those concerns have not prevented XLE from grinding higher once late March arrives. For traders watching both Washington and the tape, the question is whether this year’s mix of geopolitical risk and policy uncertainty will rhyme with those earlier midterm springs or break the pattern.
What to watch
For this window, the first thing to watch is whether XLE can replicate the historical tendency to build gains steadily rather than chop sideways. A constructive tape that respects higher lows and pushes toward prior resistance would be consistent with the 5-of-6 winning record in this midterm-year slice. A failure to hold early strength, especially if accompanied by outsized drawdowns similar to the roughly 4% worst-case intraperiod moves seen in past cycles, would be an early sign that this iteration may diverge from the script.
Second, keep an eye on options flow and structure. The recent use of upside-focused strategies such as risk reversals suggests that some investors are already leaning into a rebound view for XLE.[3] If that flow continues to build as the window progresses, it would reinforce the idea that the seasonal pattern is aligning with positioning. A sharp reversal in options sentiment, with traders shifting toward downside protection instead, would send a different message and could blunt the impact of the historical tailwind.
Third, monitor the policy and geopolitical calendar. Any escalation in supply disruptions or fresh regulatory headlines around U.S. production could inject volatility into a window that has historically rewarded longs but not without drawdowns.[1][2] How XLE behaves on those news days will matter: quick recoveries that keep the ETF tracking its typical upward seasonal path would fit the historical pattern, while sustained breaks on bad news would argue that this midterm year is writing its own playbook.