This 24-Day Midterm Spring Window Has Delivered Gains in 5 of 6 Years for S&P 500 Energy (XLE)
S&P 500 Energy Sector SPDR is heading toward a historically strong 24-day midterm-year window just as options positioning and retail flows cluster around the energy trade.

Key takeaways
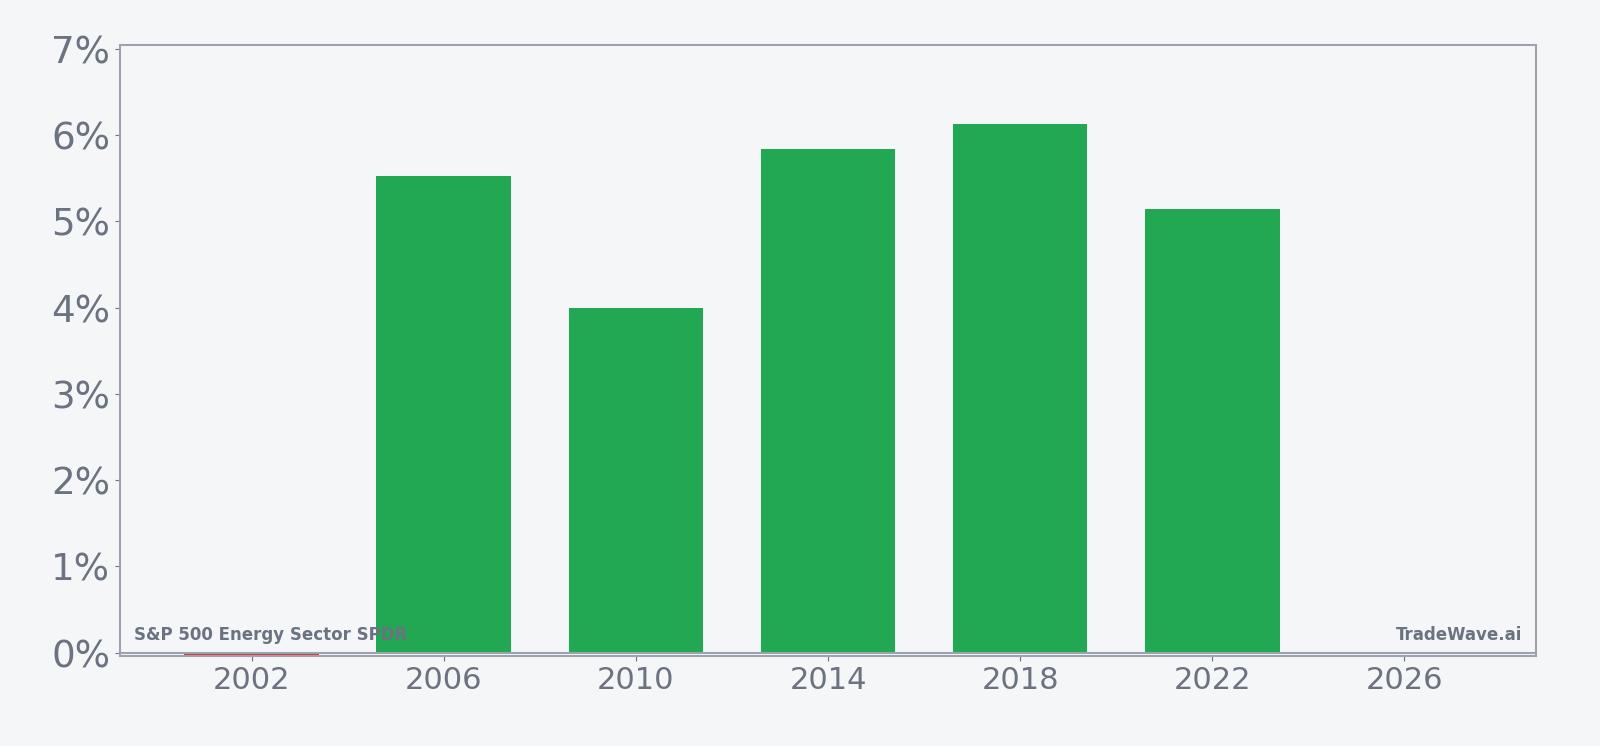
- A 24-day midterm-year spring window for S&P 500 Energy Sector SPDR starting Mar 24 has been bullish, with gains in 5 winners versus 1 loser and 83% profitable years.
- Winning years in this window have averaged a 5.33% advance, while including the lone down year still leaves a 4% average gain across all six cycles.
- The pattern is long-biased, with a Trade Direction of long, a TradeWave Ratio of 9.48 and a Sharpe ratio of 1.81, pointing to historically efficient upside moves.
- Intraperiod swings have been meaningful, with maximum favorable moves often above 5% but adverse excursions in some years reaching roughly 4% before recovering.
- Recent options risk-reversal flow and a burst of retail buying around geopolitical tensions show traders already leaning into the energy theme ahead of this window.[1][3]
- History does not guarantee a repeat, but the combination of strong midterm-year seasonality and active positioning makes this slice of the calendar hard to ignore.
According to historical data from TradeWave.ai, this upcoming stretch has behaved very differently from an average month on the calendar for XLE. The next section walks through how that pattern has played out across the last six midterm election years.
Seasonal window
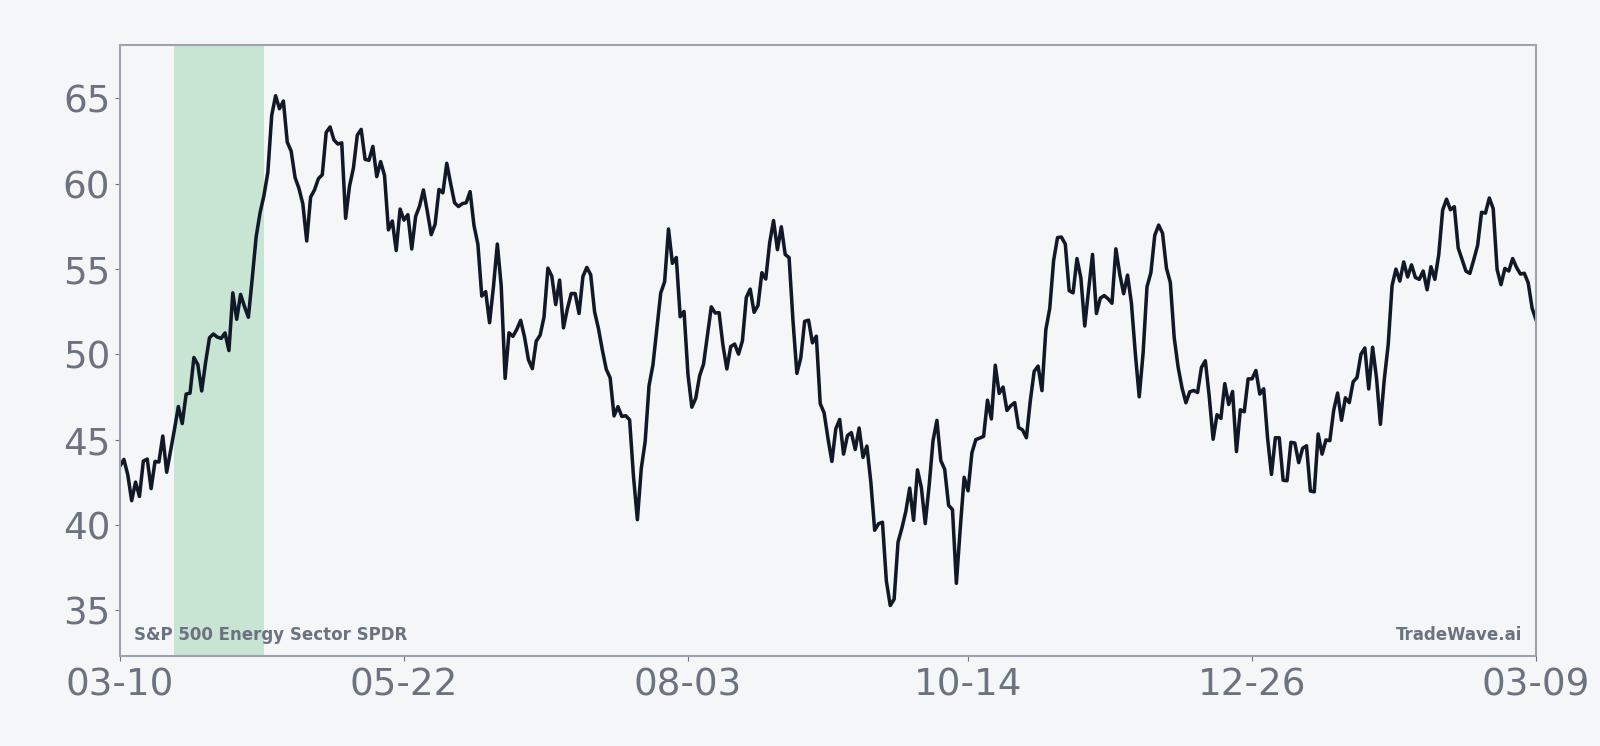
S&P 500 Energy Sector SPDR has risen in 5 of the last 6 midterm election-year spring windows for this pattern, averaging 5.33% gains in the winning years. The next 24-day window begins on Mar 24, with XLE recently quoted around 89 and coming off a solid 6.35% one-month advance that has it trading well above its 50-day moving average of 51.39.[4] A fresh risk-reversal in November options, selling the 89 put and buying the 90 call for a small credit, points to traders leaning into upside exposure in the sector as this historically favorable window approaches.[1] That mix of strong midterm-year seasonality, recent price strength and options skew toward calls sets up a calendar stretch that active traders will be watching closely.
The presidential election cycle matters here because this pattern only looks at the last six midterm election years, a phase that often brings policy uncertainty around regulation, taxes and energy security. Grouping by that phase filters out noise from other parts of the cycle and focuses on how energy stocks have behaved when Washington is in the middle of the four-year term and legislative risk can be elevated.
This seasonal window begins on Mar 24 and spans 24 trading days. Historically, during this period, S&P 500 Energy Sector SPDR has shown a strong upside tendency for long positions, with 83% of the sampled midterm years finishing higher. The trade direction is explicitly long, so the favorable years are the ones where XLE rallied into and through the window, while the lone losing year saw only a marginal decline of 0.04% from entry to exit.
Average winner gains of 5.33% compare with a 4% average when every year is included, which means the single down year has not dragged the overall profile down very far. The median outcome of 5.34% sits almost exactly on top of the average winner, suggesting the positive years have clustered in a fairly tight band rather than relying on one outsized outlier. Add it up and the cumulative return across all six midterm-year windows is 29%, with an annualized return of 4.41% for this specific slice of the calendar.
The intraperiod path has not been smooth, even in winning years. Maximum favorable excursions, the best point-to-peak moves during the window, have ranged from about 4.83% in 2002 to 6.61% in 2018, showing that when XLE has worked in this window it has often delivered mid-single-digit upside before the exit. Maximum adverse excursions, the worst drawdowns from entry, have stretched to roughly 4.48% in 2018 and 4.01% in 2002, underscoring that even successful years have seen traders sit through meaningful pullbacks before the gains stuck.
The per-year table shows 2018 as one of the strongest examples, with a 6.13% net gain, a 6.61% peak run-up and a 4.48% worst drawdown from entry. At the other end of the spectrum, 2002 barely missed to the downside, with a 0.04% loss despite a 4.83% intraperiod rally that ultimately faded by the close. That contrast captures the flavor of this window: upside has usually won out by the end, but the path has involved both rallies and shakeouts.
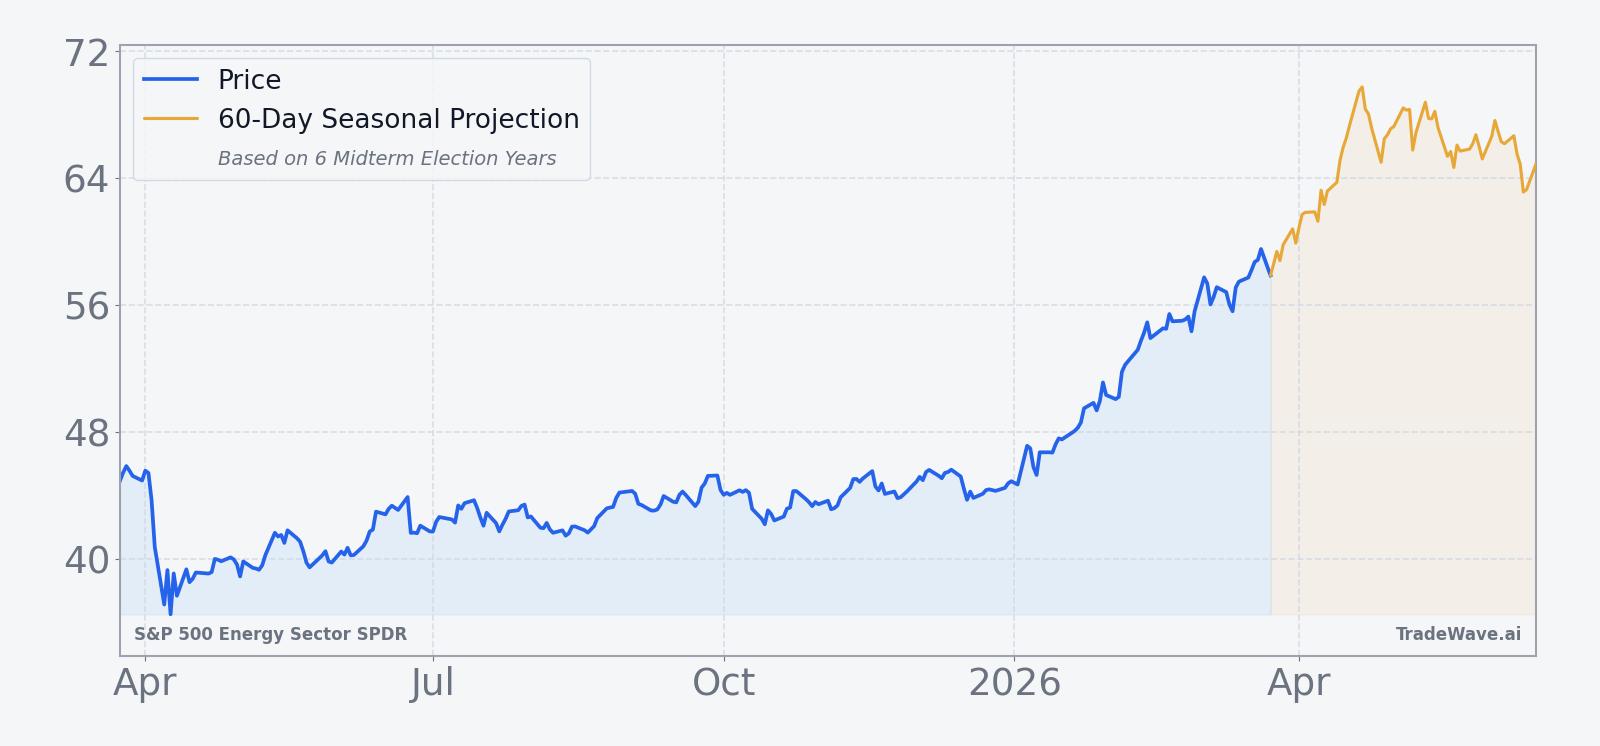
The historical seasonal average trend for this window slopes higher through most of the 24 days, with gains tending to build rather than spike and fade. The profile suggests that in prior midterm years, strength has often emerged early in the window and then continued in a grinding fashion, rather than saving all of the move for the final days.
Year-by-year bars that combine net results with peak rallies and worst drawdowns help frame how much noise has surrounded those average gains.
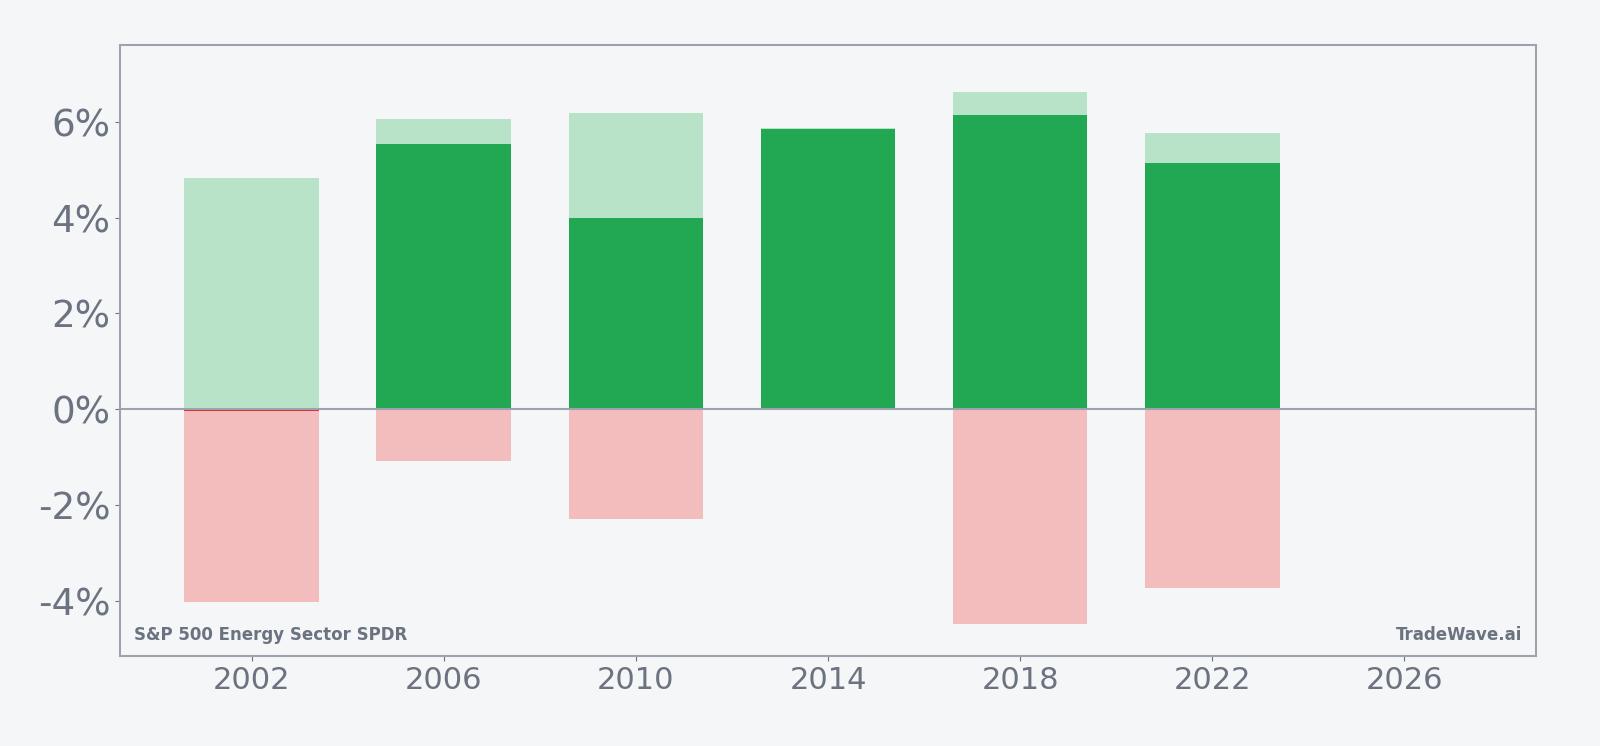
The combined net, maximum favorable and maximum adverse bars highlight a window where upside has usually dominated by the close, yet intraperiod swings have been large enough to matter for risk management. Large maximum favorable moves paired with moderate to occasionally deep adverse excursions point to a high-variance but generally rewarding stretch for long exposure in XLE during midterm springs.
History does not guarantee future results; adverse excursions can be large even in winning windows, and traders in this pattern have often had to tolerate several percent of downside before the historical gains materialized.
Price and near-term drivers
Heading into this year’s midterm-phase spring window, XLE is trading around 89 after a 6.35% gain over the past month, with recent prices sitting far above a 50-day moving average of 51.39 and a 20-day average volume near 68 million shares.[4] That backdrop reflects a sector ETF that has already been in motion, not one waiting for a catalyst.
Geopolitics have been a key driver. On Mar 2, U.S.-Israeli strikes on Iran pushed investors toward energy as a hedge against potential supply disruptions, with retail traders buying XLE aggressively in the first hour of trading and adding more than $14 million of net exposure.[3] The same episode reinforced the idea of XLE as a liquid proxy for crude-linked risk, especially for investors who prefer ETF exposure over futures or single-name energy stocks.
Sector specialists describe XLE as sitting at an inflection point, with the ETF threatening to break higher as macro and positioning lines up behind the trade.[2] The recent options risk reversal, selling the Nov. 21 89 put and buying the 90 call for a slight credit, fits that narrative by showing traders willing to finance upside exposure by taking on downside risk at current levels.[1] In plain English, someone is betting that if XLE is going to move meaningfully from here, the more interesting path is higher rather than lower.
The chart below situates the latest move in its recent multi-month context.
What to watch as the window opens
As the Mar 24 start date approaches, the first thing to watch is whether XLE respects the historical script of building gains early in the 24-day window. A firm tone in the opening week, especially if it comes with rising volume relative to the 20-day average, would line up with the pattern of steady mid-single-digit advances seen in prior midterm years.
Second, monitor intraperiod drawdowns against the historical adverse excursions. In past cycles, even winning years have seen 2% to 4% pullbacks from entry before recovering. If XLE sells off more sharply than that range without a quick rebound, it would mark a departure from the typical path and signal that macro or policy forces are overpowering the seasonal tendency.
Third, keep an eye on the options tape and retail flow that has already started to build around the energy trade. Follow-through in upside call buying and continued net retail inflows into XLE would suggest that the risk-reversal and early-March buying spree were the start of a broader positioning shift rather than one-off events.[1][3] A reversal, with put demand picking up or retail flows turning negative during the window, would tell a different story and could blunt the historical tailwind.
Finally, the policy calendar matters in a midterm election year. Any fresh headlines on Iran, OPEC decisions or U.S. regulatory moves on drilling and exports could either reinforce or disrupt the seasonal pattern. For traders who care about timing rather than prediction, the message is straightforward: this 24-day slice of the midterm year has often rewarded long exposure in XLE, but the path has been bumpy enough that risk management and attention to catalysts remain essential.
Sources
- Options flow: XLE Nov. 21 risk reversal highlights upside skew (date unavailable)
- Energy sector performance: XLE at a potential breakout inflection (date unavailable)
- Retail flows into XLE following U.S.-Israeli strikes on Iran (Mar 2, 2026)
- Market context for XLE: one-month return, 52-week range and moving averages (Mar 11, 2026)