This 23-Day Midterm Window Has Never Been Negative for S&P 500 Energy Sector SPDR (XLE)
S&P 500 Energy Sector SPDR is approaching a 23-day midterm-year window that has never been negative in the past six cycles, just as options and retail flows cluster around the ETF.

Key takeaways
- A 23-day seasonal window for S&P 500 Energy Sector SPDR starting Mar 26 has been positive in all 6 midterm election years in the sample, with 6 winners and 0 losers.
- The pattern is long-biased, with average gains of 4.94% across those windows and a cumulative return of 33% for the strategy.
- Typical winning years have seen strong upside follow-through, with a TradeWave Ratio of 4.35 and a Sharpe ratio of 2.04, signaling historically efficient risk-adjusted returns.
- Intraperiod swings have still been meaningful, with some years showing several percentage points of downside from entry before finishing higher.
- Options risk-reversal trades and heavy retail buying around geopolitical shocks show traders are already using XLE as a levered bet on energy volatility.[1][2][3]
- History does not guarantee a repeat, but this specific midterm-year slice has been one of the cleaner bullish stretches for the ETF.
According to historical data from TradeWave.ai, this late-March window in midterm election years has behaved very differently from an average month for XLE, and the next iteration is about to open.
Seasonal window
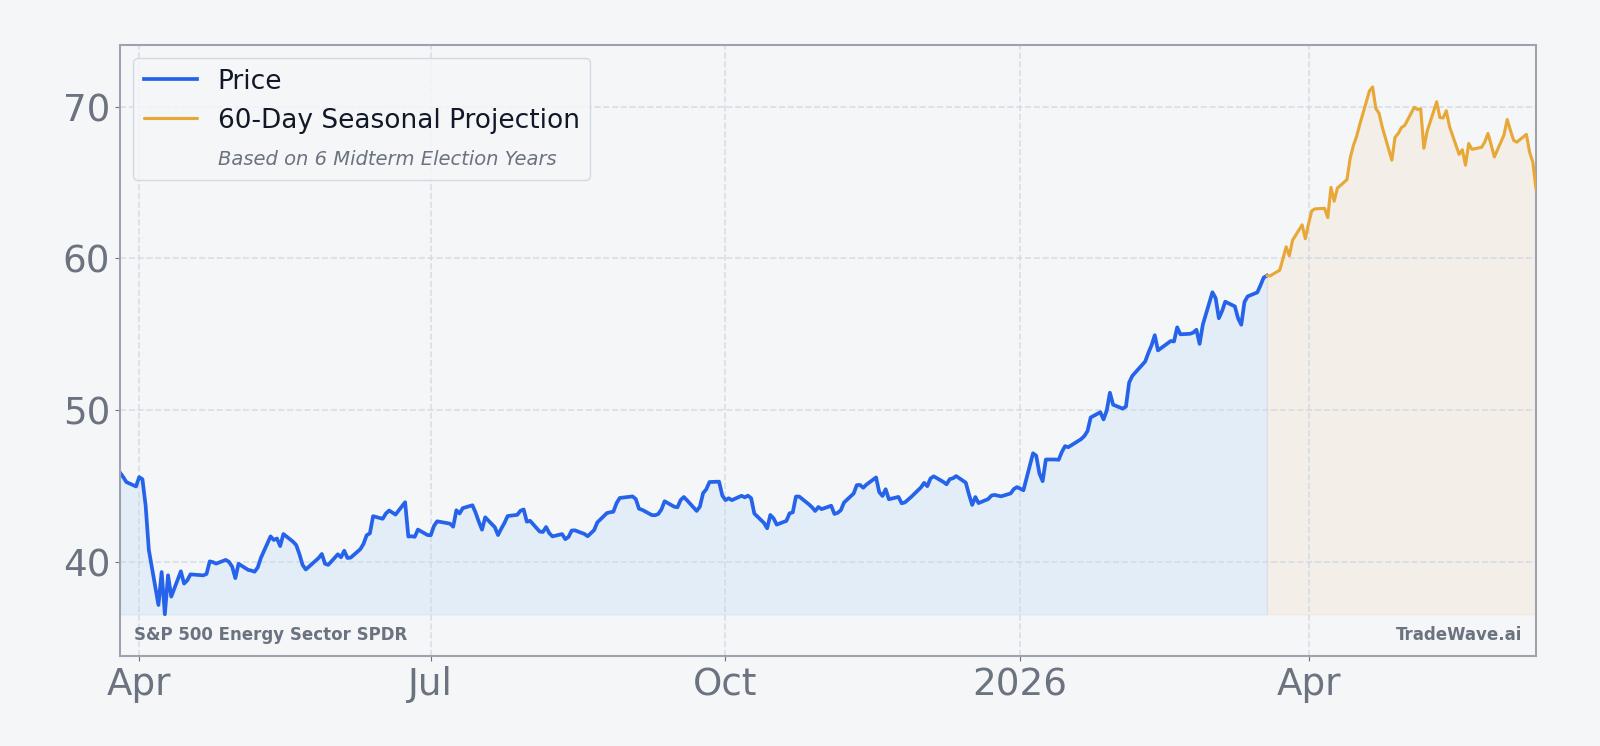
The upcoming seasonal window for S&P 500 Energy Sector SPDR has delivered gains in 6 of 6 midterm election years, averaging 4.94% over just 23 trading days. The next run of this pattern begins on Mar 26 and will carry into late April, with XLE recently quoted around 89 and trading well above its 50-day moving average of 52.93, underscoring how far the sector has already run. That combination of a clean historical win streak and an extended spot price gives this midterm-year window more weight than a typical calendar quirk.
Grouping the data by the presidential election cycle matters here because energy policy, regulation and geopolitical risk often move in multi-year waves that line up with Washington’s calendar. This pattern isolates the last six midterm election years, a phase that has historically featured noisy macro headlines but also decisive sector rotations as investors position for the pre-election year that follows.
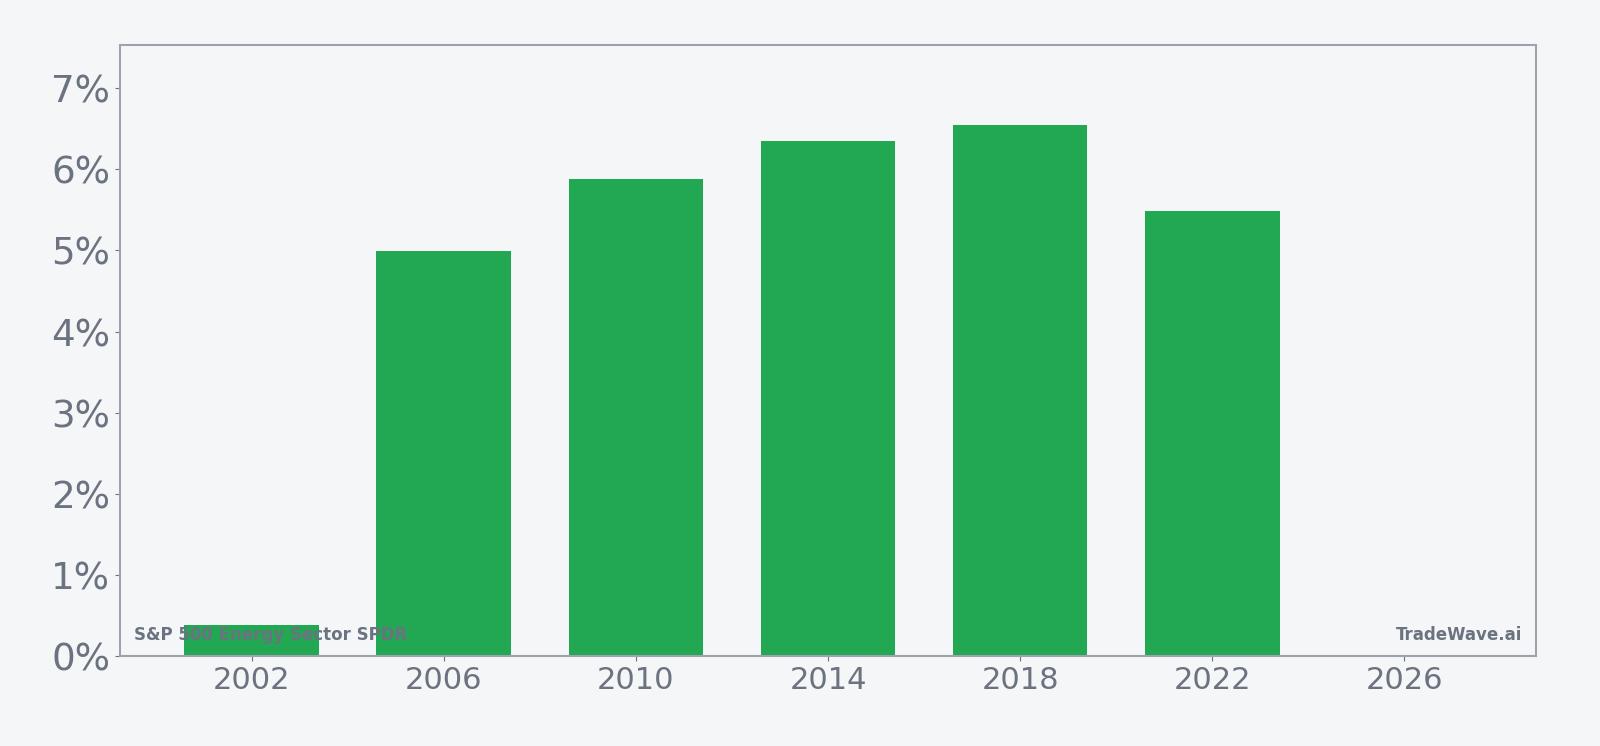
Historically, this has been a straightforward long setup. Across the last six midterm election years, every single 23-day window that started around Mar 26 finished higher, with median gains of 5.68% and a cumulative return of 33% for the strategy. The strongest years in the sample, such as 2014 and 2018, posted net returns of 6.35% and 6.55% respectively, while even the softest year, 2002, still ended slightly positive at 0.39%.
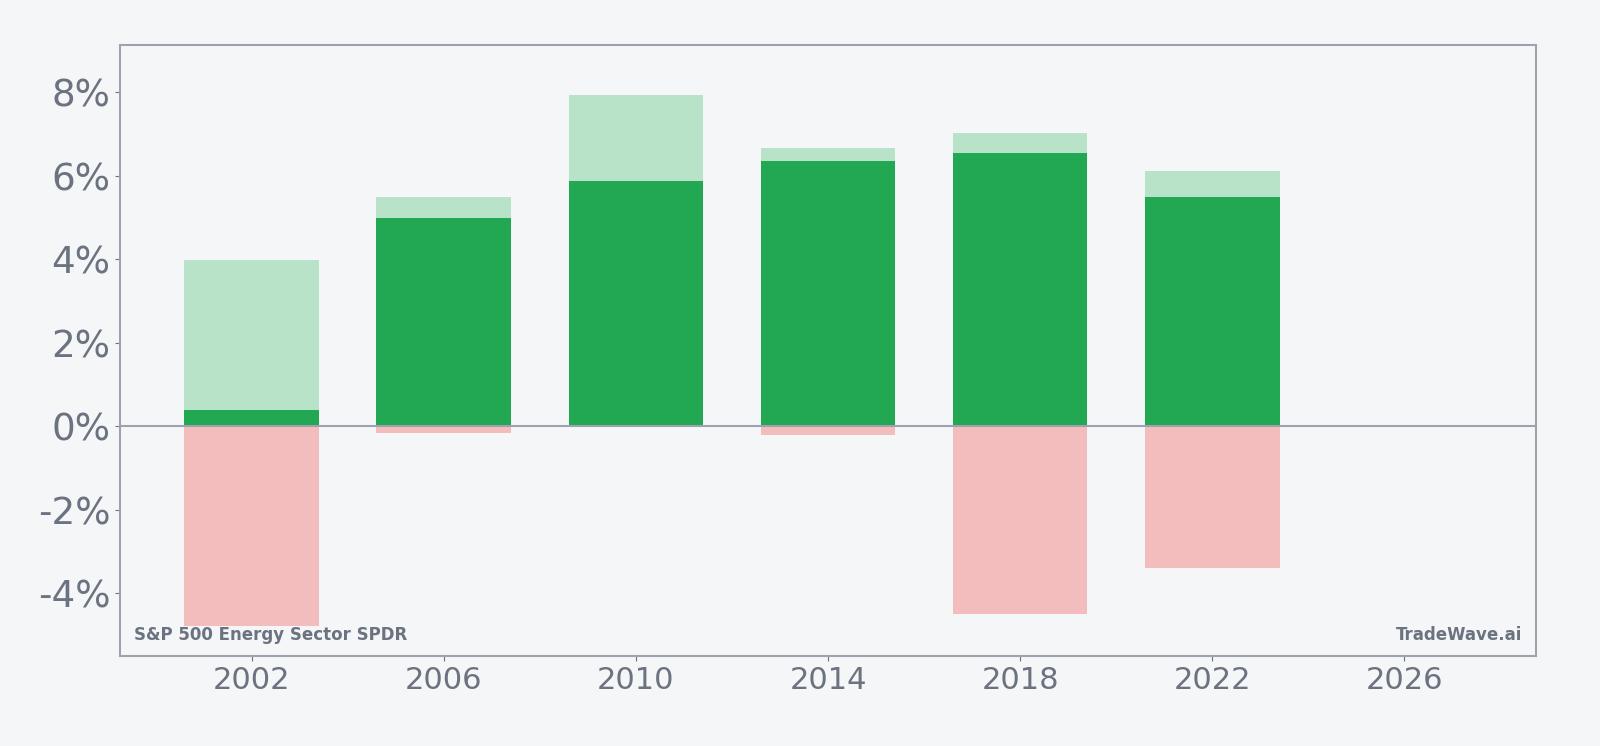
The per-year path data shows that upside has usually come with a meaningful intraperiod swing. In 2018, for example, XLE’s best point-to-peak move within the window reached 7.03%, but the worst drawdown from entry was a drop of 4.48% before the ETF finished higher. In 2002, the maximum favorable move was 3.98% while the maximum adverse move was a 4.79% slide, yet the window still closed in the green. That mix of strong maximum favorable excursions and occasional deep maximum adverse excursions is what you would expect from a sector that trades on both oil price spikes and sudden reversals.
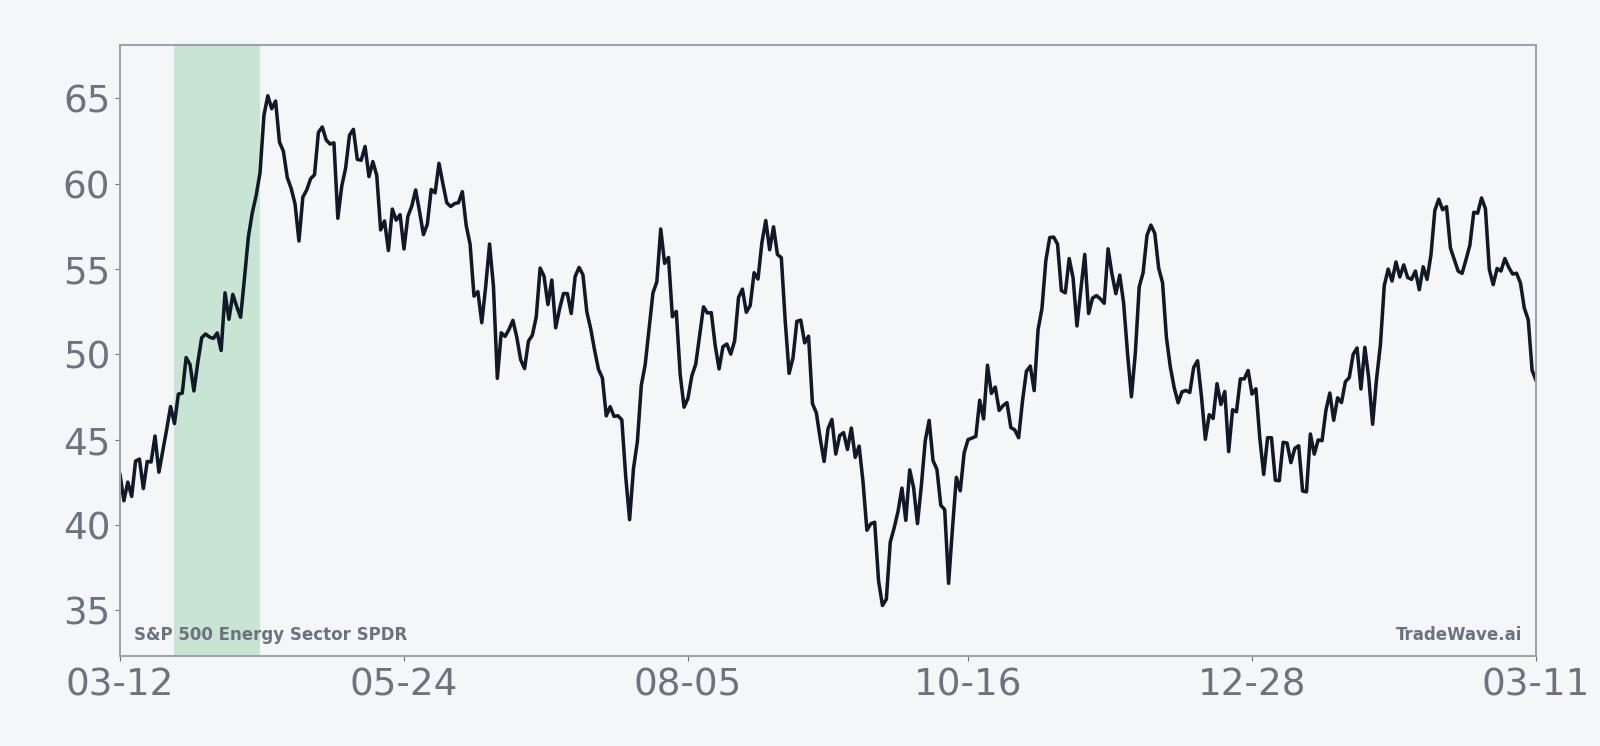
The historical seasonal trend line suggests that gains have tended to build steadily rather than arriving in a single spike. In many years, XLE has started the window with modest strength, absorbed a mid-window wobble, then pushed to its best levels toward the back half of the period. That profile lines up with a market that digests early macro headlines before leaning into energy exposure as the quarter develops.
Year-by-year bars that combine net results with peak run-ups and worst drawdowns show how consistently the window has favored longs while still delivering sizable swings.
History does not guarantee future results, and even in a 100% winning sample the worst intraperiod drawdowns have been several percentage points, which can be painful for traders using leverage or tight stops.
Price and near-term drivers
XLE last traded around 89, with a one-month gain of 7.58% and average 20-day volume near 66.2 million shares, reflecting heavy interest in the sector. Options traders have been leaning into the ETF with risk-reversal strategies that pair downside protection with upside exposure, a sign that some desks see room for further gains but want insurance against a pullback.[2] Retail investors have also been active, pouring millions into XLE during bouts of market turmoil tied to U.S.-Israeli strikes on Iran, using the fund as a liquid way to express views on energy and geopolitics.[3]
The chart below situates the latest move in its recent multi-month context.
Strategists have been flagging the energy sector as a potential breakout candidate, pointing to converging trendlines and relative strength versus parts of the broader market.[1] In options markets, some traders have used XLE calls to position for a sector bounce after periods of underperformance, effectively treating the ETF as a proxy for a catch-up trade.[2] That backdrop of bullish positioning and geopolitical sensitivity means any move that lines up with the seasonal window could be amplified by flows already in motion.
Geopolitical risk remains a key macro driver. Strikes involving the U.S. and Israel against Iranian targets have sharpened focus on supply disruptions and risk premia in crude benchmarks, which in turn feed directly into XLE’s underlying holdings.[3] At the same time, the market is navigating a mid-cycle policy environment where fiscal and regulatory decisions around energy transition, drilling permits and export policy can swing sentiment quickly. For an ETF that sits at the intersection of oil prices, policy and retail speculation, that is a combustible mix heading into a historically active slice of the calendar.
What to watch as the window opens
The 23-day midterm-year window for XLE starts on Mar 26 and runs into late April, overlapping a period when Washington often debates budget priorities and energy policy for the coming year. Historically, this has been a constructive stretch for the ETF, with every one of the last six midterm-year windows finishing higher and average gains near 5%. The key question is whether today’s elevated price and crowded positioning blunt that pattern or reinforce it.
Traders will be watching three things in particular. First, how XLE behaves on any early pullback inside the window. In prior cycles, some of the best eventual winners still saw 3% to 5% drawdowns from entry before recovering, so a sharp dip would not be out of character. Second, whether options and retail flows keep building or start to fade. Continued use of risk-reversal structures and net buying by smaller investors would signal that the ETF remains a favored vehicle for expressing energy views, which could add fuel to any move that lines up with the historical pattern.[2][3] Third, the policy and geopolitical calendar: headlines around Middle East tensions, U.S. export rules or drilling approvals can all act as catalysts that either accelerate the typical seasonal climb or knock it off script.
Add it up: XLE is heading into a midterm-year window that has been six-for-six on the upside, with a track record of strong rallies and tradable swings. For investors and traders who care about timing, how the ETF trades between late March and late April will offer a clean test of whether that pattern still has power in a market shaped by new energy politics and a very different price regime.