Recession, 1 Million Layoffs Threaten Small Caps as Russell 2000 Ishares ETF (IWM) Slides
Russell 2000 Ishares ETF is under pressure ahead of an April 18 midterm-year window that has often rewarded bearish positioning and featured sharp swings in small caps.

Key takeaways
- A 34-day seasonal window for Russell 2000 Ishares ETF tied to midterm election years begins on Apr 18.
- Across the last 6 midterm cycles, this window has favored short setups, with 83% profitable years for the short direction.
- Average gain in winning short years is 6.65%, while including all years brings the average move to 5% in favor of the short side.
- Intraperiod swings have been large, with several years showing double-digit peak drawdowns against the entry before resolving lower.
- The pattern clusters in the early part of the midterm election year, when policy uncertainty and growth worries often weigh most on small caps.
- Traders should treat this as a volatility window rather than a one-way bet, given the mix of strong favorable moves and deep adverse excursions.
According to historical data from TradeWave.ai, this specific midterm-year stretch has behaved very differently from an average spring for small caps, and the next iteration is now on the calendar.
Seasonal window
Russell 2000 Ishares ETF has moved in favor of the short side in 5 of the last 6 midterm election years during this 34-day window, with average winning short trades of 6.65% and an all-years average move of 5% in the short direction. The upcoming window begins on Apr 18 and runs through late May, landing squarely in the early part of the midterm election year when policy and growth jitters have often hit smaller companies hardest. That combination of timing and direction makes this slice of the calendar stand out for traders who care about the presidential cycle, because the results aggregate across the last six midterm years rather than a run of consecutive calendar years.
Grouping by the presidential election cycle matters here because midterm years tend to be when Washington tightens the screws on policy and markets digest earlier stimulus. For small caps, that has often meant higher sensitivity to rate expectations, regulation and fiscal debates than in the pre-election year that follows, when incumbents typically lean more supportive of growth. This pattern window captures that early midterm tension, just before the market starts to look ahead to the more traditionally risk-on pre-election phase.
This seasonal window begins on Apr 18 and spans 34 trading days. Historically, during this period, Russell 2000 Ishares ETF has shown a clear bearish tendency for the short direction, with 83% of the six historical midterm-year samples ending lower from the perspective of a short trade. The trade direction is explicitly short, so years where IWM fell were favorable for the pattern, while the single year with a net gain for the ETF represented a losing outcome for the short setup.
The win–loss split is straightforward: 5 winners and 1 loser for the short side across those six midterm election years. Average profit of 6.65% reflects only the winning short years, while the 5% figure for Avg Profit - All includes every year in the sample, including the one losing short year. Median profit of 5.78% sits just below the average, which points to a fairly consistent cluster of downside outcomes rather than one outlier driving the stats.
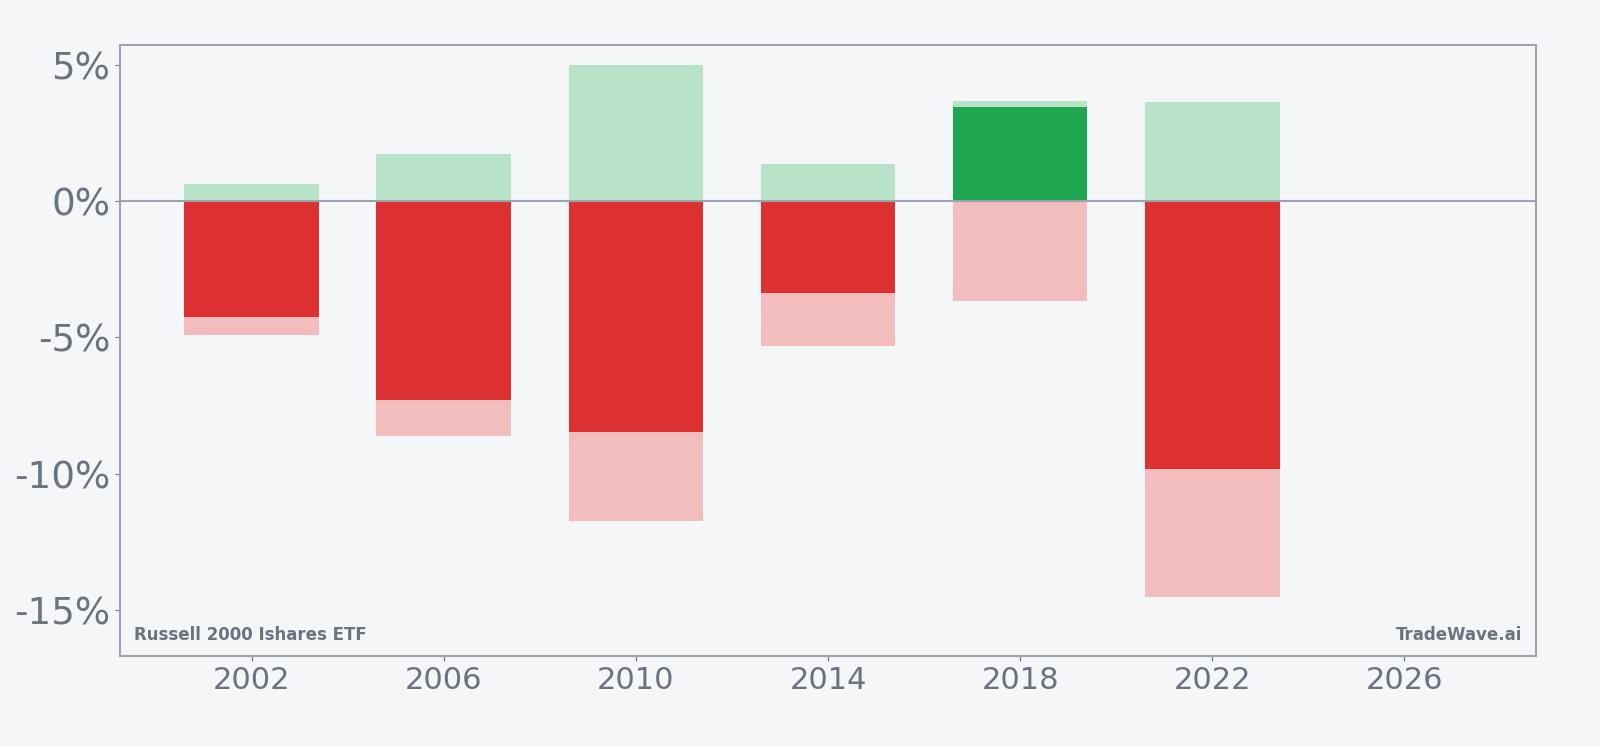
Intraperiod behavior has been anything but quiet. In 2022, for example, the ETF’s best move in favor of the short side during the window reached 3.63%, while the worst drawdown against the short position stretched to 14.53% before prices ultimately finished 9.82% lower from the short perspective. In 2010, the best point-to-peak move for shorts was 4.99%, but the worst adverse excursion hit 11.74% before the trade closed with an 8.49% gain for the short direction. Those maximum favorable and maximum adverse excursions show that this window has often involved sharp swings both ways before resolving lower.
The per-year table shows 2006 and 2022 as two of the strongest years for the short pattern, with net returns of 7.3% and 9.82% in favor of the short side, respectively. The weakest year for shorts was 2018, when IWM rallied 3.47% during the window, turning that iteration into a losing outcome for the pattern despite a still-balanced mix of favorable and adverse intraperiod moves. That contrast underscores that even in a window with a strong directional bias, squeezes against the trade can and do occur.
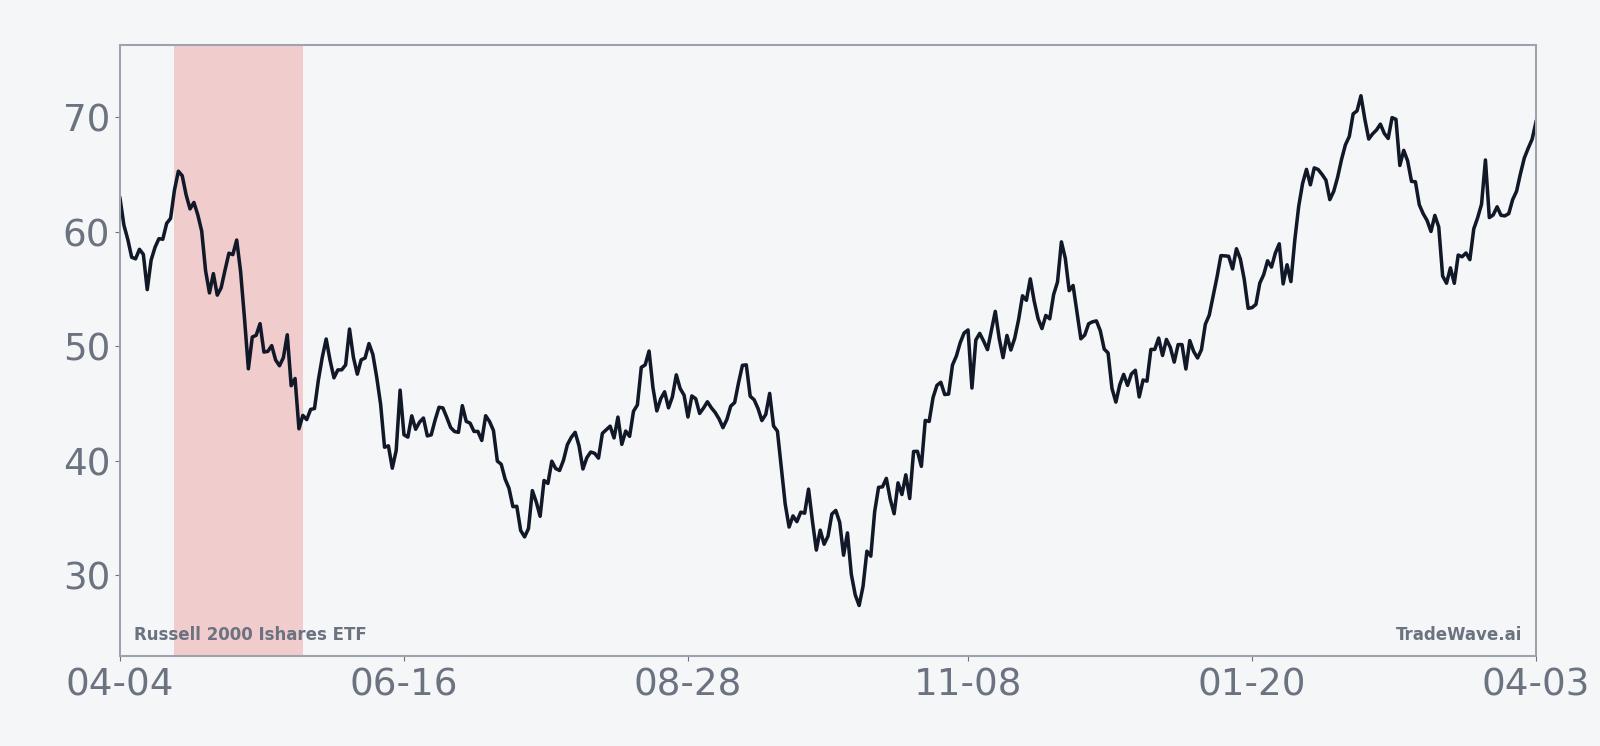
The historical seasonal trend chart for this window shows a tendency for IWM to drift lower fairly steadily across the 34 days in most midterm years, rather than collapsing all at once. The average path slopes down with only modest mid-window bounces, which suggests that when the pattern has worked, it has often done so through persistent pressure rather than a single shock event.
A second view combines net outcomes with the best and worst intraperiod swings to show how far IWM has typically traveled in both directions.
The cumulative return profile across the six midterm years lines up with those stats, with a 32% total gain for the short direction and an annualized return of 4.87% for this specific window. Add it up and the pattern has delivered more often than not for traders positioned with the short bias, even after accounting for the one losing year.
History does not guarantee future results, and adverse excursions within this window have at times been large even in years that ultimately finished in favor of the short side.
Price and near-term drivers
Russell 2000 Ishares ETF last traded at 215.2, down 2.04% on the day, extending a one-month slide of 5.53% and leaving the fund about 20.8% below its 52-week high of 271.6 while still 27.6% above its 52-week low. Average 20-day volume sits at roughly 52.9 million shares, and the ETF is trading well under its 50-day moving average of 259.47, a sign that small caps have already been under pressure heading into the midterm-year spring window.
Macro headlines have not been kind to smaller companies. Recession signals tied to 1 million layoffs in 2025 raised questions about domestic demand and financing conditions for small-cap balance sheets, which tend to be more sensitive to credit spreads and bank lending standards than their large-cap peers.[1] Currency markets have also been flashing concern around tariff deadlines, a risk that can hit globally exposed small manufacturers and niche exporters inside the Russell 2000 harder than mega caps with more diversified footprints.[2]
At the same time, there have been pockets of strength inside the ETF. Regional banks and biotech names have been key drivers of IWM’s tape, with prior commentary flagging the fund’s potential for a breakout when those groups catch a bid.[3] That sector mix helps explain why the ETF can swing sharply around policy headlines on rates, regulation and healthcare, even when the broader market looks calmer.
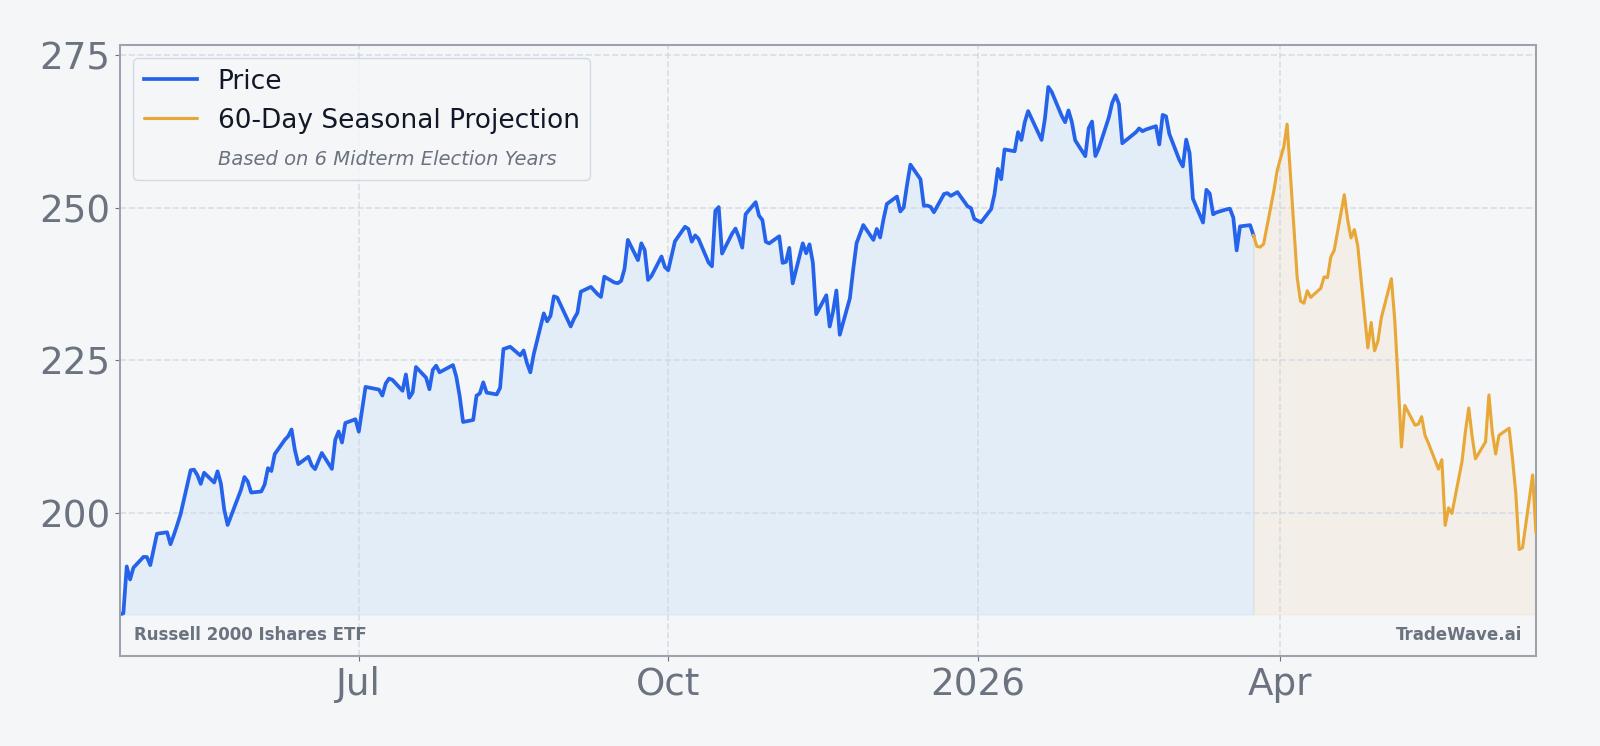
The chart below situates the latest move in its recent multi-month context, alongside a 60-day seasonal projection that reflects the historical midterm-year pattern.
Macro and policy backdrop
The early part of the midterm election year often brings a messy mix of policy fights and macro crosscurrents, and this cycle is no exception. Concerns about a recession and layoffs have already pushed investors toward quality and away from smaller, more cyclical names that dominate the Russell 2000.[1] At the same time, expectations for Federal Reserve rate cuts have offered some support, though commentary has framed the likely impact as muted for risk assets like IWM given the broader economic backdrop.[4]
Trade and tariff policy remain another swing factor. Currency markets reacting to tariff deadlines suggest investors are still trying to price the impact of potential trade frictions on supply chains and export demand.[2] Small caps with narrower product lines and less pricing power can feel that pressure more acutely than diversified multinationals, which helps explain why IWM has often traded as a high-beta expression of domestic and trade policy risk.
Political tensions around the Federal Reserve and the administration have also been flagged as a source of volatility, with prior episodes of Trump–Powell friction coinciding with choppy trading in rate-sensitive sectors and small caps.[5] For a fund that leans heavily on regional banks and early-stage growth stories, any renewed debate over the path of policy rates or regulatory oversight can quickly feed into earnings expectations and multiples.
What to watch as the window opens
For traders tracking this pattern, the key dates are straightforward: the seasonal window opens on Apr 18 and runs for 34 trading days into late May. Historically, the short side has had the edge in this stretch, but the path has rarely been smooth. The most telling confirmation that the pattern is repeating would be a continuation of the current downtrend in IWM, with rallies during the window stalling below the 50-day moving average and sellers reasserting control after policy or data-driven bounces.
On the macro front, watch upcoming labor data and any fresh signals on layoffs or hiring freezes, given how closely small caps have traded with recession narratives in prior cycles.[1] Tariff headlines and currency-market reactions around trade deadlines are another key input, especially for industrial and manufacturing names inside the ETF that are exposed to global supply chains.[2] If those stories flare up during the window, they could reinforce the historical tendency toward downside pressure.
Sector behavior inside IWM will matter just as much as the index level. Regional banks and biotech have been important swing factors, so traders will be watching whether those groups continue to drive volume and leadership or start to fade.[3] A renewed push higher in those pockets could blunt the seasonal pattern, while renewed weakness would line up with the historical short bias.
Finally, volatility itself is a signal in this window. Past midterm years have seen large maximum adverse excursions even in winning short trades, so sharp squeezes against the prevailing move would not be unusual. If IWM sees fast, two-way swings with intraday reversals and elevated volume as the window progresses, that would be consistent with the historical profile. A quiet, low-volatility drift higher, by contrast, would be a clear break from the pattern and a sign that this midterm year is writing its own script.
Sources
- U.S. in recession with 1 million layoffs (source_id 2, date not specified).
- Currency markets signal alarm on tariffs (source_id 12, date not specified).
- Potential breakout for IWM and DIA (source_id 8, date not specified).
- Fed rate cuts to support equities (source_id 5, date not specified).
- Stock bulls worry about factors beyond shutdown (source_id 3, date not specified).
- Trump-Powell tensions may rise (source_id 4, date not specified).
- Markets brace for Trump-Powell tensions (source_id 13, date not specified).
- Recession and layoffs macro theme (derived from source_id 2, date not specified).
- Tariff impacts macro theme (derived from source_id 12, date not specified).
- Small-cap drivers sector theme (derived from source_id 8, date not specified).