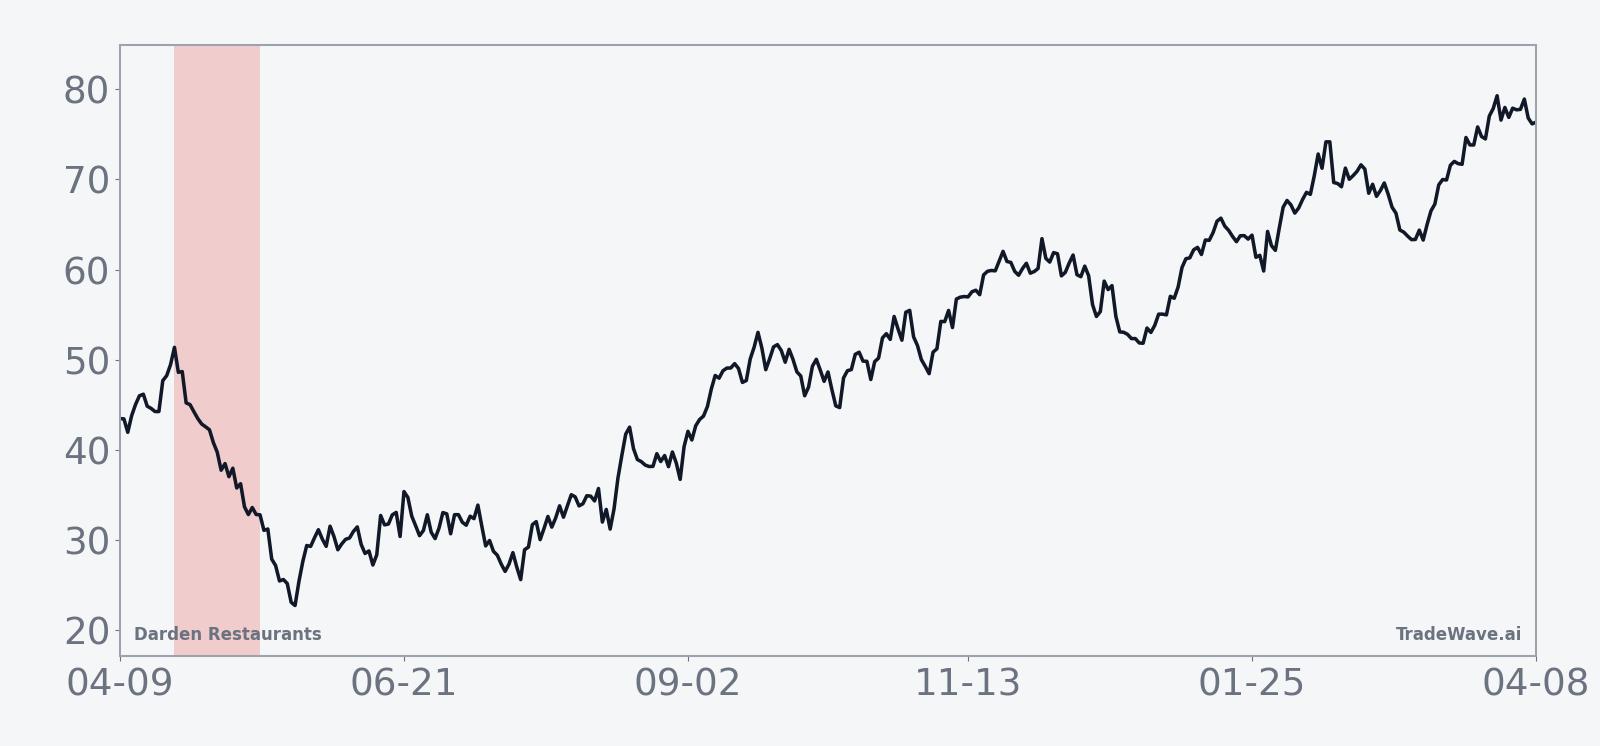
Darden Restaurants (DRI) Has Dropped in 6 of 7 Midterm Windows Starting April 23
Darden Restaurants is approaching a late-April midterm-year stretch that has historically favored short setups, just as the stock trades near the upper end of its 12‑month range.

Key takeaways
- Darden Restaurants enters a 23-day midterm-year window on Apr 23 that has historically favored short trades.
- Across the last 7 midterm election years, this window has produced profitable short outcomes in 6 years and losing results in 1 year, for a Percent Profitable of 86%.
- Average gains in winning short years have been 7.49%, while including the lone losing year brings Avg Profit - All to 6%.
- The pattern’s TradeWave Ratio of 1.97 and Sharpe ratio of 1.7 point to meaningful directional follow-through relative to volatility.
- Intraperiod swings have been sizable, with several years showing double-digit worst drawdowns from entry even when the short ultimately worked.
- With DRI trading about 9.1% below its 52-week high after a 2.3% daily gain, this historically weak midterm window lands against a still-elevated price backdrop.
According to historical data from TradeWave.ai, this late-April stretch has behaved very differently from an average month on the calendar for Darden Restaurants, and the next iteration is now less than a month away.
Seasonal window
Darden Restaurants has delivered short-friendly downside in 6 of the last 7 midterm election years during the 23 trading days starting Apr 23, with winning shorts averaging 7.49% gains and all years averaging 6%. Shares finished Wednesday at $200.52, up 2.3% on the day and about 9.1% below the 52-week high of $220.65, leaving the stock elevated but off its peak as this historically weak stretch approaches.[1]
The pattern groups only midterm election years, a phase that often brings policy uncertainty, shifting expectations for consumer spending and tighter scrutiny of corporate pricing. For a restaurant operator tied closely to discretionary demand, that election-cycle filter matters because it lines up the seasonal window with the part of the political calendar when Washington debates around wages, food inflation and labor rules tend to be loudest.
This seasonal window begins on Apr 23 and spans 23 trading days. Historically, during this period, Darden Restaurants has shown a clear downside tendency that aligns with a short trade direction rather than a long bias.
The Trade Direction for this pattern is short, and the track record is unusually consistent for a single stock. Percent Profitable stands at 86%, with 6 winning short years against just 1 losing year across the last 7 midterm election cycles. In other words, shorts have historically worked far more often than they have failed in this specific slice of the calendar.
Avg Profit of 7.49% reflects only the winning short years, while Avg Profit - All of 6% includes every year in the sample, including the one losing outcome. That gap between winners-only and all-years averages is relatively small, which suggests the lone losing year did not fully erase the gains from the stronger short setups.
The Sharpe ratio for this window is 1.7, indicating that the risk-adjusted average return based on end-of-window outcomes has been solid rather than noisy. The TradeWave Ratio of 1.97 measures how far price typically travels in the trade direction within the window, independent of the final close, and it points to meaningful intraperiod follow-through when the short side has been in control.
Looking at individual years, the strongest short-friendly outcome came in 2010, when the stock fell 9.68% from entry to exit, with a worst intraperiod drawdown of 15.88% from the starting price before the window closed. The softest year for shorts was 2014, which posted a small 0.78% loss for the pattern as DRI edged higher instead of lower.
Maximum favorable move and maximum adverse move inside the window have both been large in several cycles. In 2002, for example, the best point-to-trough move in the short direction reached 8.95% before the trade was closed with a 7.09% gain, while 2018 saw a 5.22% worst drawdown against the short before the stock ultimately finished 4.12% lower from entry. MFE and MAE refer to those best and worst intraperiod excursions from the entry price, capturing the peak run-up in the trade direction and the deepest drawdown against it.
The historical seasonal trend chart for this window shows DRI typically starting to weaken early in the period, with most of the average decline accruing in the first half of the 23-day span before stabilizing into the close. That shape suggests shorts that have worked in the past often saw their edge build quickly rather than grinding lower throughout the entire window.
The cumulative return profile across the last seven midterm election years adds up to a 52% total gain for the short pattern, which is a sizable number for a window that lasts just over four weeks each cycle. Add it up: repeated midterm-year weakness in this late-April stretch has been the rule, not the exception, for Darden.
Year-by-year net returns and intraperiod swings show how often shorts have worked and how deep both rallies and selloffs have run inside the window.

History does not guarantee future results; adverse excursions (MAE) can be large even in winning windows.
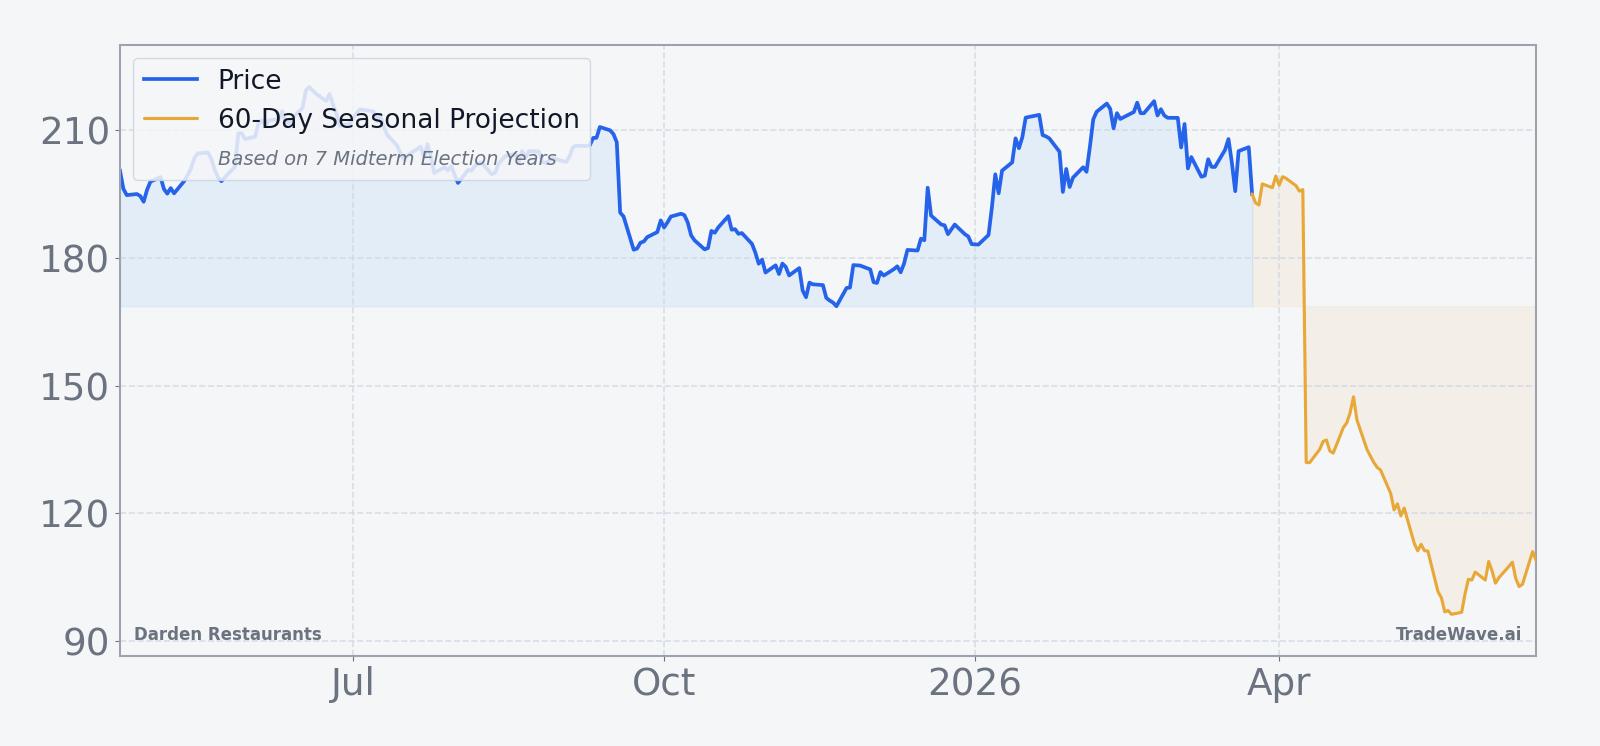
Price and near-term drivers
Darden Restaurants closed at $200.52 on Mar 25, up 2.32% on the session, with roughly 1.7 million shares changing hands against a 20-day average volume of about 1.66 million.[1] The stock sits between its 50-day moving average of $207.50 and its 52-week low of roughly $166.51, leaving it about 9.1% below the 12-month high of $220.65 and well above the bottom of the range.[1]
In Sep 2025, Darden missed Q1 earnings estimates but raised its fiscal 2026 sales outlook, projecting revenue growth of 7.5% to 8.5%.[1] In Dec 2025, the company again nudged guidance higher, lifting full-year sales growth to 8.5% to 9.3% after Q2 revenue topped expectations even as earnings per share came in a touch light versus forecasts.[2] That combination of modest EPS misses and stronger top-line momentum has kept the fundamental story constructive heading into 2026.
Back in Oct 2025, Goldman Sachs upgraded Darden to Buy with a $225 price target, citing favorable consumer exposure and market share gains in casual dining.[3] In Jan 2026, DRI appeared on a CNBC list of overbought names after its relative strength index hit 77, with the stock up 6% on the week amid mixed analyst views, underscoring how quickly sentiment can swing in either direction for the name.[4]
The chart below situates the latest move in its recent multi-month context, alongside a 60-day seasonal projection.
What to watch as the window opens
The key date on the calendar is Apr 23, when the 23-day midterm-year window begins. Traders will be watching whether DRI stalls or reverses if it pushes back toward the $220 area, which has marked the 52-week high, or instead breaks cleanly to new highs against the historical short-friendly pattern.
Price behavior inside the window will matter as much as the final outcome. A quick fade in the first half of the period would line up with the historical seasonal trend, which has typically seen weakness front-loaded rather than delayed. A grind higher with shallow pullbacks would contradict the pattern and signal that this midterm cycle is behaving differently from prior ones.
Macro and policy headlines around consumer spending, wage growth and food inflation could add fuel in either direction, especially if they shift expectations for restaurant traffic or pricing power. With Darden still trading well above its 52-week low and guidance pointing to high-single-digit revenue growth, any disappointment on those fronts during the window could have an outsized impact.
Finally, intraperiod volatility deserves respect. Past midterm-year windows have seen double-digit worst drawdowns from entry even in years that ultimately delivered profitable shorts, so traders will want to size positions and risk limits with those historical swings in mind. If DRI starts the window strong and then snaps lower in a hurry, that would echo the sharp reversals seen in years like 2010 and 2022; if instead it trends steadily without those spikes, it would mark a clear break from the usual script.
Sources
- CNBC, "Olive Garden owner Darden Restaurants disappoints on earnings but hikes sales outlook," Sep 18, 2025
- CNBC, "Olive Garden owner Darden Restaurants hikes revenue outlook for second straight quarter," Dec 18, 2025
- CNBC, "Goldman Sachs upgrades Darden to Buy," Oct 20, 2025
- CNBC, "This week’s most overbought names include Darden Restaurants and Target," Jan 17, 2026