Trust VIX Short-Term Futures ETF (VIXY) Has Dropped 10 of 10 Years in This 28-Day May Window
Trust VIX Short-Term Futures ETF is heading toward a May volatility window that has been consistently bearish for long VIX exposure over the past decade.

What is the seasonal pattern for Trust VIX Short-Term Futures ETF (VIXY)?
Trust VIX Short-Term Futures ETF has fallen in 10 of 10 years during this late-spring 28-day window, with an average gain of 13.05% for traders positioned short in winning years.
- 10 for 10 in this window, with an average 13.05% profit for the short trade across winning years.
- Seasonal window runs 28 trading days starting May 8, using a 10-year historical lookback.
- Percent Profitable is 100%, with 10 winners and 0 losers for the short-direction setup.
- Annualized return for the pattern is 12.91%, with a Sharpe ratio of 2.16 and a TradeWave Ratio of 3.14.
- Individual years have seen sizable intraperiod swings, including adverse moves of more than 20% before the trade finished profitable.
- Cumulative return across the decade-long sample is 236% for the short strategy in this specific VIXY trading window.
According to historical data from TradeWave.ai, this upcoming stretch has behaved very differently from an average month for VIXY. The next section walks through how that pattern has played out in prior years and what it means for traders who use the ETF as a volatility hedge.
How has Trust VIX Short-Term Futures ETF (VIXY) traded in this May seasonal window?
Trust VIX Short-Term Futures ETF has delivered a profitable short trade in this 28-day May window in every one of the past 10 years, averaging a 13.05% gain for the strategy. The next iteration of that volatility seasonal pattern begins on May 8 and runs through early June, a period that has repeatedly seen VIXY grind lower as equity markets stabilize. For traders who lean on VIXY as a tactical hedge, that history matters because it points to a window where long volatility exposure has often bled value even when intraday spikes looked tempting.
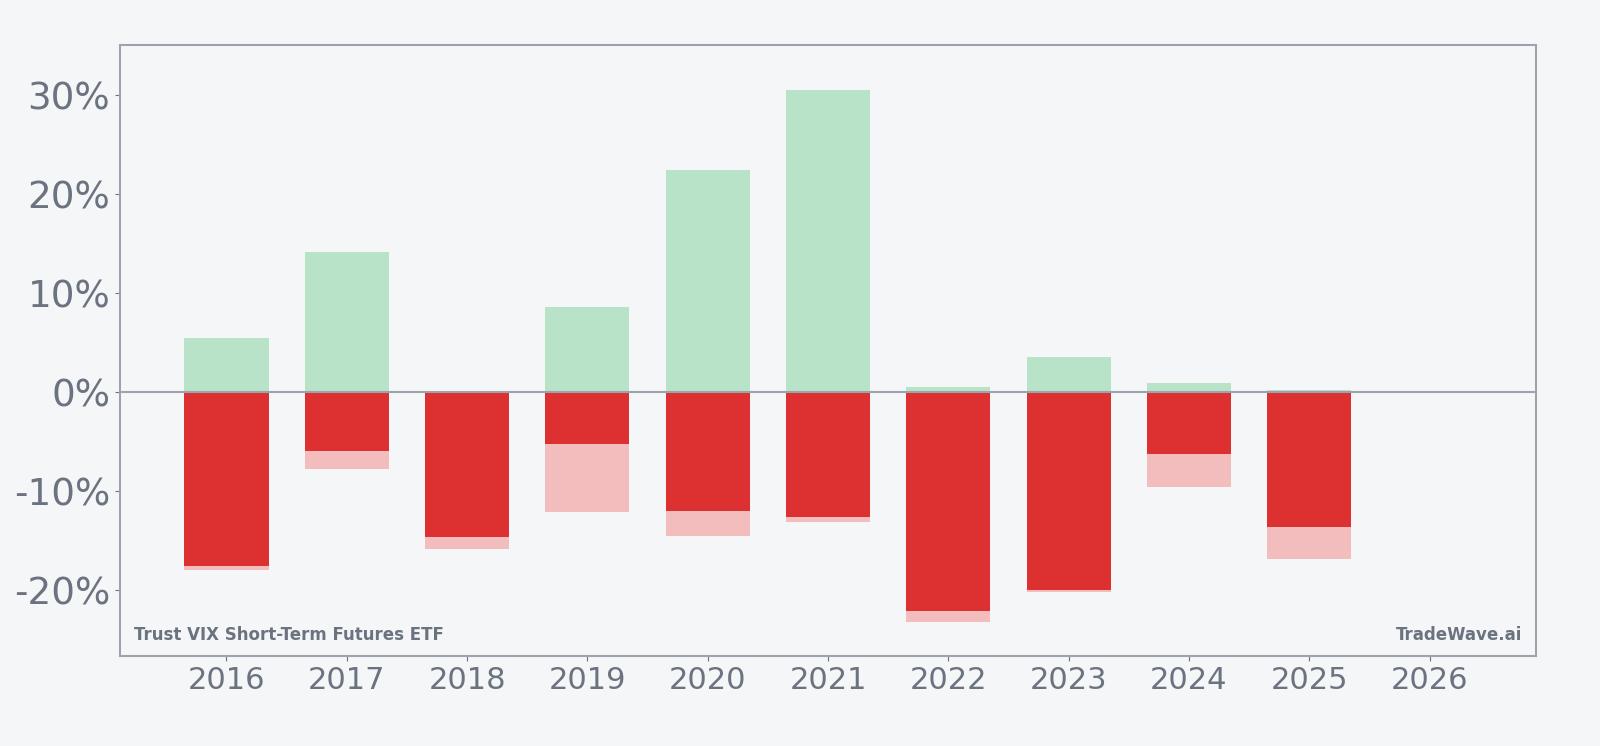
A second view layers in both the best and worst intraperiod swings for each year.
Historically, this VIXY seasonal trend has been firmly aligned with the short direction: all 10 years in the sample show the ETF finishing the window lower, which translates into a 100% win rate for traders who were short volatility during this slice of the calendar. Average profit of 13.05% and a median outcome of 13.18% suggest the pattern has not been driven by a single outlier year but by a cluster of consistent declines. The annualized return of 12.91% and a Sharpe ratio of 2.16 underline that, on a risk-adjusted basis, this has been one of the cleaner short-volatility windows in the dataset.
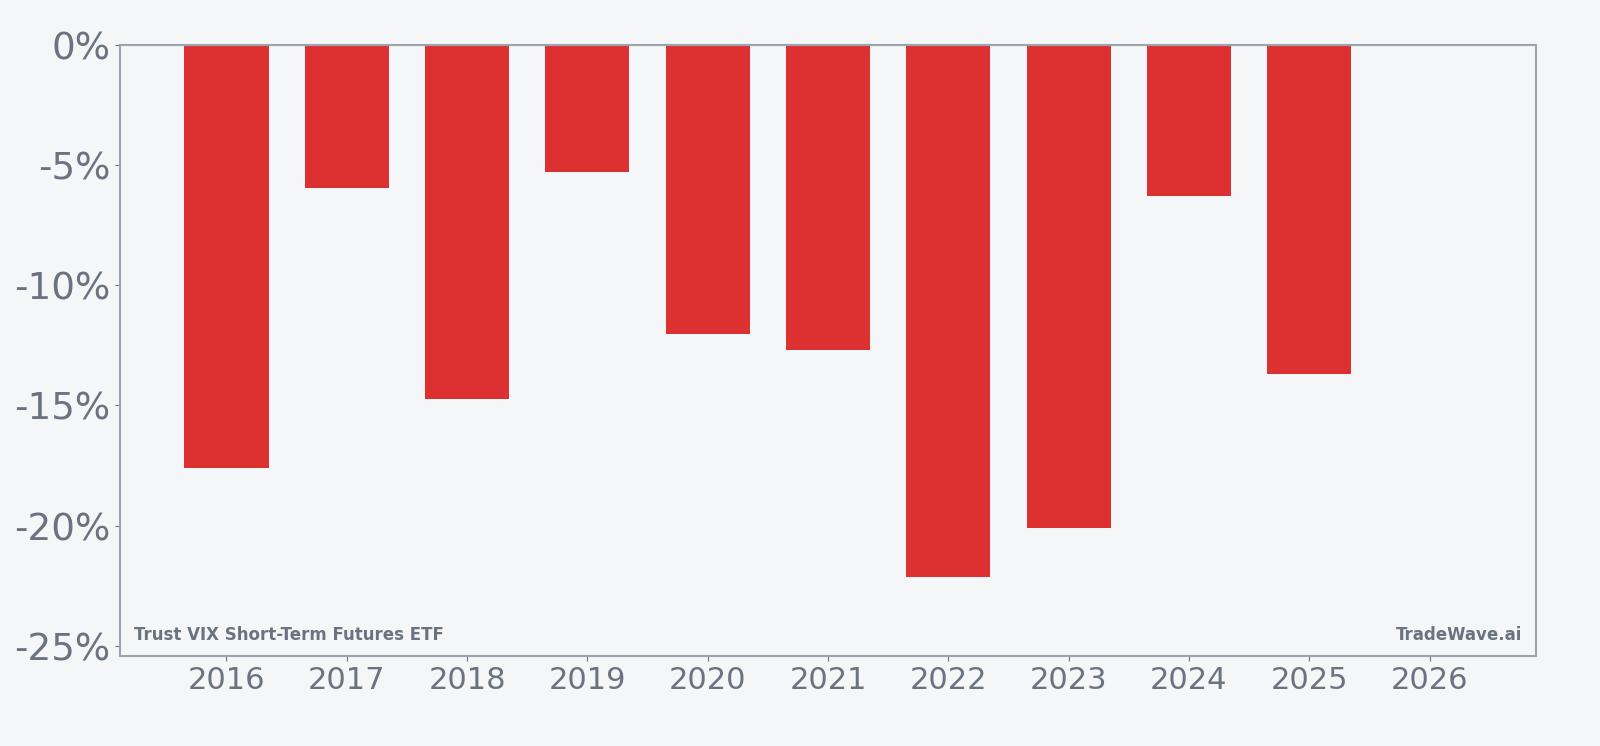
The per-year table shows how that has played out in practice. In 2022, for example, a short entered at an effective VIXY level of 435.8 and exited 28 days later at 339.4, a net return of about 22.12% for the trade as the ETF slid through the window. By contrast, 2017 was a milder iteration, with a short from 3,760 to 3,536 translating into a 5.96% gain, still positive but far less dramatic than the double-digit years. Across the decade, the weakest outcome for the short strategy was 5.28% in 2019, while the strongest was 22.12% in 2022, which helps explain the 236% cumulative return figure for the pattern.
Intraperiod swings have been meaningful even in winning years. Maximum favorable excursions, the best point-to-peak move in the trade direction, reached as high as 30.52% in 2021, showing how quickly VIXY has sometimes trended lower once the window got going. On the other side, maximum adverse excursions, the worst drawdown from entry, have been as deep as 23.27% in 2022, a reminder that VIXY can spike sharply higher before resuming its typical late-spring fade. That combination of large favorable and adverse moves is captured in the TradeWave Ratio of 3.14, which measures how far price typically travels in the trade direction within the window regardless of where it finishes.
The 10-year average seasonal curve slopes lower through most of the 28 days, with the bulk of the decline often front-loaded into the first half of the window. In several years, including 2016 and 2020, the short trade saw its best gains early as VIXY retreated from prior volatility spikes, then flattened out as the window progressed. Other years, such as 2019 and 2024, show a choppier path where the ETF bounced but still ended the period lower, reinforcing the idea that the bias has been persistent even when the day-to-day tape felt noisy.
The stacked bar chart that combines net returns with maximum favorable and adverse excursions makes the risk profile clear. Every bar finishes below zero, consistent with a profitable short, yet many show tall wicks in both directions, reflecting intraday or intra-window volatility that could challenge tight risk management. For traders who use VIXY as a hedge against equity drawdowns, that history suggests this specific late-spring stretch has often been a time when hedges decayed quickly unless markets were under acute stress.
History does not guarantee future results; adverse excursions can be large even in winning windows, and VIXY’s path in any single year can diverge sharply from the historical average.
Why does Trust VIX Short-Term Futures ETF (VIXY) follow this seasonal pattern?
One likely driver is the way equity markets often transition from late-winter turbulence into calmer trading as the second quarter progresses, which tends to pressure implied volatility and the VIX futures VIXY holds. Institutional portfolio rebalancing and systematic volatility-selling strategies can also ramp up after the first quarter, adding supply to VIX futures and weighing on long-volatility products. This pattern may also reflect the clustering of major macro and earnings events earlier in the year, leaving this May window with fewer catalysts to sustain elevated volatility.
What is driving Trust VIX Short-Term Futures ETF (VIXY) today?
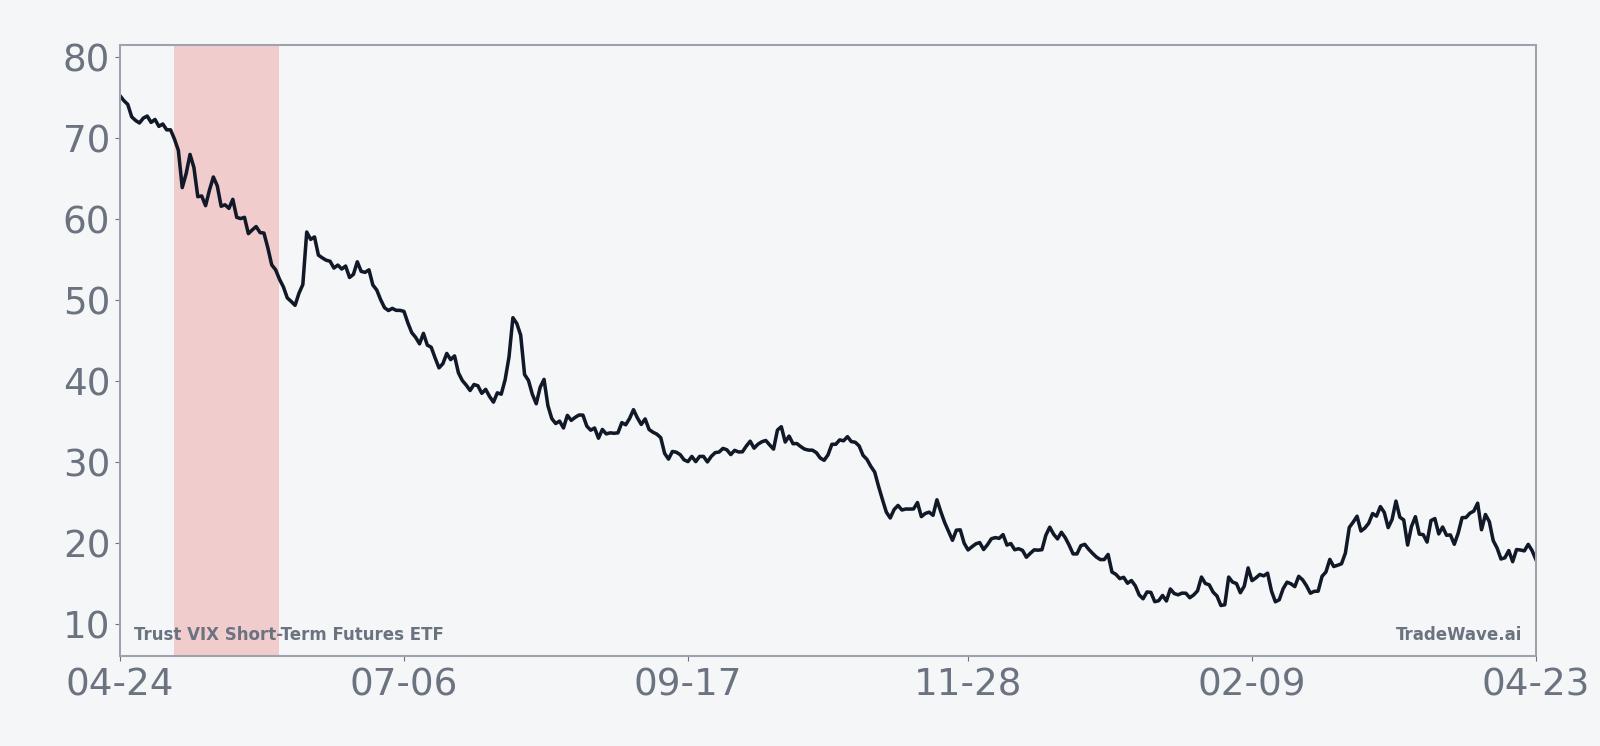
VIXY is designed to track short-term VIX futures, so its day-to-day moves are tied less to company news and more to swings in equity-market fear and the shape of the volatility term structure. Over the past month the ETF has dropped 27.26%, a steep slide that lines up with a calmer backdrop for stocks and a typical post-spike bleed in implied volatility. That decline has pulled VIXY closer to the lower end of its 52-week range between 24.81 and 66.93, even as 20-day average volume of about 3.6 million shares shows traders are still actively using it as a tactical hedge or trading vehicle.
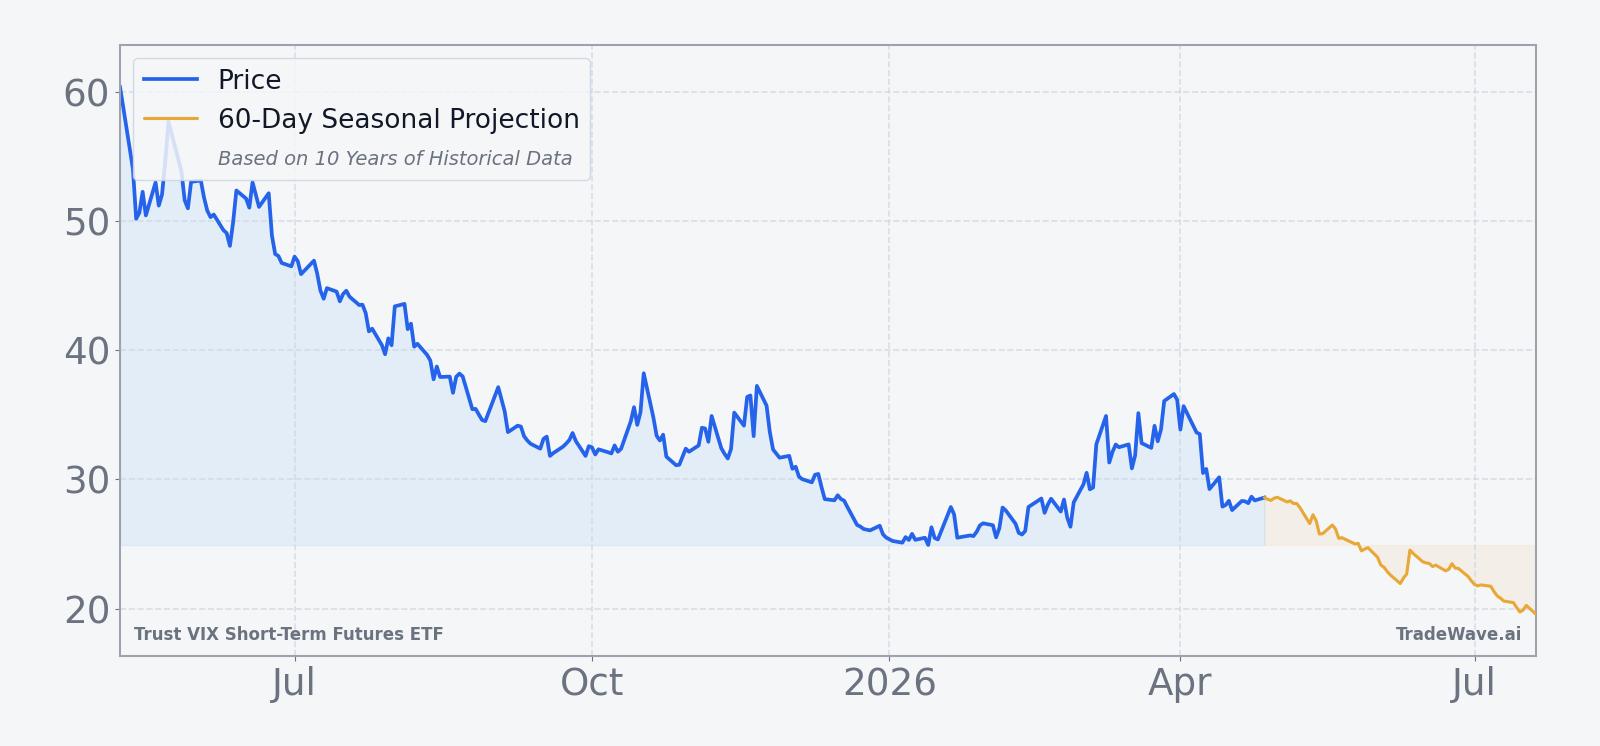
The chart below situates the latest move in its recent multi-month context and overlays a 60-day seasonal projection.
Structurally, VIXY holds a rolling position in short-term VIX futures, which means it is sensitive not just to spot volatility but also to the roll yield created when the futures curve is in contango or backwardation. In quieter markets, the curve often slopes upward, so VIXY sells cheaper near-term contracts and buys more expensive longer-dated ones, a drag that compounds any decline in implied volatility itself. That mechanical headwind is one reason why the ETF has historically struggled in calm late-spring environments and why the May seasonal pattern has been so consistently favorable for short positions.
For investors using VIXY as a hedge against equity drawdowns, the combination of a sharp recent slide, proximity to the lower half of its 52-week range, and a historically weak late-spring seasonal window argues for careful sizing and time horizon discipline. The ETF can still spike if an unexpected macro shock hits, but the historical seasonality suggests that, absent a major surprise, this is a part of the calendar where long volatility exposure has often decayed quickly. Traders who instead use VIXY tactically on the short side will be watching whether the upcoming window once again lines up with a period of subdued realized volatility in equities.
What should traders watch as the VIXY seasonal window approaches?
As the May 8 start date nears, the first thing to watch is whether equity markets remain calm or slip back into a higher-volatility regime. The 10-year pattern has favored shorts when stocks grind higher or move sideways, allowing VIX futures to drift lower and roll yield to work against VIXY. A second focal point is the 52-week band between 24.81 and 66.93; if VIXY enters the window closer to the lower end of that range, the historical pattern suggests further downside has still been common, but intraperiod spikes have also been sharper from depressed levels.
Traders should also monitor how VIXY behaves around key macro events during the window, such as major inflation prints or central-bank meetings, which can temporarily overwhelm seasonal tendencies. If the ETF repeatedly fails to hold post-event spikes and quickly slides back, that would be consistent with the historical seasonal trend. On the other hand, a sustained break higher that persists through the bulk of the 28 days would mark a clear departure from the past decade’s behavior and signal that the volatility regime has shifted.
Finally, flows and positioning matter. Elevated trading volume around the start of the window, combined with persistent demand for VIXY calls or other long-volatility structures, would suggest investors are leaning into tail-risk hedges despite the historical headwind. If instead activity remains muted and the ETF continues to trade heavy on rallies, the stage would be set for the seasonal pattern to reassert itself. Either way, the upcoming 28-day stretch is a period where VIXY has not traded like an average month, and that alone makes it a window worth tracking closely.
Sources
About this seasonal analysis
Seasonal pattern data is sourced from TradeWave.ai, which analyzes historical price behavior across annual calendar windows going back up to 30 years. Read the full data methodology or the book The 100-Year Pattern by Afshin Moshrefi (2026 edition). Past performance of seasonal patterns does not guarantee future results. This article is for informational purposes only and does not constitute investment advice.