Russell 2000 Ishares ETF (IWM) Rallies Into Late May With a 93% Profitable Seasonal Stretch
Russell 2000 Ishares ETF is approaching a historically strong 59-day late‑May seasonal window even as the small-cap tracker trades just below its 52-week high.

What is the seasonal pattern for Russell 2000 Ishares ETF (IWM)?
Russell 2000 Ishares ETF has risen in 14 of 15 years during this late‑May 59-day window, with an average gain of 5.36% in winning years.
- 14 wins and 1 loss in this window over the past 15 years, with winning years averaging 5.36% gains.
- The upcoming seasonal window starts on May 23, 2026 and runs for 59 trading days, historically favoring long exposure in IWM.
- Percent Profitable stands at 93%, with 14 winners and just 1 loser across the sample.
- Including all years, the average outcome is a 5% gain, showing that the lone losing year has not erased the typical upside.
- Intraperiod swings have been meaningful, with both strong rallies and notable drawdowns inside the window before final results are set.
- Across the full lookback, the pattern has compounded to a 104% cumulative return, or roughly a 4.87% annualized pace.
According to historical data from TradeWave.ai, this late‑May stretch has behaved very differently from an average two-month span for small caps, and the next iteration is about to begin.
How has Russell 2000 Ishares ETF (IWM) traded in this late‑May seasonal window?
Russell 2000 Ishares ETF has posted gains in 14 of the past 15 years during this 59-day late‑May window, averaging 5.36% in winning years. The next window begins on May 23 with IWM last changing hands at 279.45, up 2.4% on the day and about 2.8% below its 52-week high of 287.58.[1] That combination of a strong historical tailwind and a price sitting near the top of its one-year range makes this small-cap seasonal pattern hard to ignore.
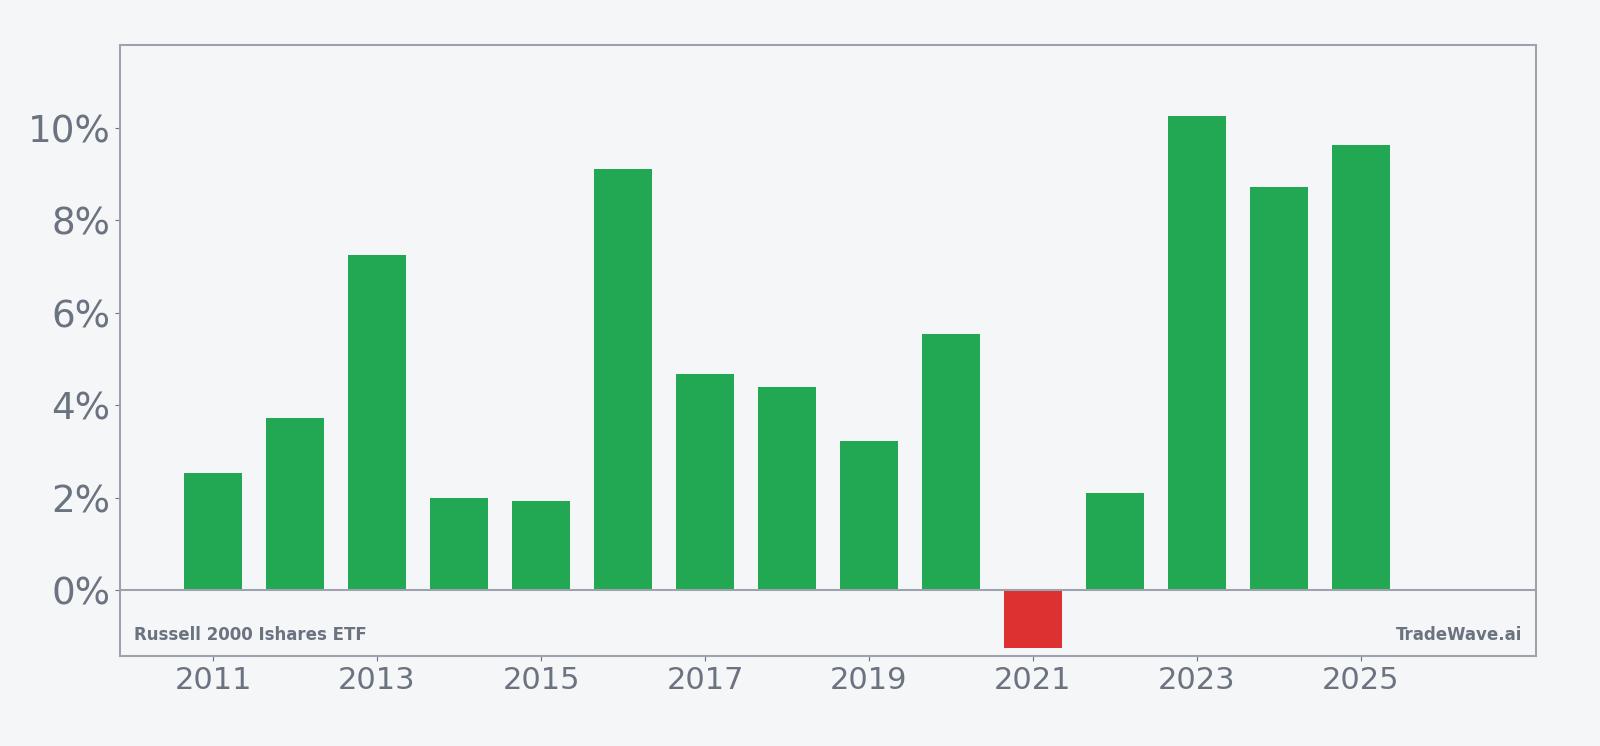
Historically this has been a long-biased window for IWM, with the trade direction classified as long and a 93% hit rate across the 15-year sample. The average gain across all years is 5%, only slightly below the 5.36% average for winners, which tells you the single losing year was relatively modest compared with the typical upside. That lone down year came in 2021, when the ETF slipped 1.25% over the window despite a maximum favorable move of 5.58% and a worst drawdown of 5.44% from the entry.
The strongest recent example was 2023, when IWM gained 10.26% in the window after a maximum favorable excursion of 11.72% and a relatively contained worst drawdown of 2.85%. The 2024 run was almost as strong, with an 8.72% net gain and an 11.85% peak rally from the entry price. Even softer years like 2019 and 2022 still finished positive, with 3.23% and 2.11% gains respectively, though both saw intraperiod pullbacks of more than 2.7% and as much as 8.42% before recovering.
The maximum favorable excursion and maximum adverse excursion profile shows why traders treat this as a high-energy small-cap window. In several years, IWM has rallied more than 10% from the entry point at some stage in the window, while the worst drawdowns have ranged from shallow 1% dips to deeper 8% slides before the final close. That mix of sizable rallies and meaningful pullbacks fits the ETF’s reputation as a higher-beta proxy for U.S. small caps.
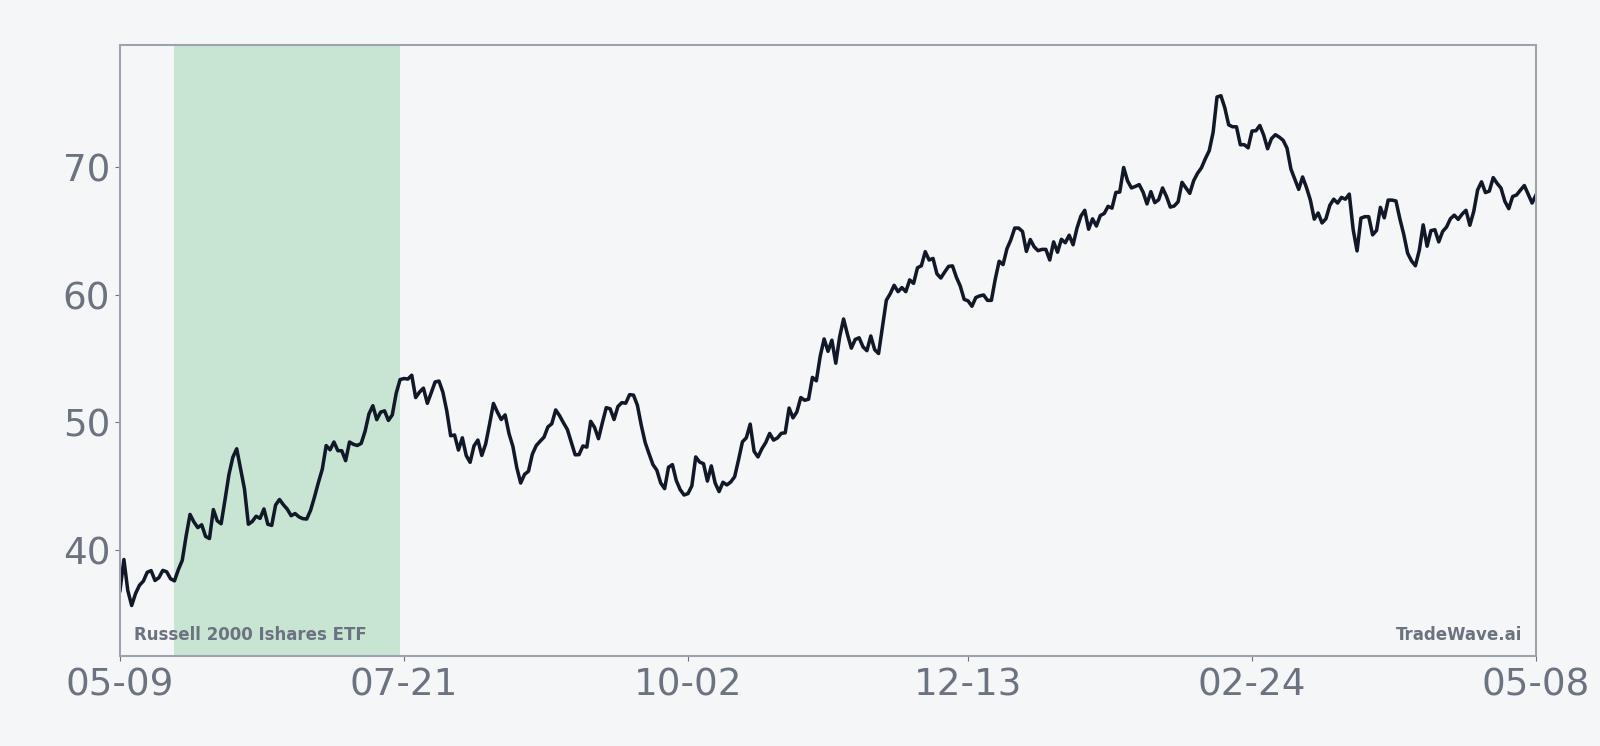
The 15-year seasonal trend chart shows gains tending to build steadily through the middle of the window rather than spiking only at the end. The average path slopes higher with relatively few flat stretches, suggesting that in many years the bulk of the move has unfolded gradually over several weeks. That kind of pattern can reward patience more than attempts to time a single inflection day.
A second view of yearly net results alongside peak rallies and worst drawdowns helps frame the upside and risk together.
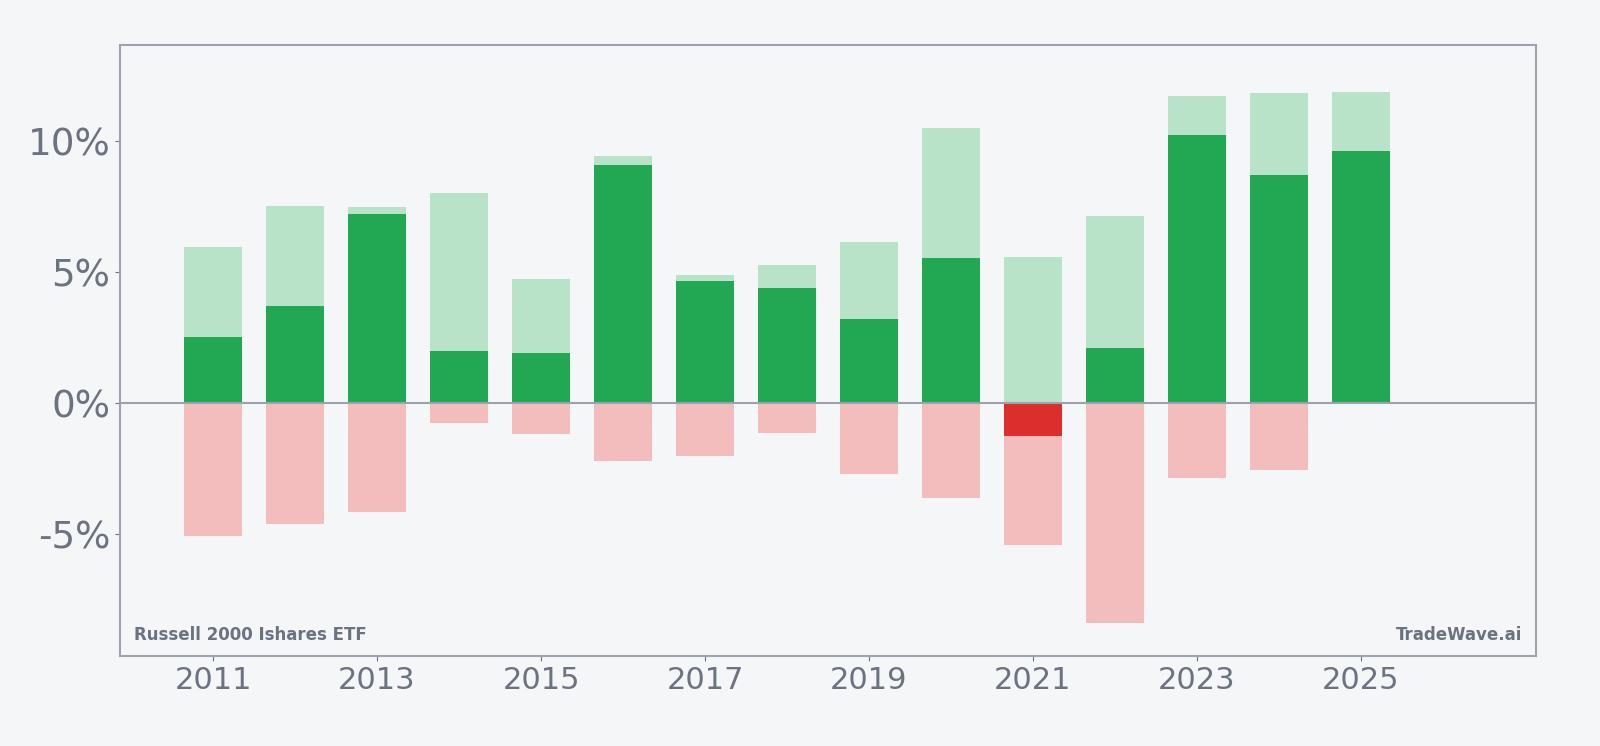
Across the full sample, the stacked view of net results, peak rallies and worst drawdowns shows a clear skew toward positive outcomes but with enough downside volatility to keep risk managers busy. Many years feature double-digit maximum favorable moves paired with mid-single-digit worst drawdowns, which lines up with the 2.79 TradeWave Ratio and a Sharpe ratio of 1.26 for the pattern. Add it up and you get a 104% cumulative gain across the 15 iterations of this specific late‑May to midsummer window.
History does not guarantee future results; adverse excursions (MAE) can be large even in winning windows.
Why does Russell 2000 Ishares ETF (IWM) follow this seasonal pattern?
One likely driver is the way small-cap earnings updates and guidance revisions cluster in late spring and early summer, which can reset expectations after the first-quarter reporting season. Portfolio managers also tend to rebalance around midyear, shifting toward domestically focused cyclicals when growth looks stable, which often benefits small caps. This window may also capture a wave of risk-on positioning as investors look past early-year macro worries and into the back half of the calendar.
What is driving Russell 2000 Ishares ETF (IWM) today?
Russell 2000 Ishares ETF closed Thursday at 279.45, up 2.36% on the session, with roughly 26.1 million shares changing hands against a 20-day average volume of about 25.8 million.[1] The ETF sits just under its 52-week high of 287.58 and well above its 50-day moving average of 265.18, underscoring how aggressively investors have rotated into small caps in recent weeks.[1] With a one-month return of 1.23%, the latest surge has pushed IWM back into the upper end of its recent trading range and kept it comfortably above the 52-week low near 195.42.[1]
The chart below situates the latest move in its recent multi-month context and overlays the upcoming seasonal projection.
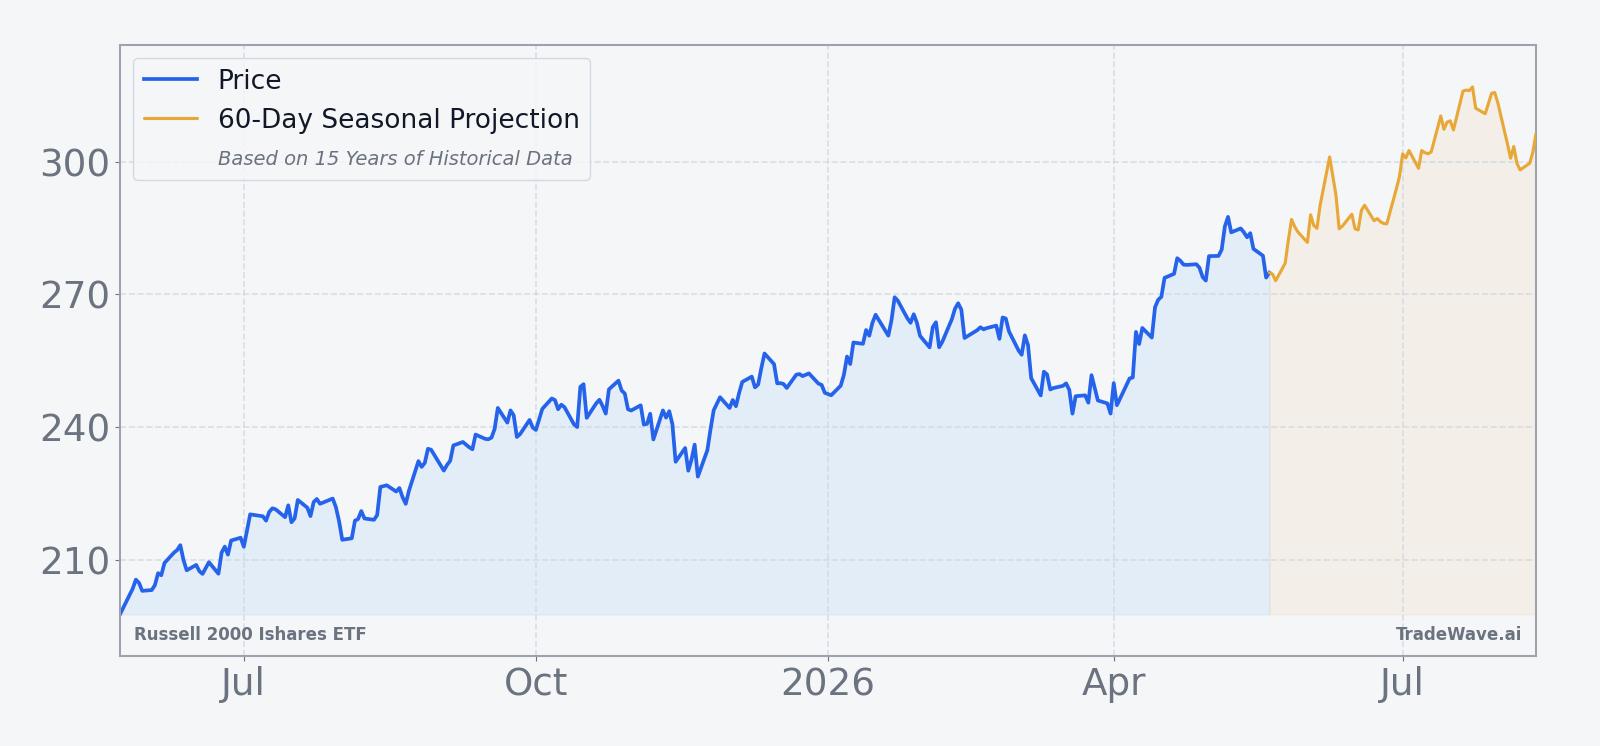
From a macro standpoint, IWM’s role as a barometer of domestic U.S. growth and risk appetite makes this setup especially notable. The ETF tracks the Russell 2000 index of small-cap stocks, which tend to be more sensitive to shifts in interest rates, credit conditions and Main Street demand than the mega-cap names that dominate the S&P 500. When investors lean into small caps, it often signals confidence that the economic backdrop can support more cyclical, domestically focused earnings.
Tracking considerations also matter for anyone watching this seasonal pattern. IWM charges a management fee typical for a broad small-cap ETF and seeks to replicate the Russell 2000 index, so its performance in the seasonal window is effectively a proxy for how U.S. small caps as a group have behaved in this slice of the calendar. Any tracking error, index reconstitution effects or liquidity shifts around quarter-end can add noise on top of the historical seasonality, especially on high-volume days.
What should traders watch as this IWM seasonal window opens?
First, watch whether IWM can sustain trade above its 50-day moving average and challenge the 52-week high near 287.58 as the window begins. A decisive break to new highs early in the period would be consistent with the historical pattern of steady gains building through the middle of the window. Conversely, a sharp pullback toward the mid-260s would echo prior years where the ETF endured a meaningful drawdown before recovering later in the stretch.
Second, monitor flows and volume in IWM relative to its 20-day average. Persistent volume above the roughly 25.8 million-share norm would suggest institutional participation in the move, which has often accompanied the stronger historical years in this window. If volume fades while price stalls near resistance, that would argue for a more cautious read on how closely this iteration might track the 15-year seasonal trend.
Finally, keep an eye on how small caps perform versus large caps as the window progresses. The historical IWM seasonal trend points to a period where small caps have often outpaced broader benchmarks, but relative strength is what confirms that behavior in real time. If IWM can hold leadership while staying within typical intraperiod drawdown ranges, it would line up with the long-biased seasonal backdrop that has delivered 14 wins out of 15.
Sources
About this seasonal analysis
Seasonal pattern data is sourced from TradeWave.ai, which analyzes historical price behavior across annual calendar windows going back up to 30 years. Read the full data methodology or the book The 100-Year Pattern by Afshin Moshrefi (2026 edition). Past performance of seasonal patterns does not guarantee future results. This article is for informational purposes only and does not constitute investment advice.