Nasdaq QQQ Invesco ETF (QQQ) Has Rallied in 15 Straight Early-Summer 40-Day Windows
Nasdaq QQQ Invesco ETF is trading just below a fresh 52-week high as it approaches a 40-day early-summer seasonal window that has delivered gains in every year of the past 15.

What is the seasonal pattern for Nasdaq QQQ Invesco ETF (QQQ)?
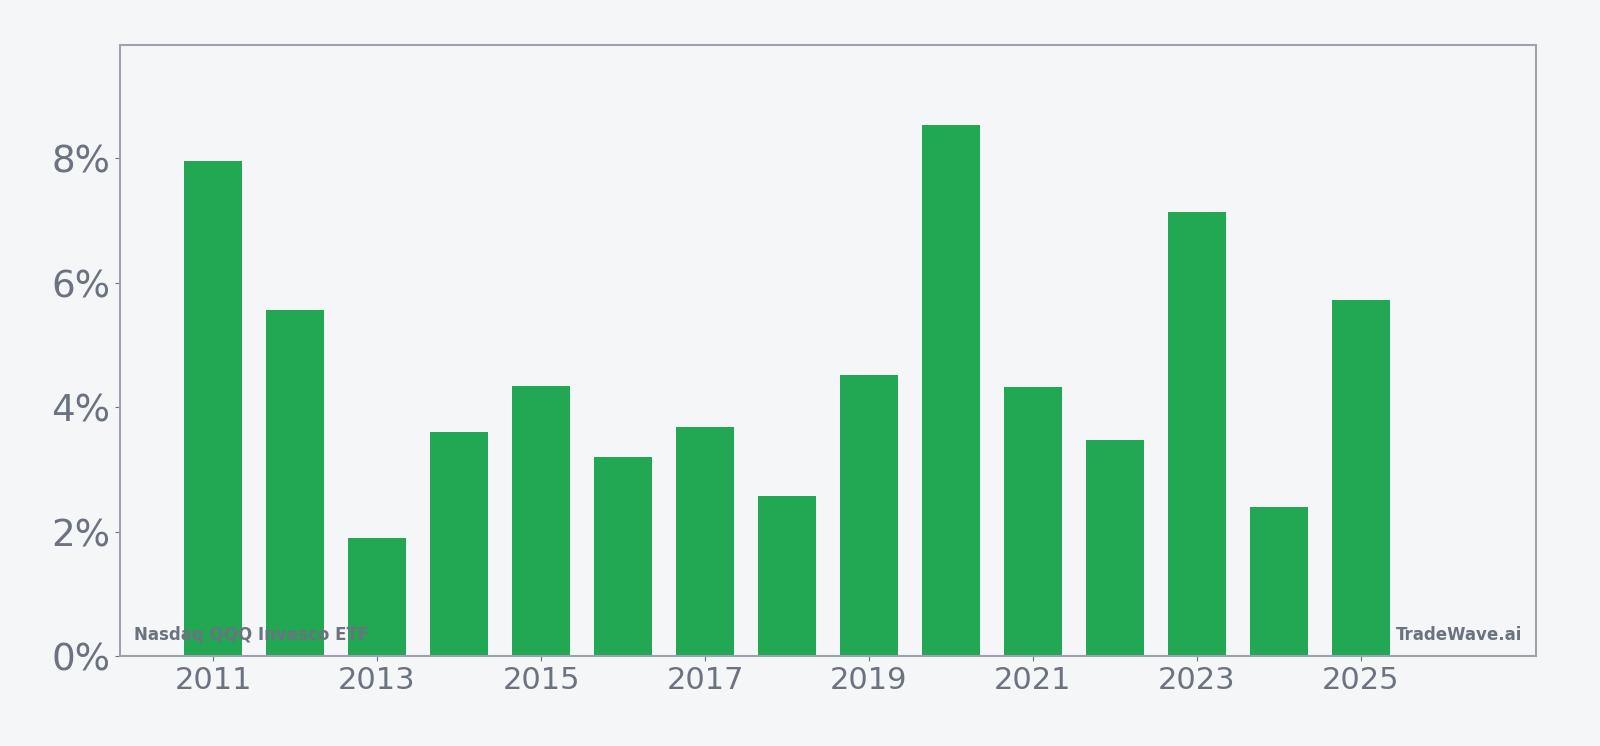
Nasdaq QQQ Invesco ETF has risen in 15 of 15 years during this early-summer 40-day window, with an average gain of 4.6% in winning years.
- 15 for 15 in this window, with Nasdaq QQQ Invesco ETF averaging 4.6% gains across all winning years.
- The pattern covers a 40-day stretch starting Jun 10, using 15 years of historical seasonality for QQQ.
- Percent Profitable is 100%, with 15 winners and 0 losers across the lookback period.
- Average gains of 4.6% in this Nasdaq QQQ Invesco ETF trading window compare with a 95% cumulative return across all 15 iterations.
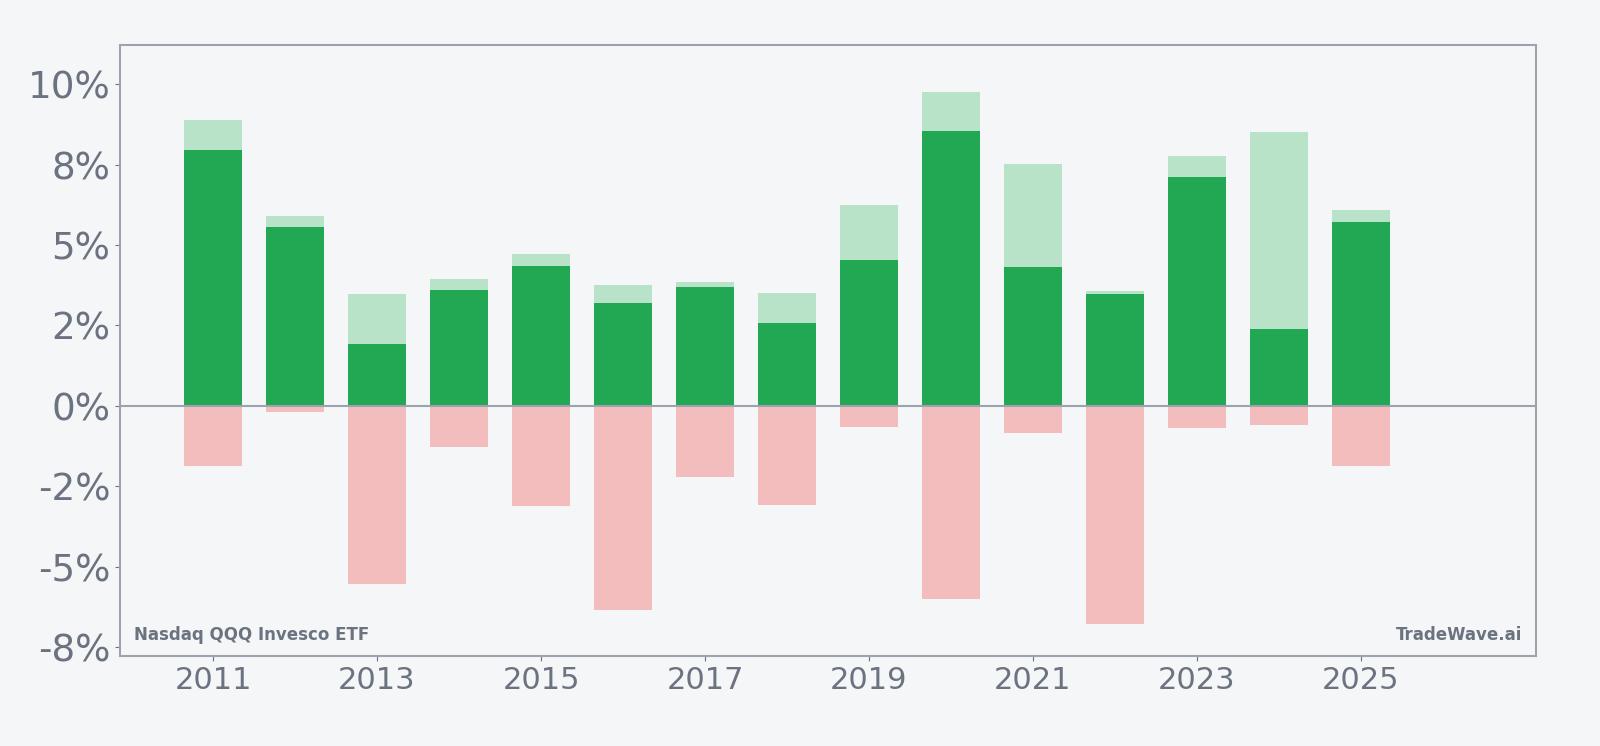
- Intraperiod swings have been meaningful, with individual years showing sizable peak run-ups and notable drawdowns before finishing higher.
- The setup aligns with a tech-heavy seasonal outlook, as QQQ’s constituents often benefit from mid-year positioning and growth sentiment.
According to historical data from TradeWave.ai, this early-summer stretch has behaved very differently from an average month on the calendar for QQQ. The next section walks through how that pattern has played out and what it could mean for traders watching the Nasdaq QQQ Invesco ETF.
How has Nasdaq QQQ Invesco ETF (QQQ) traded in this early-summer window?
Nasdaq QQQ Invesco ETF has posted gains in every one of the past 15 early-summer windows starting around Jun 10, averaging a 4.6% rise over each 40-day stretch. Today QQQ closed at 701.84, down 0.6% on the session and sitting about 1.3% below its 52-week high of 711.23, after a strong 16.39% run over the past month that leaves it extended but still within striking distance of new records.
Year-by-year net returns and intraperiod swings help show how consistently this window has favored the long side.
Trade direction for this setup is explicitly long, and the track record is unusually clean: 15 winners, 0 losers, and a 100% hit rate across the lookback. Average gains of 4.6% per window stack up to a 95% cumulative return, which means this slice of the calendar has quietly contributed a large chunk of QQQ’s long-term performance.
The strongest recent year in this pattern came in 2020, when QQQ gained 8.54% over the window after a powerful 9.76% peak run-up from the entry price, even as the worst drawdown from entry reached 5.99% during the period. At the other end of the spectrum, 2016 delivered a more modest 3.2% net gain, with a 3.76% best intraperiod rally but a deeper 6.35% pullback before the ETF finished higher.
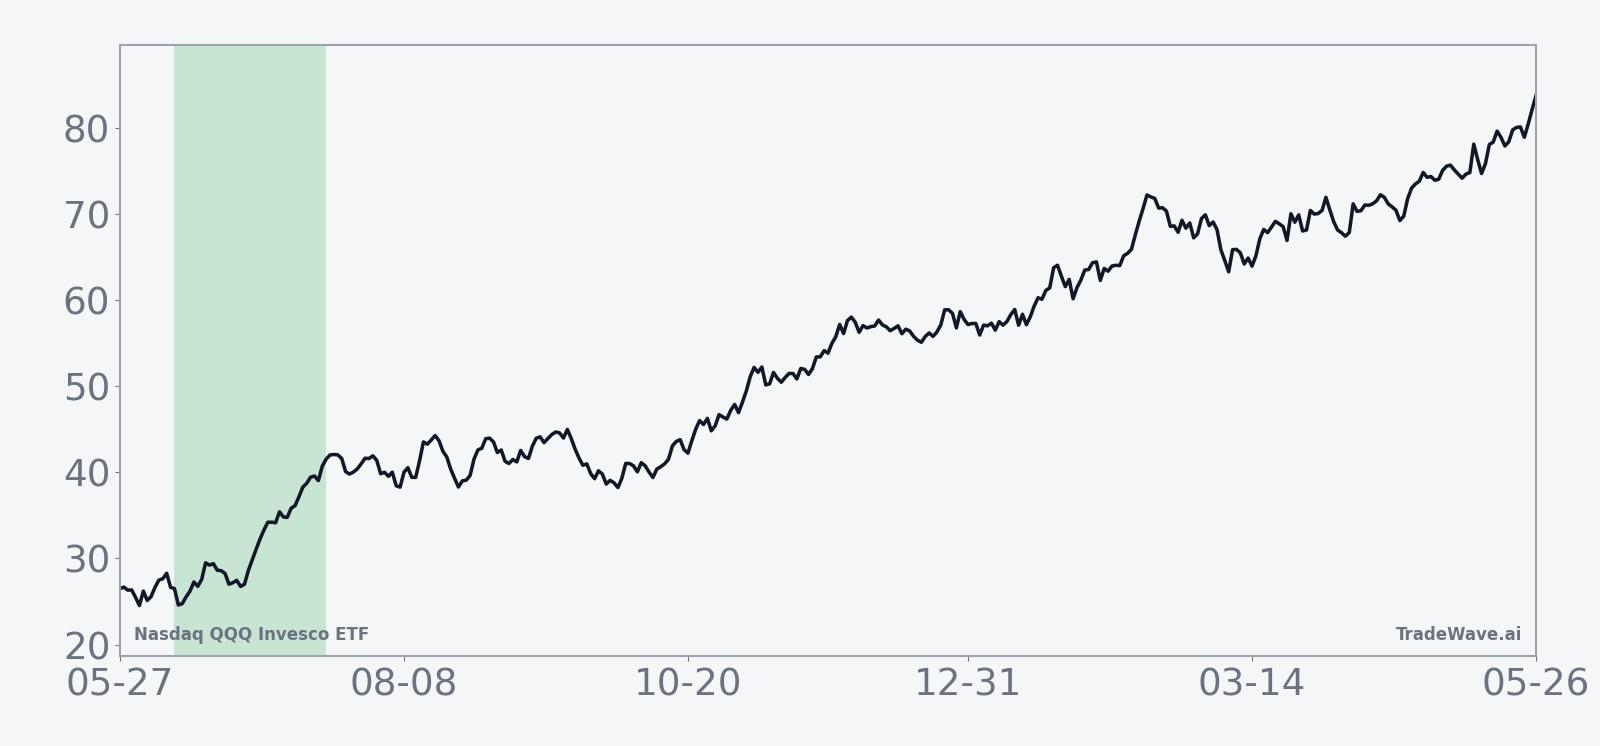
The historical average path in the trend chart shows gains tending to build steadily rather than in a single burst, with the bulk of the move often accruing in the middle of the 40-day stretch. That pattern suggests a window where dip-buying has historically been rewarded, but where patience has mattered more than catching the exact start date.
The combined net, peak favorable move and worst drawdown bars underline that this is not a low-volatility glide path. In several years, QQQ has seen sizable downside excursions inside the window before closing higher, which fits a profile where traders who sat through noise were ultimately rewarded but faced meaningful swings along the way.
History does not guarantee future results; adverse excursions (MAE) can be large even in winning windows.
Why does Nasdaq QQQ Invesco ETF (QQQ) follow this seasonal pattern?
This early-summer QQQ seasonal trend likely reflects a mix of factors, including the tech earnings calendar, mid-year index rebalancing and institutional portfolio repositioning. Growth-heavy portfolios often get reset after first-half results, which can channel fresh flows into large-cap tech and the Nasdaq complex. Options expiration cycles and systematic strategies tied to volatility and momentum may also amplify moves during this period, reinforcing a pattern that has repeated across multiple market regimes.
What is driving Nasdaq QQQ Invesco ETF (QQQ) today?
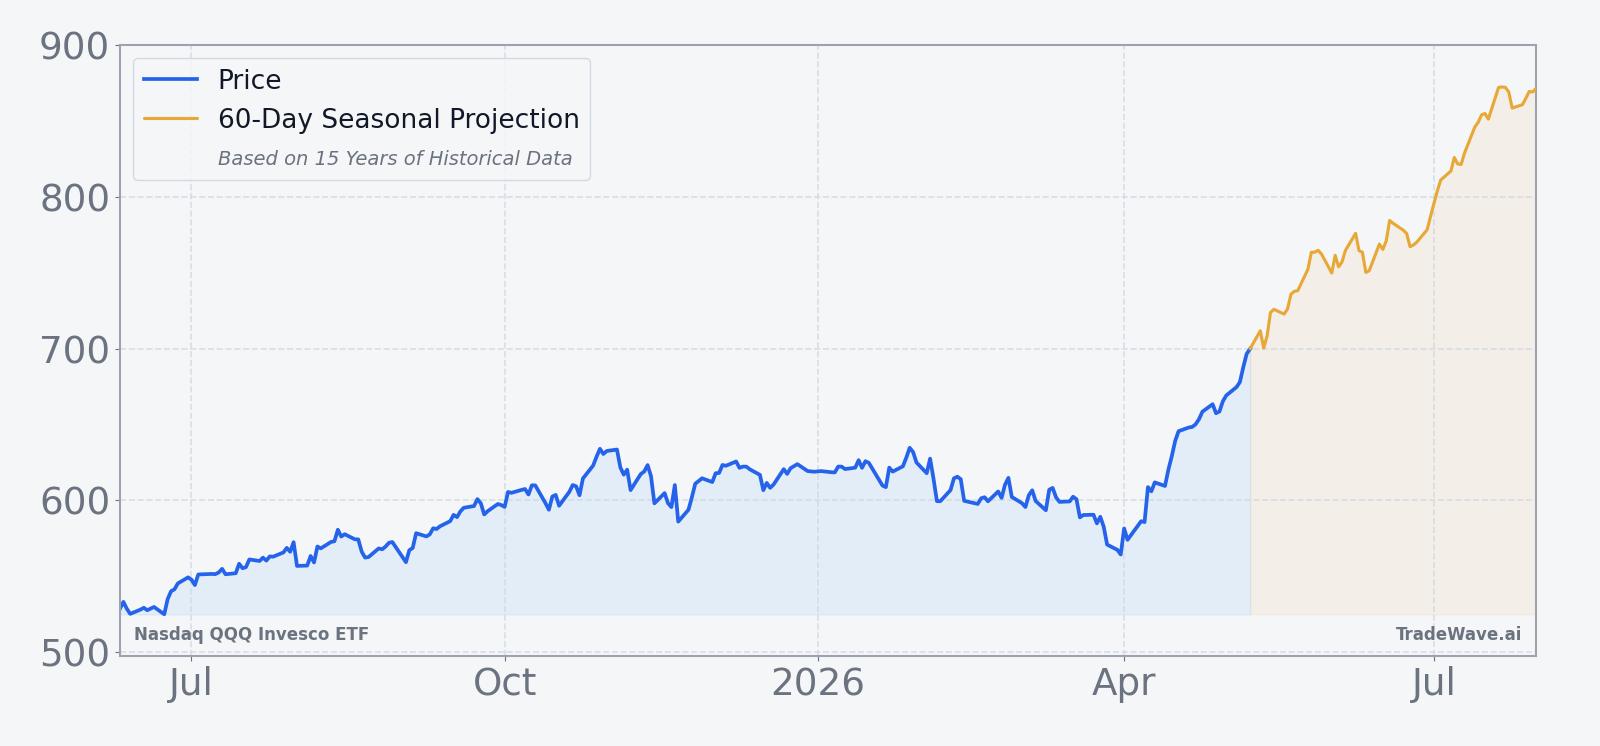
Nasdaq QQQ Invesco ETF slipped 0.6% on May 20 to close at 701.84, easing from an intraday high of 706.49 as traders locked in part of a sharp 16.39% one-month rally. The ETF is trading just below its 52-week peak of 711.23 and well above its 50-day moving average of 620.43, with 20-day average volume near 39.5 million shares pointing to still-robust activity in the tech-heavy benchmark.
The chart below situates the latest move in its recent multi-month context, alongside a 60-day seasonal projection.
Sources
About this seasonal analysis
Seasonal pattern data is sourced from TradeWave.ai, which analyzes historical price behavior across annual calendar windows going back up to 30 years. Read the full data methodology or the book The 100-Year Pattern by Afshin Moshrefi (2026 edition). Past performance of seasonal patterns does not guarantee future results. This article is for informational purposes only and does not constitute investment advice.