10-for-10 Late-May Slide: Trust VIX Short-Term Futures ETF (VIXY) Enters Weak 16-Day Stretch
Trust VIX Short-Term Futures ETF is trading just above its 52-week low as it approaches a short-volatility seasonal window that has quietly delivered for a decade.

What is the seasonal pattern for Trust VIX Short-Term Futures ETF (VIXY)?
Trust VIX Short-Term Futures ETF has fallen in 10 of 10 years during this late-May 16-day window, with an average gain of 10.27% for short positions in winning years.
- 10 for 10 in this window, with short positions averaging 10.27% gains across the past decade.
- The 16-day Trust VIX Short-Term Futures ETF trading window begins May 23 and has historically favored downside in VIXY.
- Percent Profitable is 100%, with 10 winners and 0 losers for the short-volatility setup in this slice of the calendar.
- Median profit for the pattern is 12.48%, pointing to a consistently meaningful move rather than a one-off outlier.
- A TradeWave Ratio of 2.01 signals that price has typically traveled far in the trade direction within the window, even before the final close.
- Intraperiod swings have been sizable, with years like 2023 showing deep adverse moves before ultimately resolving lower for VIXY.
According to historical data from TradeWave.ai, this upcoming stretch has behaved very differently from an average month on the volatility calendar. TradeWave.ai’s seasonal database flags the late-May window as one of the most consistently bearish periods of the year for VIXY.
How has Trust VIX Short-Term Futures ETF (VIXY) traded in this late-May window?
Trust VIX Short-Term Futures ETF has dropped in every single iteration of this late-May 16-day window over the past 10 years, with short positions averaging a 10.27% gain. The next window begins on May 23, with VIXY last changing hands at 26.46, about 54.4% below its 52-week high of 57.99 and only roughly 6.7% above its 52-week low of 24.81.[1] For traders who traffic in volatility seasonality, that combination of a depressed starting point and a spotless short-side record is hard to ignore.
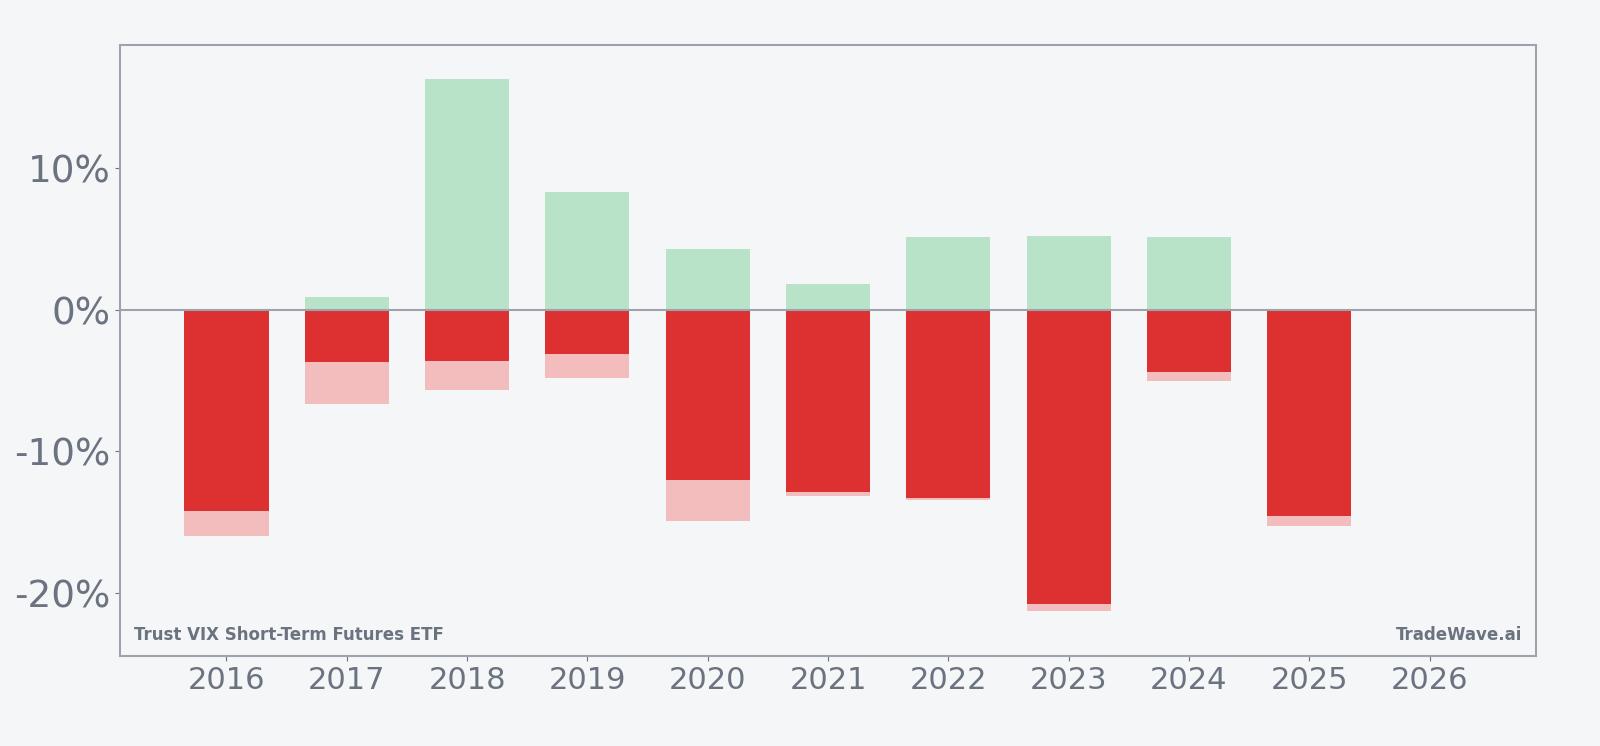
A combined view of net returns with peak favorable and adverse moves shows how far VIXY has tended to swing inside this window.
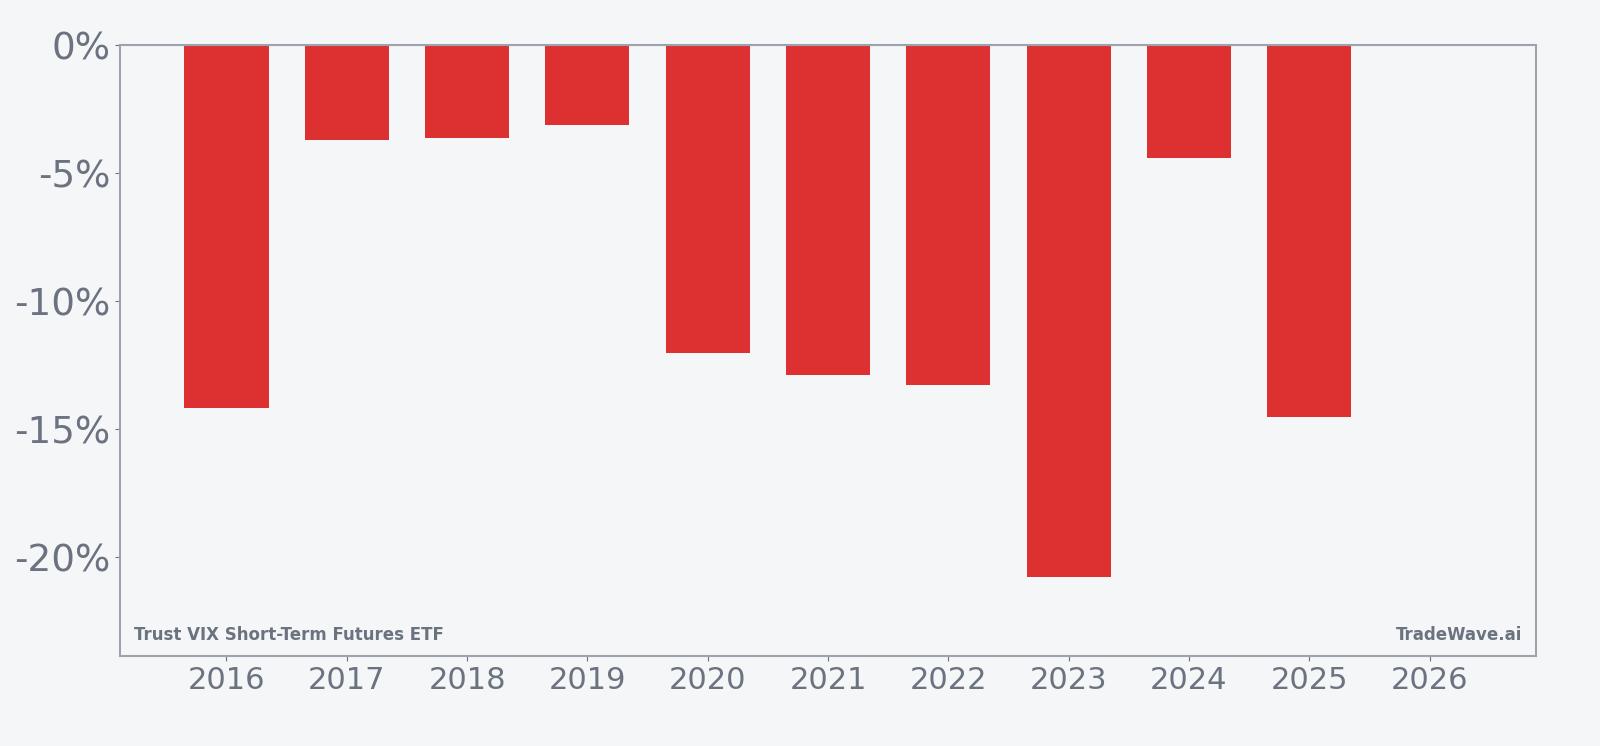
Across the 10-year sample, every single year has delivered a negative net return for VIXY in this window, which is positive for the short trade direction. The weakest year for shorts was 2017, with VIXY down 3.71%, while the strongest was 2023, when the ETF fell 20.77% over the 16 days. Average profit of 10.27% and a median of 12.48% show that the typical outcome has been a double-digit move lower in the ETF rather than a marginal drift.
The intraperiod swings have been anything but gentle. In 2023, for example, the best move in favor of the short trade reached 5.19%, while the worst drawdown from entry hit 21.31% before the pattern finished with VIXY down 20.77%. In 2016 and 2025, the maximum adverse excursions of 16.01% and 15.28% came alongside net drops of 14.2% and 14.55% respectively, showing that even the strongest years for the pattern have forced traders to sit through sizable countertrend spikes.
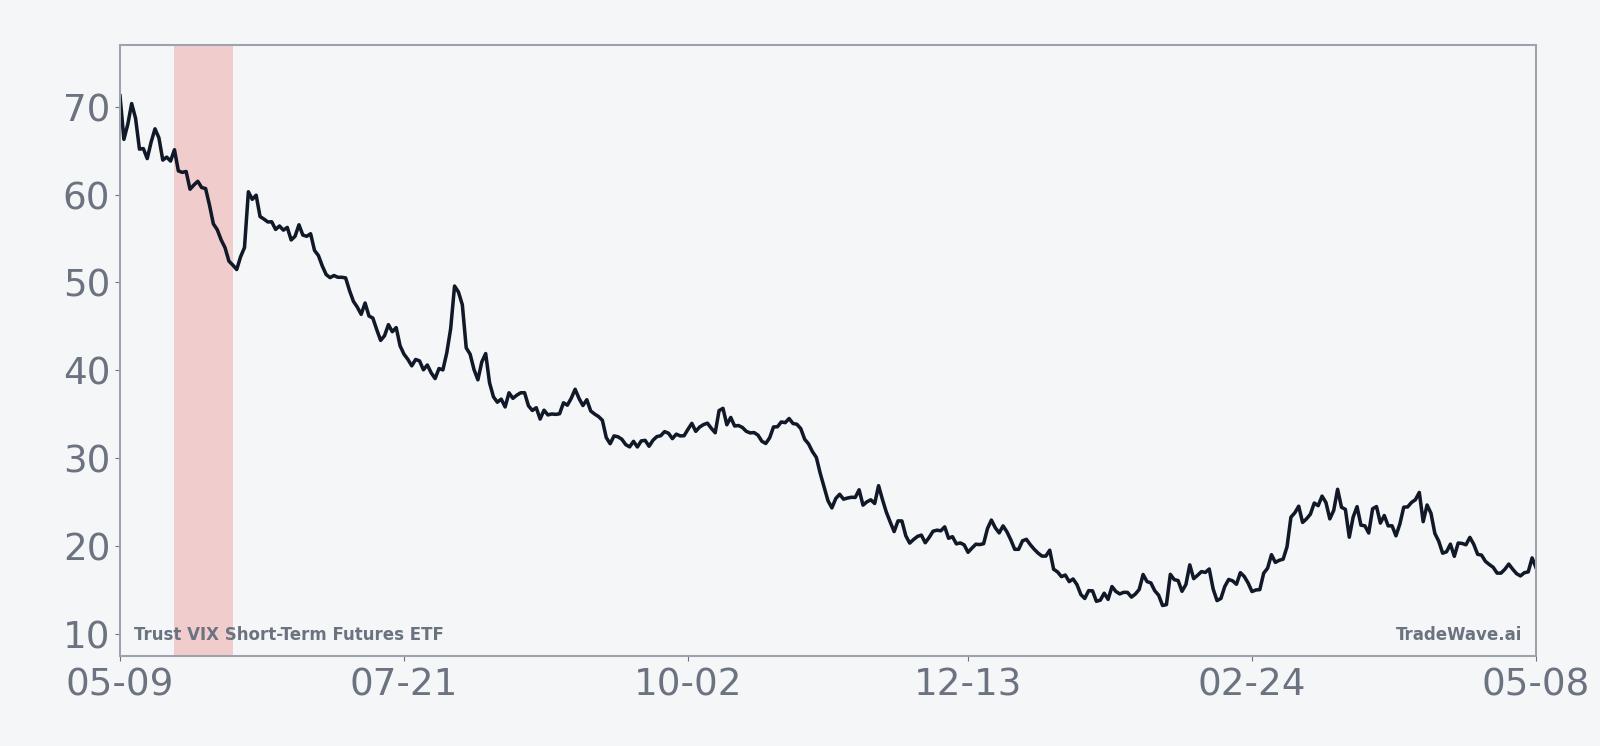
The seasonal trend chart shows that, on average, the bulk of the downside in VIXY has tended to accrue in the middle of the 16-day window rather than right at the start. Early days often feature choppy action or even small upticks in the ETF before the typical slide takes hold. The cumulative return profile climbs steadily for the short side across the window, with no single year in the sample flipping the sign of the overall pattern.
The TradeWave Ratio of 2.01 underlines how active this stretch has been for volatility traders. That figure means VIXY has typically traveled meaningfully in the trade direction within the window, independent of where it ultimately closed. Combined with a Sharpe ratio of 1.66 based on end-of-window outcomes, the pattern has historically offered both strong directional bias and a favorable risk-adjusted profile for short exposure.
History does not guarantee future results; even in a 10-for-10 window, adverse excursions have been large, and traders can face sharp drawdowns before the pattern resolves.
Why does Trust VIX Short-Term Futures ETF (VIXY) follow this seasonal pattern?
One likely driver is the way equity markets and volatility futures often behave around the late-May and early-June period, when post-earnings calm and index rebalancing can suppress implied volatility. Trust VIX Short-Term Futures ETF holds short-term VIX futures, so a steady grind higher in equities and tighter credit spreads can translate into decaying VIX futures prices and pressure on VIXY. This late-spring volatility seasonal outlook may also reflect positioning around options expiration and systematic volatility-selling strategies that tend to reload after earlier-year macro events.
What is driving Trust VIX Short-Term Futures ETF (VIXY) today?
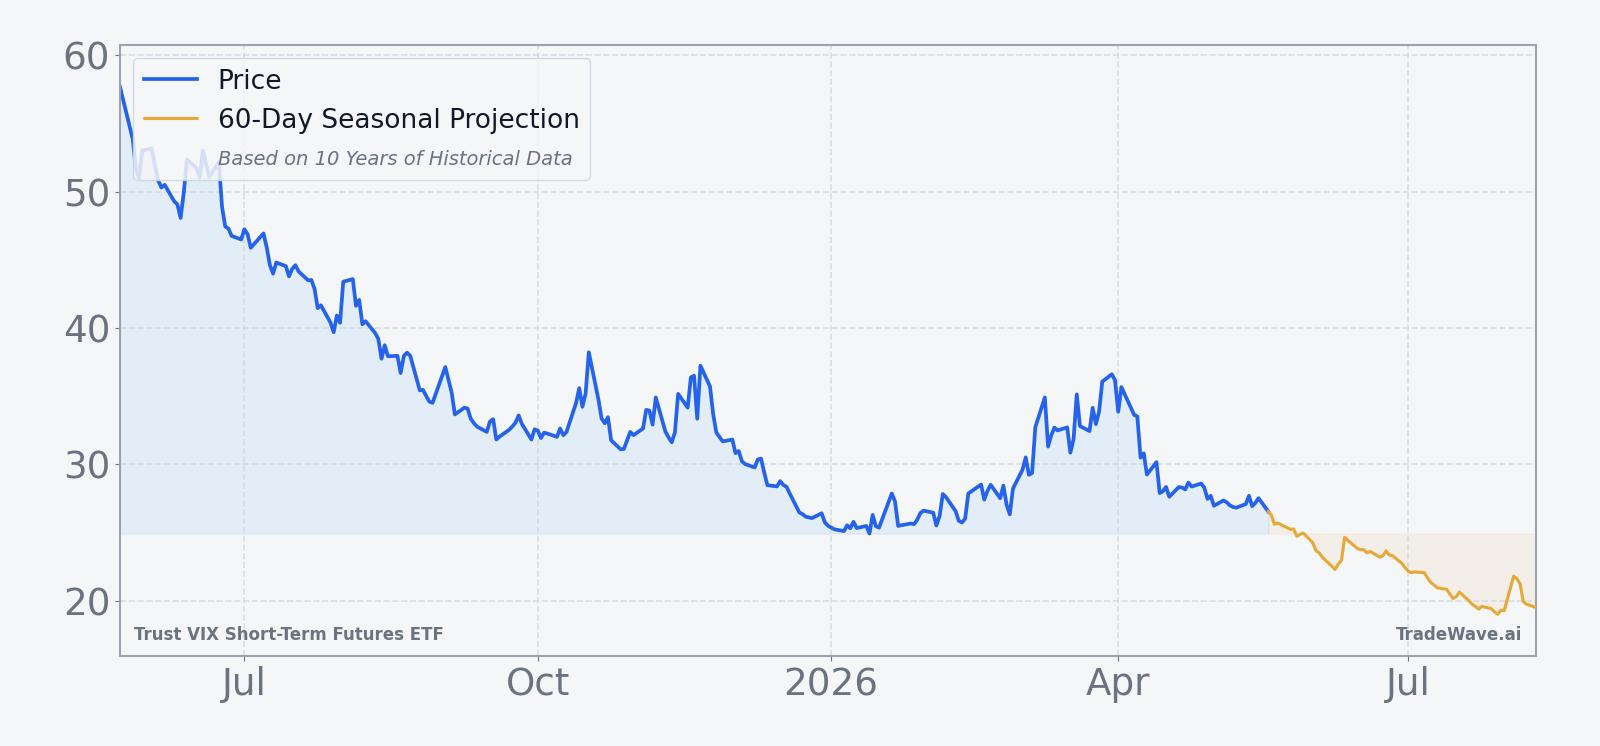
VIXY slipped 1.75% in the latest session to close at 26.46, extending a one-month decline of 7.36% and leaving the ETF about 54.4% below its 52-week high of 57.99 and roughly 6.7% above its 52-week low of 24.81.[1] Trading volume of about 3.95 million shares ran modestly above the 20-day average of roughly 3.16 million, suggesting investors are still using the product actively as a hedge and trading vehicle even as realized volatility has cooled.[1] With the 50-day moving average up at 30.30, VIXY remains in a clear downtrend, consistent with a market backdrop where equity indices have generally been firm and demand for near-term protection has faded.[1]
The chart below situates the latest move in its recent multi-month context and overlays a 60-day seasonal projection.
What should traders watch in this VIXY seasonal window?
For volatility traders, the key question is whether this 10-for-10 late-May pattern can extend its streak from a starting point so close to the 52-week low. The historical VIXY seasonal trend suggests that if the pattern is going to repeat, the ETF often chops early in the window before sliding more decisively in the middle days. A firm equity tape, contained credit spreads, and muted macro surprises would all line up with that historical script.
On the other hand, any sudden shock that drives a spike in spot VIX or front-month VIX futures could quickly overwhelm the seasonal tendency. Watch how VIXY behaves around the 24.81 low on the downside and the 30 area near the 50-day moving average on the upside.[1] A clean break below the prior low during the window would be consistent with the decade-long short-volatility pattern. A sustained move back above the 50-day line would be an early sign that this year may diverge from the historical playbook.
Flows and usage also matter. While detailed ETF flow data is not available in this dataset, traders can monitor daily volume relative to the 20-day average and the behavior of related volatility products to gauge whether hedging demand is building or fading. If volume spikes higher while VIXY fails to rally meaningfully, that would echo prior years where attempts to bid up protection were ultimately swamped by continued volatility decay.
Add it up: VIXY is heading into a 16-day window that has rewarded short exposure every year for a decade, from a starting point already deep in its 52-week range. The pattern is strong, but the product is volatile, and the next move will depend on whether late-spring calm in equities holds or gives way to a surprise volatility shock.
Sources
About this seasonal analysis
Seasonal pattern data is sourced from TradeWave.ai, which analyzes historical price behavior across annual calendar windows going back up to 30 years. Read the full data methodology or the book The 100-Year Pattern by Afshin Moshrefi (2026 edition). Past performance of seasonal patterns does not guarantee future results. This article is for informational purposes only and does not constitute investment advice.