Nasdaq QQQ Invesco ETF (QQQ) Heads Into 40-Day Window With 15-for-15 Early-Summer Win Streak
Nasdaq QQQ Invesco ETF is trading near record highs as it heads toward a 40-day early-summer window that has delivered gains in every year of the past decade and a half, putting a powerful historical seasonal pattern in focus for tech-heavy exposure.

What is the seasonal pattern for Nasdaq QQQ Invesco ETF (QQQ)?
Nasdaq QQQ Invesco ETF has risen in 15 of 15 years during this early-summer 40-day window, with an average gain of 4.6% in winning years.
- 15 for 15 in this window, averaging 4.6% gains in winning years across the past 15 cycles.
- The upcoming 40-day Nasdaq QQQ Invesco ETF trading window starts Jun 10, 2026 and has historically shown a strong bullish seasonal trend.
- Percent Profitable is 100%, with 15 winners and 0 losers in the historical sample.
- Average profit of 4.6% in this window compares with a cumulative return of 95% across all 15 years.
- The TradeWave Ratio (TWR) of 2.46 suggests price has typically traveled meaningfully in the long direction within the window, even before final closes.
- A Sharpe ratio of 2.07 points to historically favorable risk-adjusted returns for this specific Nasdaq QQQ Invesco ETF seasonal pattern.
According to historical data from TradeWave.ai, this early-summer stretch has behaved very differently from an average month on the calendar for QQQ, and the next iteration is now less than a month away.
How has Nasdaq QQQ Invesco ETF (QQQ) traded in this early-summer window?
Nasdaq QQQ Invesco ETF has booked gains in all 15 years of this 40-day early-summer window, averaging a 4.6% rise per cycle. The next run of this pattern begins on Jun 10, 2026, with QQQ last changing hands at 710.15, up 2.2% on the day and sitting about 0.2% below its 52-week high of 711.23.[1] That combination of a clean historical win streak and prices hovering near record territory makes this slice of the calendar hard for growth-focused traders to ignore.
Trade direction for this setup is explicitly long, and the track record is unusually clean. Across the 15-year sample, Percent Profitable is 100%, with 15 winners and 0 losers, and cumulative gains across those windows add up to 95%. Average profit of 4.6% per window lines up closely with the 4.33% median, which suggests the pattern has not been skewed by a single outlier year.
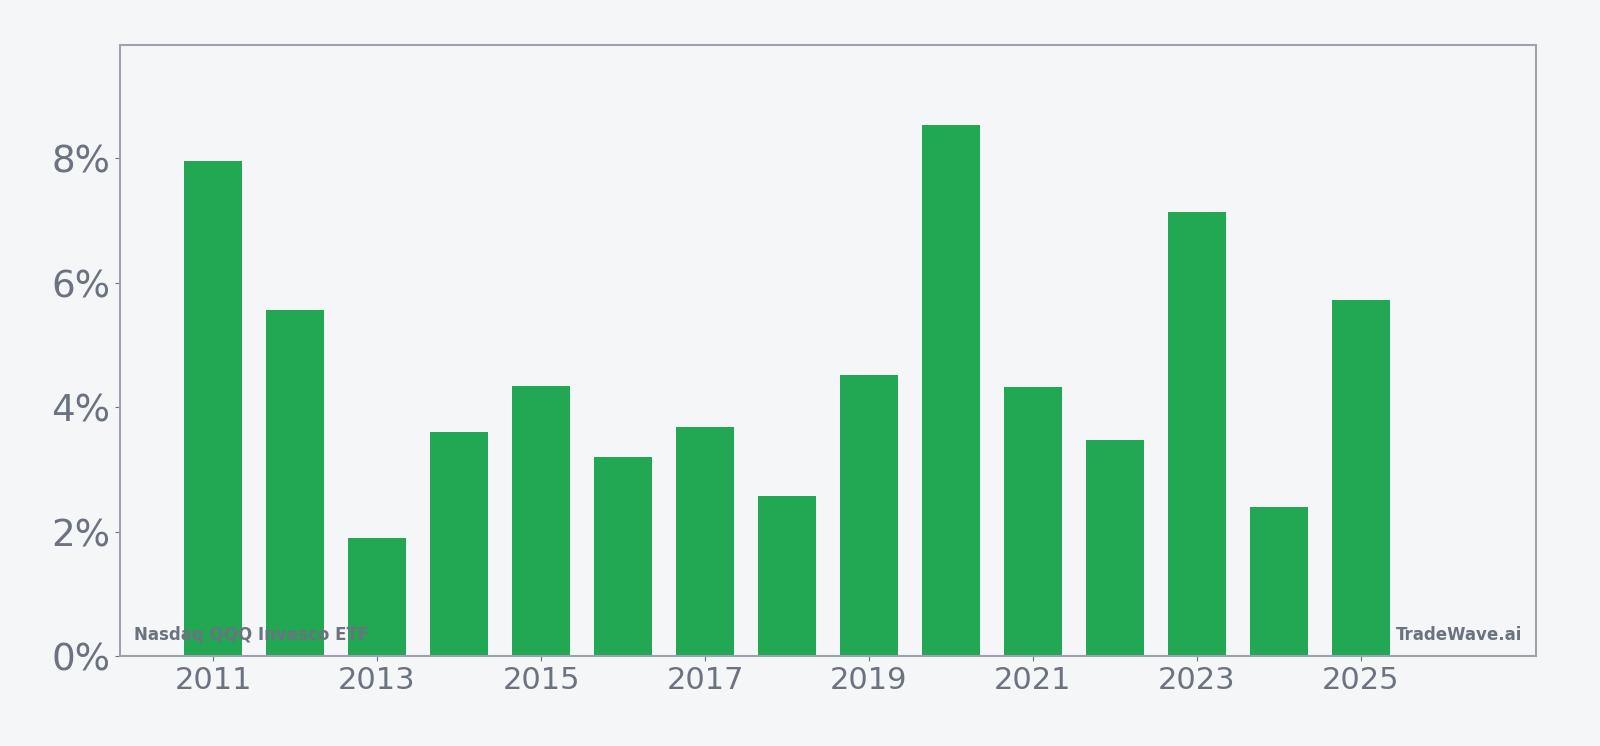
The per-year table shows how that plays out in individual cycles. The strongest recent year was 2020, when QQQ gained 8.54% in the window, with a maximum favorable move of 9.76% from entry before giving back a small portion into the close. At the other end of the spectrum, 2016 still finished higher by 3.2%, but it carried a maximum adverse move of -6.35% at one point, reminding traders that even “all green” windows can involve sharp drawdowns along the way.
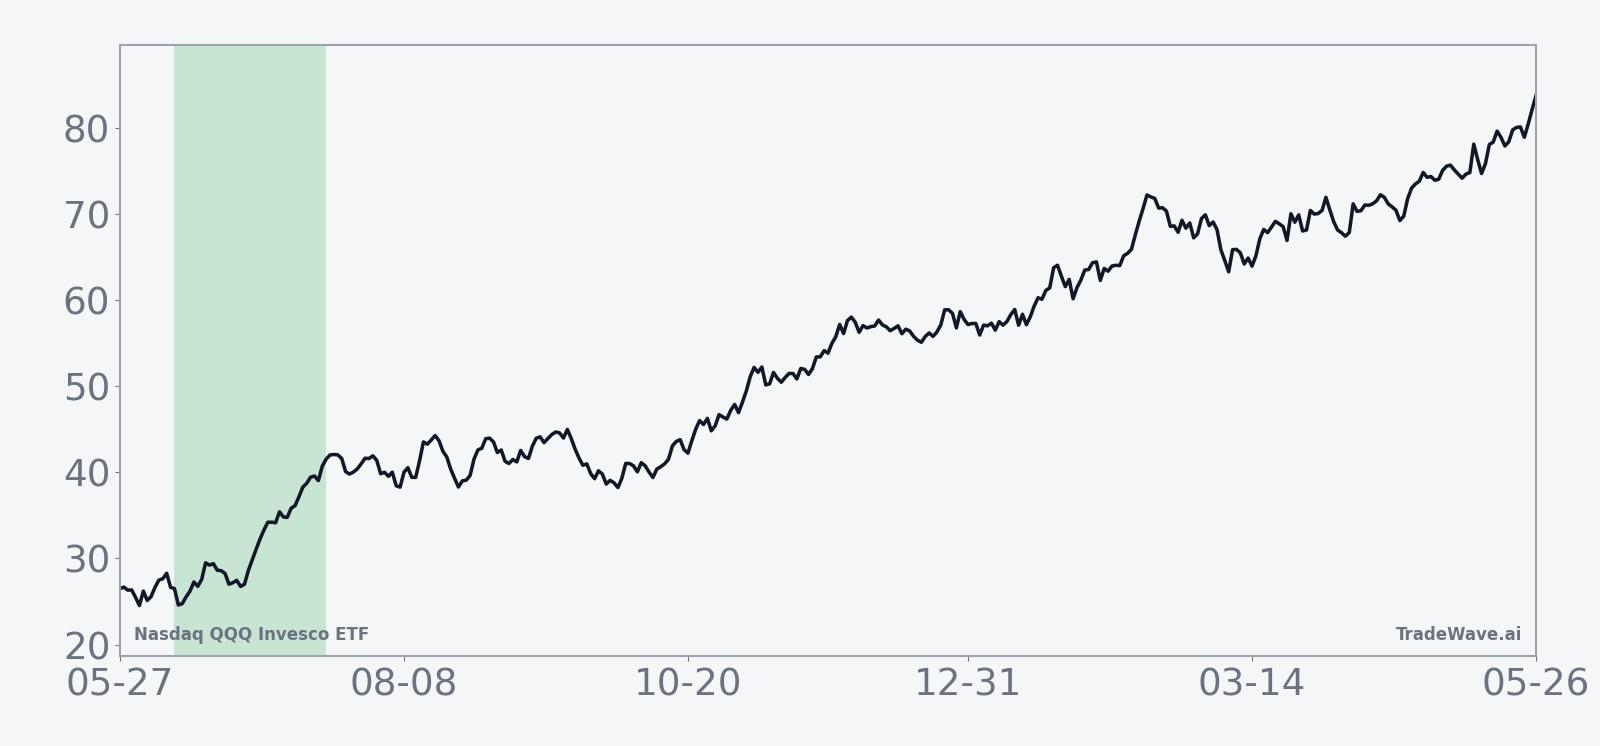
The historical seasonal average shows QQQ typically grinding higher through most of the 40-day span, with gains tending to build rather than spike in a single burst. The curve is not perfectly smooth, but the bias is clearly upward, with only modest soft patches in the middle of the window before strength reasserts into the later days.
Yearly net and peak moves highlight how upside and downside swings have coexisted inside this otherwise consistent pattern.
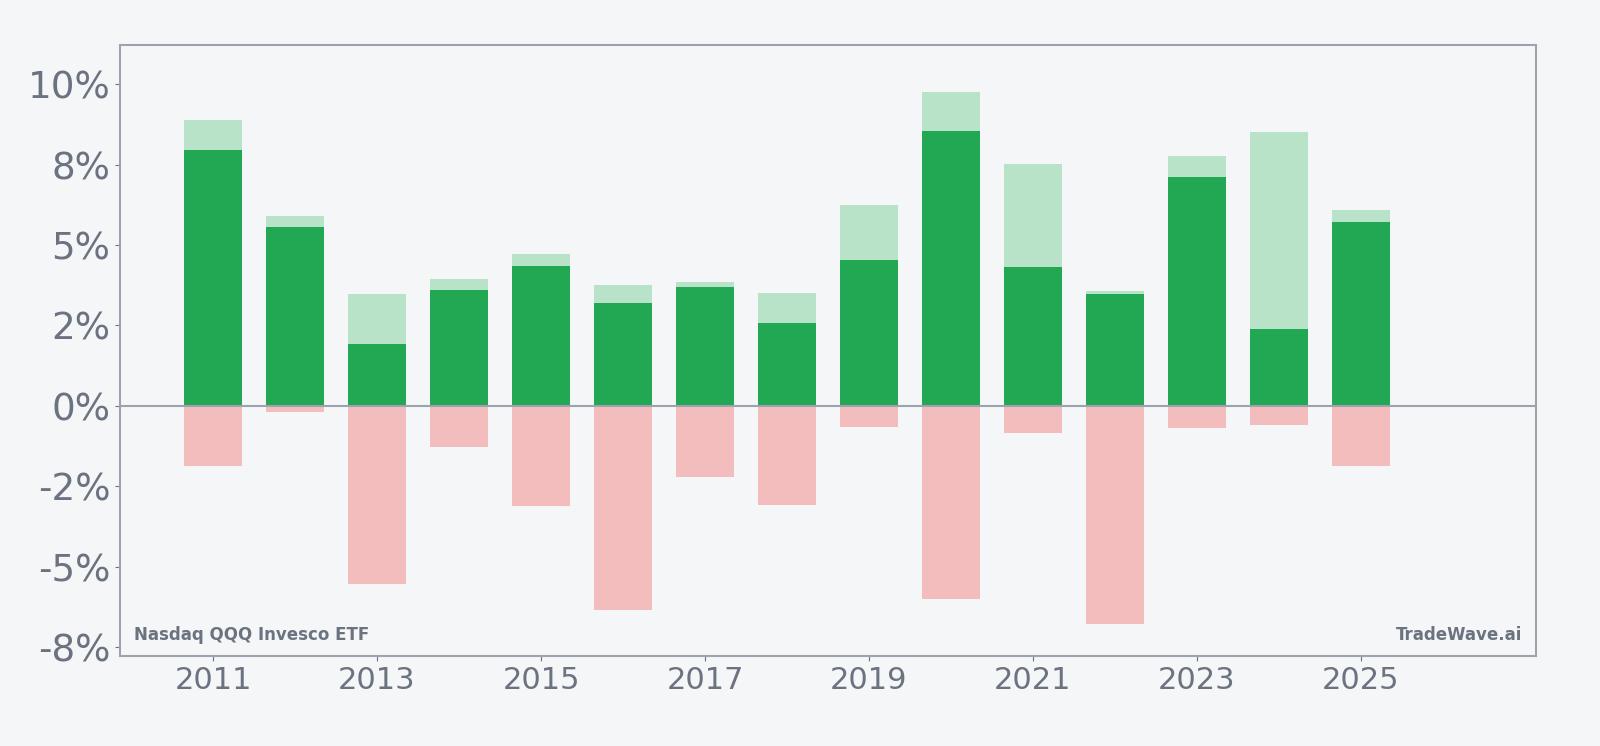
The combined net, maximum favorable excursion and maximum adverse excursion view shows why this window has mattered for active traders. In strong years like 2019, 2020 and 2023, QQQ not only finished higher but also saw peak run-ups between roughly 6% and nearly 10% from entry, while adverse moves stayed relatively contained. In more volatile years such as 2016 and 2022, the ETF still closed the window in the green, yet intraperiod drawdowns of around -6% appeared before the eventual recovery, underscoring that the path to those gains has not always been smooth.
History does not guarantee future results; adverse excursions (MAE) can be large even in winning windows.
Why does Nasdaq QQQ Invesco ETF (QQQ) follow this seasonal pattern?
This early-summer QQQ seasonal pattern may reflect a mix of earnings-calendar follow-through, institutional portfolio rebalancing and options positioning around midyear. Many of the ETF’s largest tech and growth holdings report in late spring, and positive revisions can fuel continued buying into June and July. At the same time, managers often adjust risk budgets and sector weights around midyear, which can favor high-growth benchmarks when macro conditions are stable or improving.
What is driving Nasdaq QQQ Invesco ETF (QQQ) today?
QQQ closed at 710.15 on May 11, up 2.2% on the session, with roughly 35.6 million shares changing hands, a bit below its 20-day average volume of about 39.5 million.[1] The ETF is trading in a strong uptrend, sitting just about 0.2% under its 52-week high of 711.23 and well above its 50-day moving average near 620.43, which leaves it more than 48% above the 52-week low around 479.52.[1] That backdrop means the upcoming early-summer seasonal window will open with QQQ already extended, a very different setup from years when the pattern began after a pullback.
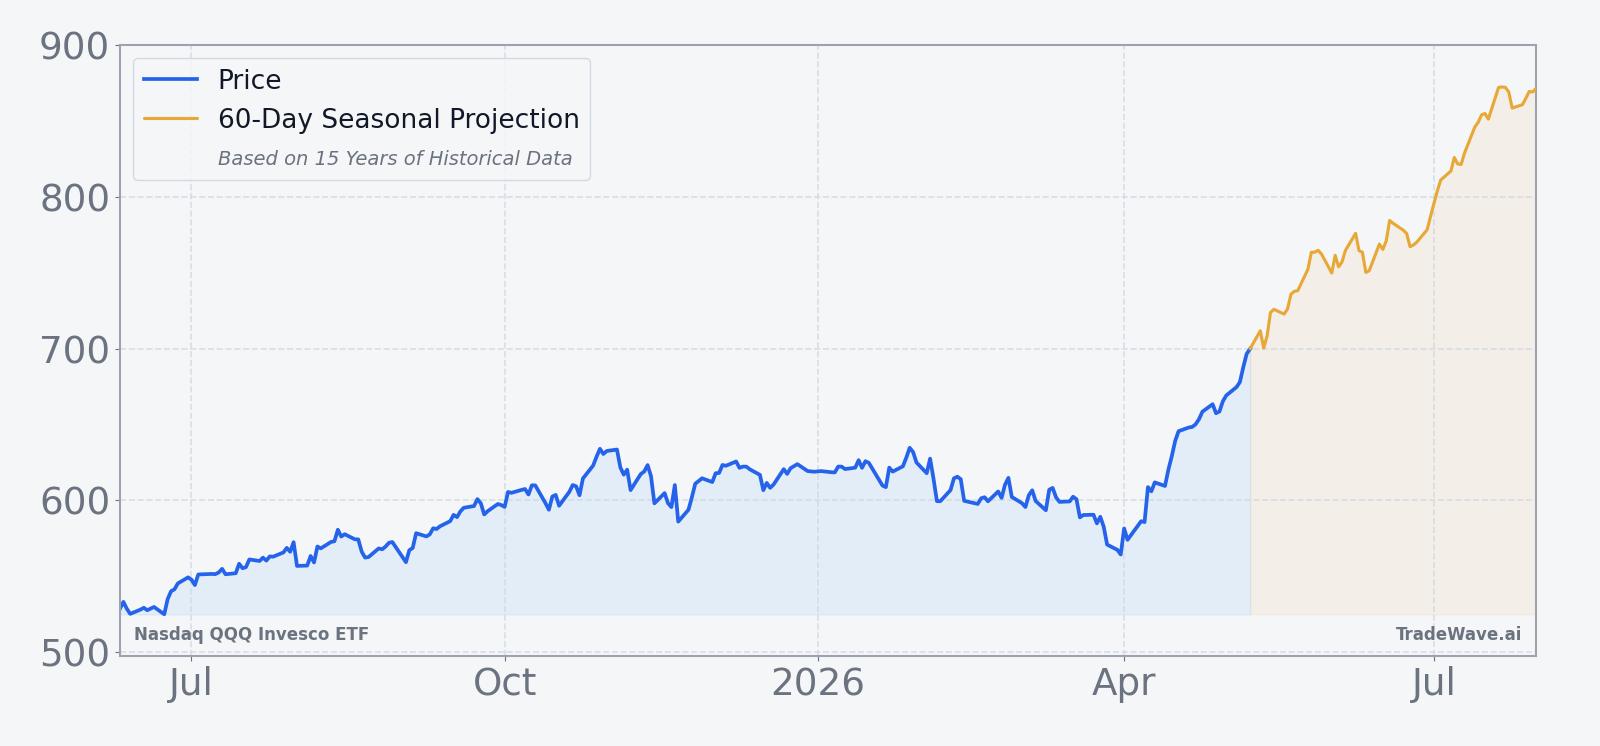
Macro drivers around QQQ remain familiar: investors are still weighing the path of Federal Reserve rate cuts and the impact of global trade tensions on mega-cap tech earnings and valuations.[2] In Oct 2025, a period of heightened volatility in QQQ was tied to shifting expectations around Fed policy and renewed US-China trade headlines, with technicians flagging key support levels as the ETF briefly came under pressure.[2] Those episodes serve as a reminder that even in historically strong seasonal windows, macro shocks can dominate short-term price action.
The chart below situates the latest move in its recent multi-month context, alongside a 60-day seasonal projection path.
How does QQQ’s exposure shape this seasonal outlook?
Nasdaq QQQ Invesco ETF tracks the Nasdaq-100 Index, giving investors concentrated exposure to large-cap US growth stocks with a heavy tilt toward technology, communication services and consumer discretionary names.[2] That concentration means the ETF’s seasonal behavior is effectively a proxy for how mega-cap tech and related sectors have traded around midyear over the past decade and a half. When the pattern has worked best, it has often coincided with strong demand for cloud, AI, e-commerce and digital advertising themes that dominate the benchmark.
Tracking considerations also matter for traders leaning on this historical seasonality. QQQ is a long-established, highly liquid ETF with tight bid-ask spreads and deep options markets, which makes it a popular vehicle for both directional bets and hedging. Expense ratios and tracking error versus the Nasdaq-100 have historically been modest, so most of the seasonal behavior seen in the index has tended to show up in the ETF as well, rather than being eaten away by structural frictions.
What should traders watch as this QQQ seasonal window approaches?
With QQQ already near all-time highs, the key question for this year’s early-summer window is whether the ETF can extend its 15-for-15 streak without a deeper reset first. On the upside, traders will be watching whether price can hold above the recent breakout zone and continue to respect the rising 50-day moving average, which currently sits far below spot and underscores how strong the trend has been.[1] On the downside, any swift move back toward that moving average or toward prior support levels would signal that macro or positioning shocks are starting to overpower the historical seasonal tailwind.
Macro-wise, the same themes that rattled QQQ in Oct 2025 remain in play: the timing and pace of Fed rate cuts, and the tone of global trade negotiations.[2] If incoming data or policy commentary revives fears of slower growth or renewed tariff pressure on key tech supply chains, volatility could spike even inside a historically bullish window. Conversely, a benign macro tape with steady progress on inflation and trade could allow the seasonal pattern to play out more cleanly.
Flows and benchmark behavior will also be important tells. Persistent inflows into QQQ and the broader Nasdaq-100 complex would suggest that institutional and retail investors are still adding risk into strength, which has often aligned with the better historical years in this window. If flows stall or reverse while the index grinds sideways, it would hint that the market is using the early-summer stretch to rebalance away from crowded growth exposure rather than chase it.
In practical terms, traders watching this QQQ seasonal trend will be focused on three things as Jun 10 approaches: whether price can stay near or above current highs into the start of the window, how volatility behaves around key macro events, and whether any pullbacks resemble the -6% style drawdowns seen in past winning years or something more severe. History says this has been one of the more reliable bullish stretches on the QQQ calendar. The next few weeks will show whether a richly valued, macro-sensitive tech tape can keep that record intact.
Sources
About this seasonal analysis
Seasonal pattern data is sourced from TradeWave.ai, which analyzes historical price behavior across annual calendar windows going back up to 30 years. Read the full data methodology or the book The 100-Year Pattern by Afshin Moshrefi (2026 edition). Past performance of seasonal patterns does not guarantee future results. This article is for informational purposes only and does not constitute investment advice.