Near 52-Week Lows, Trust VIX Short-Term Futures ETF (VIXY) Enters Historically Weak 28-Day Stretch
Trust VIX Short-Term Futures ETF is sitting just above its 52-week low as a 28-day volatility-linked seasonal window opens that has historically rewarded short exposure.

What is the seasonal pattern for Trust VIX Short-Term Futures ETF (VIXY)?
Trust VIX Short-Term Futures ETF has fallen in 10 of 10 years during this 28-day May window on a short-bias basis, with an average gain of 13.05% in winning years for traders positioned short.
- 10 for 10 in this window on a short setup, with an average 13.05% profit in winning years over the past decade.
- Seasonal window starts May 8 and runs 28 trading days, targeting a short trade direction in VIXY.
- Percent Profitable is 100%, with 10 winners and 0 losers across the 10-year lookback.
- Median profit of 13.18% and cumulative return of 236% highlight how consistently VIXY has trended lower in this slice of the calendar.
- TradeWave Ratio of 3.14 signals that intraperiod moves in the trade direction have typically been sizable relative to the setup.
- Sharpe ratio of 2.16 for this pattern points to unusually strong risk-adjusted performance for a short-bias volatility trade.
According to historical data from TradeWave.ai, this specific late-spring stretch has behaved very differently from an average month for VIXY, and the next 28 days sit inside one of its most one-sided seasonal patterns.
How has Trust VIX Short-Term Futures ETF (VIXY) traded in this 28-day May window?
Trust VIX Short-Term Futures ETF has delivered a winning short trade in this 28-day window in every one of the past 10 years, with average profits of 13.05% for traders positioned against the ETF. The new iteration of that window begins today with VIXY at 26.92, down 0.6% on the session and sitting about 59.8% below its 52-week high of 66.93 while hovering just 8.5% above its 52-week low of 24.81. For a product tied to short-term VIX futures, that combination of a depressed spot level and a historically bearish seasonal trend for the ETF itself is a notable backdrop for volatility traders.
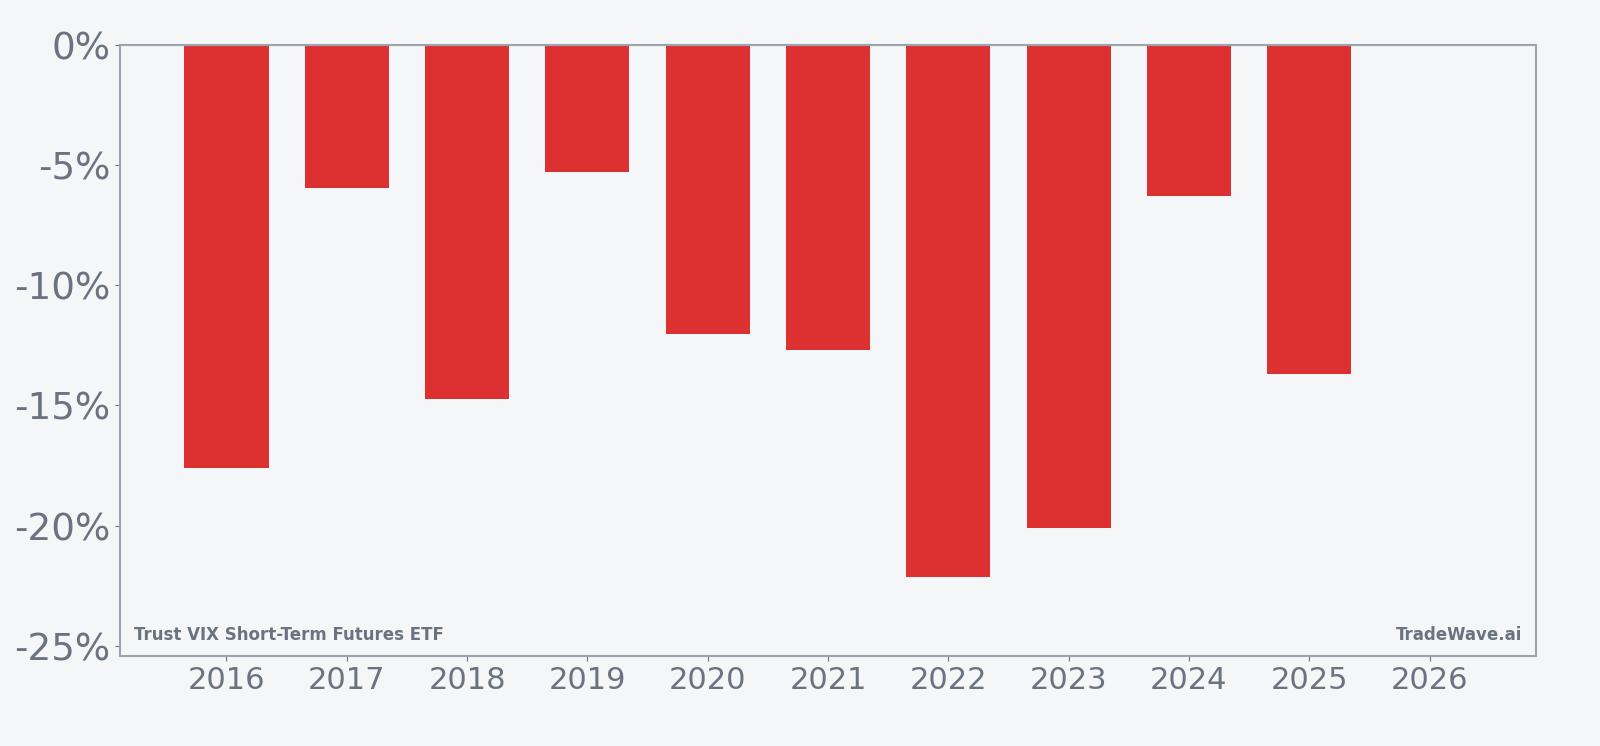
A second view of yearly outcomes shows how net returns line up with the best and worst intraperiod swings.
Across the 10-year sample, the pattern is unambiguously aligned with the short direction. Percent Profitable sits at 100%, with 10 winners and no losing years, and the median profit of 13.18% is slightly above the 13.05% average, which suggests the outliers have not been doing all the work. For a volatility-linked ETF that can swing hard in both directions, that kind of consistency in a specific calendar slice stands out.
The average winner’s 13.05% gain reflects how far VIXY has typically fallen from entry to exit when this window lines up with a grind lower in implied volatility. Because the trade direction is short, negative net returns in the per-year table correspond to profitable years for the pattern, with several double-digit drops such as 2016’s 17.62% slide and 2022’s 22.12% decline. Add it up: the cumulative return across the decade is 236% for traders who repeated the same short-bias setup each year.
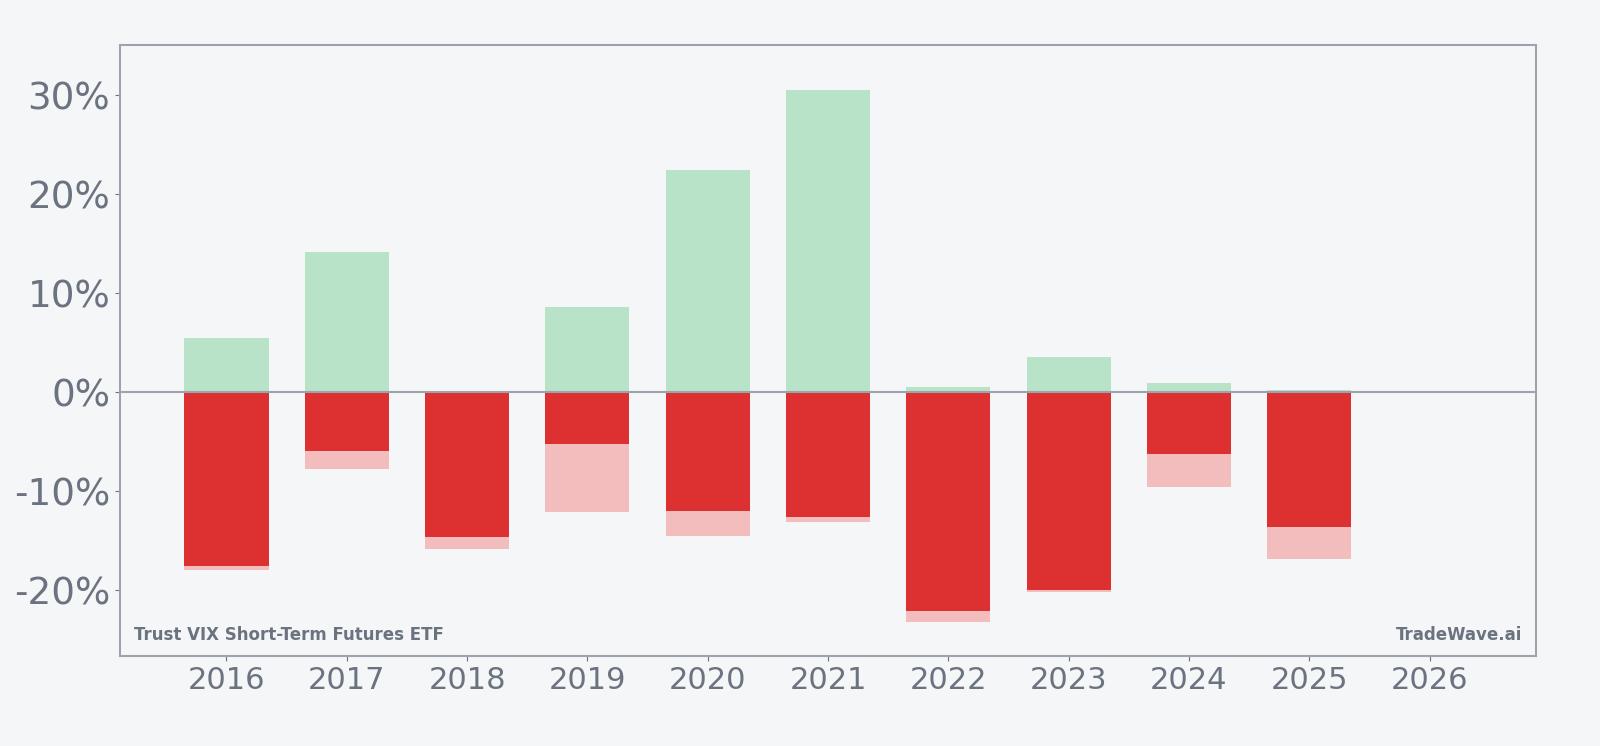
The intraperiod behavior has been choppy but ultimately supportive of the short side. Maximum favorable excursions, which capture the best point-to-peak move in the trade direction within the window, have reached into the mid-teens or higher in several years, including a 30.52% favorable move in 2021. Maximum adverse excursions, which mark the worst drawdown against the short, have also been meaningful at times, with years like 2016 and 2022 showing adverse swings of roughly 18% and 23.27% before the trade finished in the money.
The 10-year seasonal trend chart shows that, on average, the bulk of the short-side gains have tended to accrue steadily rather than in a single air pocket. The typical path slopes in favor of lower VIXY prices across most of the 28 days, with only modest countertrend bumps. That profile lines up with the pattern’s Sharpe ratio of 2.16, which is high for a volatility product and signals that the end-of-window outcomes have historically been strong relative to the variability of returns.
The combined net, maximum favorable, and maximum adverse bar chart underlines the trade-off. In strong years for the pattern, VIXY has often delivered both a sizable favorable move and a contained adverse swing, such as 2018 where the short saw little upside pain before finishing with a 14.72% profit. In other years, like 2020 and 2021, the short setup still worked but required sitting through double-digit intraperiod rallies in VIXY before the ETF rolled back over. For traders, that history argues for sizing and risk controls that can tolerate sharp but temporary volatility spikes inside an otherwise bearish seasonal window for the ETF.
The bottom line is simple: over the past decade this 28-day May window has been a clean 10-for-10 for short-bias trades in VIXY, with double-digit average gains and enough intraperiod noise to keep complacency in check.
Why does Trust VIX Short-Term Futures ETF (VIXY) follow this seasonal pattern?
One likely driver is the way equity markets often transition from early-year event risk into calmer summer trading, which can bleed implied volatility lower as realized swings compress. Analysts have also pointed to systematic volatility-selling strategies and options roll activity that tend to lean harder into short volatility exposure once major spring catalysts are out of the way, pressuring short-term VIX futures. For an ETF like VIXY that holds a rolling basket of front-month VIX futures, that combination of softer realized volatility and structural selling can translate into a persistent headwind in this part of the calendar.
History does not guarantee future results; even in a perfect 10-for-10 window, adverse excursions have at times been large enough to challenge poorly sized positions.
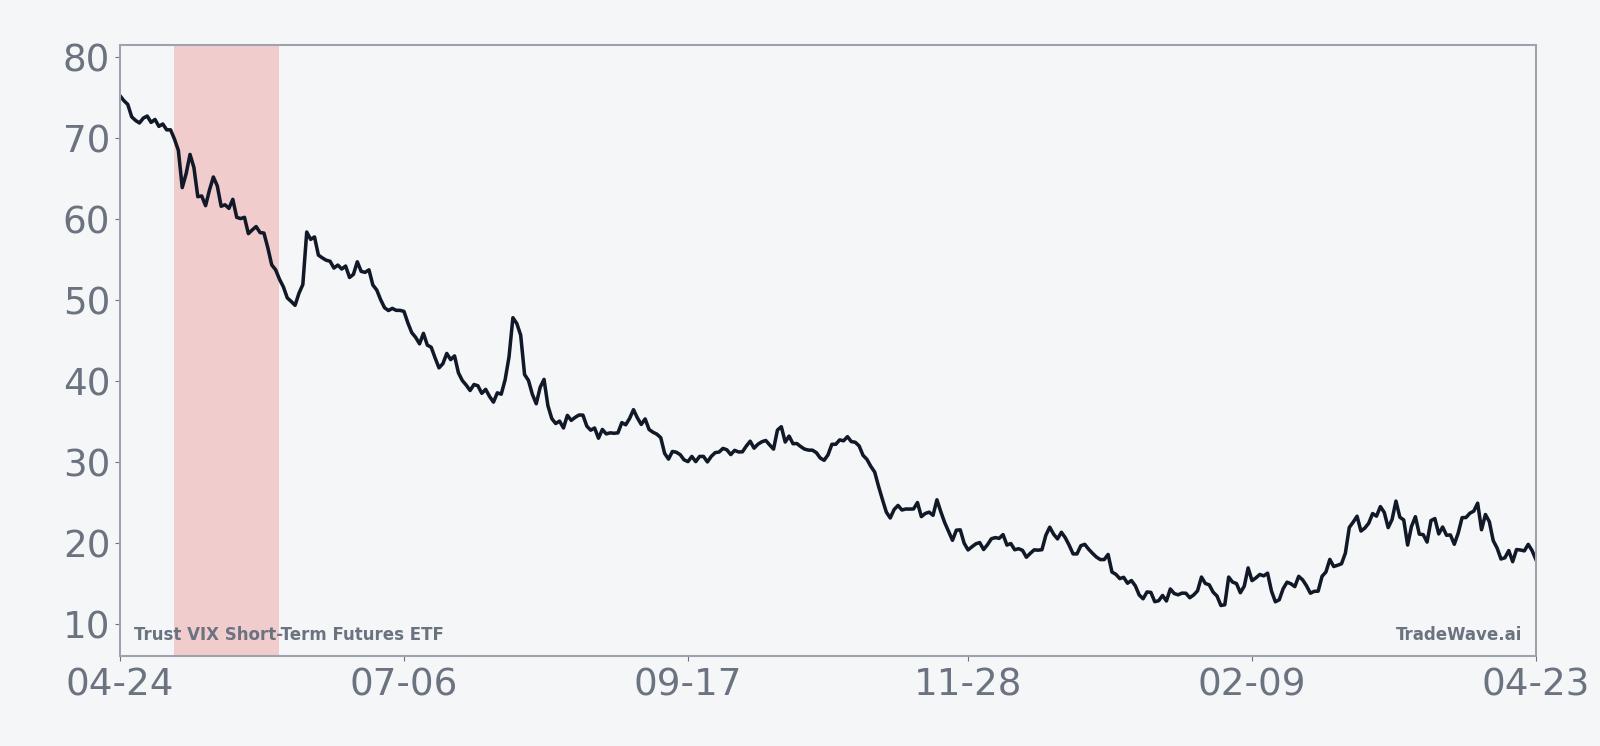
What is driving Trust VIX Short-Term Futures ETF (VIXY) today?
VIXY closed Friday at 26.92, down 0.6% on the day, after trading between 26.82 and 27.29 on volume of about 1.78 million shares, below its 20-day average of roughly 3.61 million.[1] The ETF is trading well under its 50-day moving average of 30.68 and sits about 59.8% below its 52-week high of 66.93 while only 8.5% above its 52-week low of 24.81, underscoring how much implied equity volatility has bled out since last year’s spikes.[1] With no fund-specific news or major flow data flagged around the close, the move fits a broader pattern of investors fading volatility as spot equity indices grind higher and realized swings stay contained.
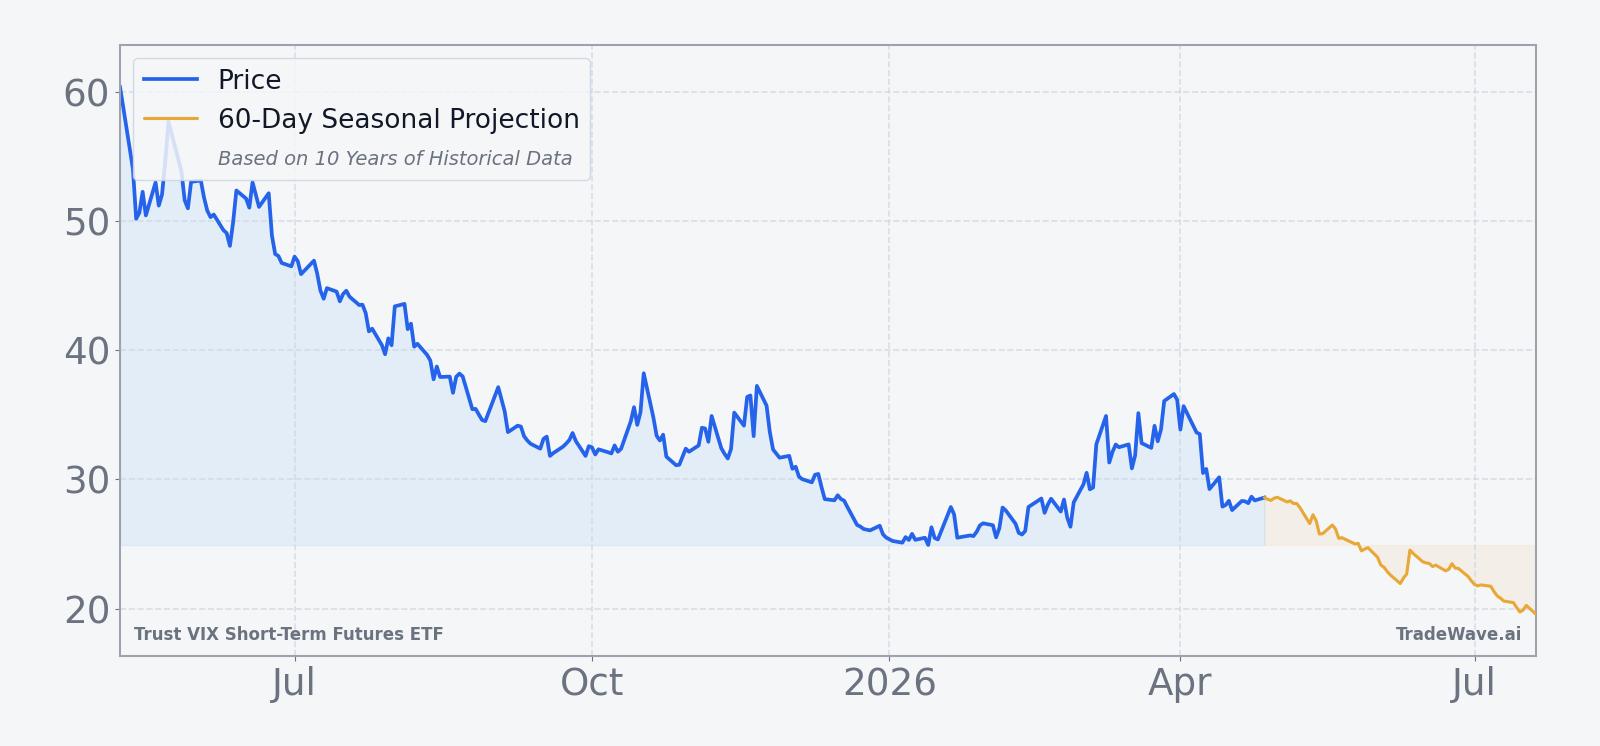
The chart below shows VIXY’s slide over the past year alongside a 60-day seasonal projection for this volatility-linked ETF.
How does VIXY’s structure shape this seasonal behavior?
Trust VIX Short-Term Futures ETF is designed to track a daily index of short-term VIX futures, not the VIX spot index itself, which means roll yield and term structure matter as much as headline volatility. When the VIX futures curve is in contango, as it often is in quieter markets, VIXY faces a steady drag as it sells cheaper expiring contracts and buys more expensive longer-dated ones. In a late-spring environment where realized volatility often cools and the curve steepens, that roll cost can compound the impact of drifting-lower futures prices, reinforcing the bearish seasonal tendency for the ETF.
What should traders watch in this VIXY seasonal window?
For traders tracking this VIXY seasonal trend, the first checkpoint is whether the ETF can stay below its 50-day moving average near 30.68 as the 28-day window unfolds.[1] A continued grind toward or even through the 52-week low around 24.81 would be consistent with the historical pattern of profitable short setups, especially if equity indices remain calm and the VIX futures curve stays in contango. A sharp, sustained break above the 50-day average accompanied by a surge in realized equity volatility would be the clearest sign that this year’s window is diverging from the 10-year script.
Beyond price levels, watch daily trading volume relative to the 20-day average of about 3.61 million shares.[1] Historically, some of the bigger intraperiod drawdowns against the short side have coincided with brief volume spikes as traders rushed into volatility hedges before those flows faded. If this year’s window sees rising volume without follow-through in price, that would echo prior years where early volatility scares ultimately gave way to lower VIXY levels by the end of the 28 days. If instead volume builds alongside a persistent price breakout, it would argue that the volatility regime itself is shifting and that the decade-long seasonal pattern may be facing a tougher test.
Sources
About this seasonal analysis
Seasonal pattern data is sourced from TradeWave.ai, which analyzes historical price behavior across annual calendar windows going back up to 30 years. Read the full data methodology or the book The 100-Year Pattern by Afshin Moshrefi (2026 edition). Past performance of seasonal patterns does not guarantee future results. This article is for informational purposes only and does not constitute investment advice.