6-for-6 Midterm Record: S&P 500 Financials Sector SPDR (XLF) Enters 358-Day Bullish Window
S&P 500 Financials Sector SPDR is edging near its 52-week high just weeks before a 358-day midterm-year seasonal window that has never produced a loss in the last six cycles.

What is the seasonal pattern for S&P 500 Financials Sector SPDR (XLF)?
S&P 500 Financials Sector SPDR has risen in 6 of 6 midterm-year windows starting around Jul 11, with an average gain of 9.36% in winning years.
- 6-for-6 record in this 358-day midterm-year window, with average winner gains of 9.36%.
- Percent Profitable is 100%, with 6 winners and 0 losers across the last six midterm election years.
- The trade direction is long, aligning the historical pattern with upside exposure to U.S. financial stocks.
- Annualized return across the window is 9.32%, with a Sharpe ratio of 1.63 based on end-of-window outcomes.
- The TradeWave Ratio of 2.4 signals that price has typically traveled meaningfully in the trade direction within the window.
- Individual years have seen sizable intraperiod swings, including adverse moves deeper than 17% even in ultimately positive cycles.
According to historical data from TradeWave.ai, this midterm-year stretch for XLF has behaved very differently from an average calendar year, with a distinct long-biased seasonal regime that starts in mid-July and runs for nearly a full year.
How strong is the upcoming seasonal window for S&P 500 Financials Sector SPDR (XLF)?
S&P 500 Financials Sector SPDR has posted gains in every one of the last six midterm election years during the 358-day window that begins around Jul 11, averaging 9.36% in those winning stretches. Today the ETF closed at 53.73, down 0.29% on the session and sitting about 3.3% below its 52-week high of 55.55, after a 4.33% advance over the past month.[1]
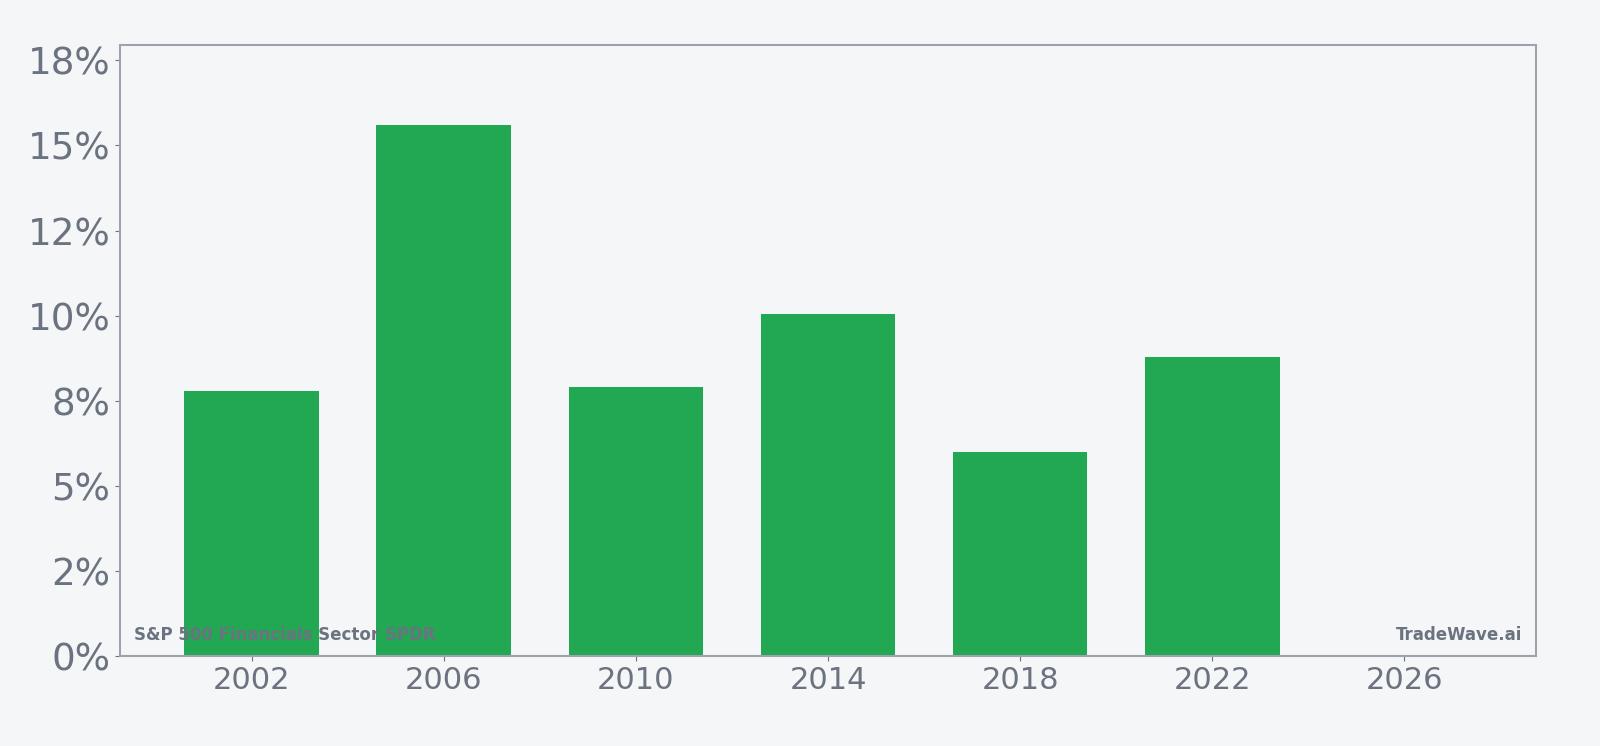
The presidential election cycle matters here because this pattern is built only from midterm election years, a phase that often features tighter financial conditions and heavier policy debate around regulation and capital rules. Grouping by this cycle strips out noise from other years and focuses on how financial stocks have behaved when Washington is in the middle of its four-year rhythm, just before the historically stronger pre-election year.
This seasonal window begins on Jul 11, 2026 and spans 358 trading days. Historically, during this period, S&P 500 Financials Sector SPDR has shown a strong long-biased tendency, with all six midterm-year samples finishing higher. The annualized return of 9.32% and cumulative gain of 70% across those six cycles point to a persistent bullish seasonal trend rather than a one-off anomaly.
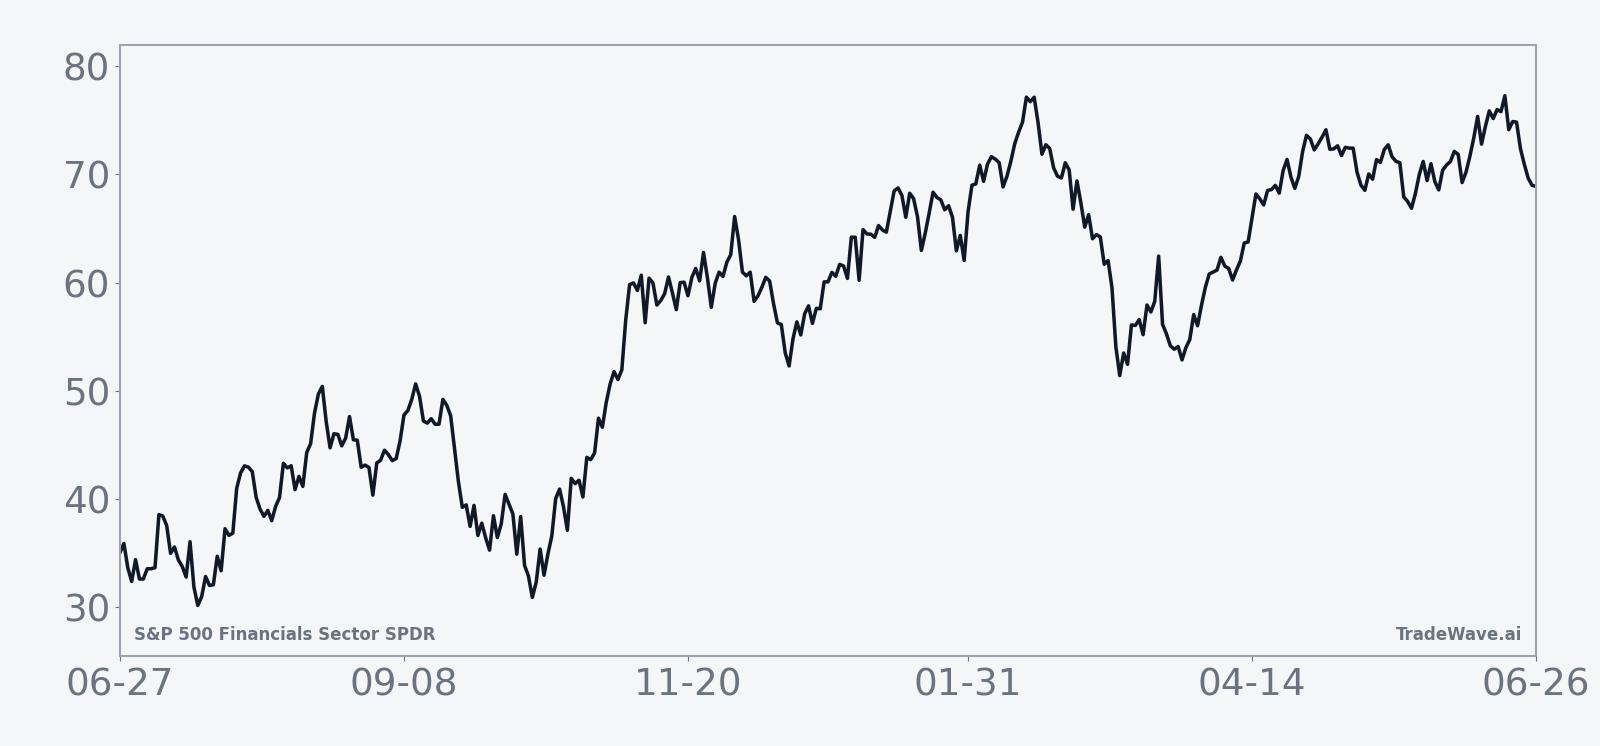
The historical seasonal average suggests that gains in this XLF trading window tend to build steadily rather than in a single burst, with the trend line grinding higher across much of the period. That fits a pattern where financials benefit from a combination of improving credit conditions, gradual rate shifts and rising risk appetite as markets transition from the midterm election year into the year before the presidential election.
Year-by-year net returns and intraperiod swings show how much upside and downside XLF has historically experienced inside this window.
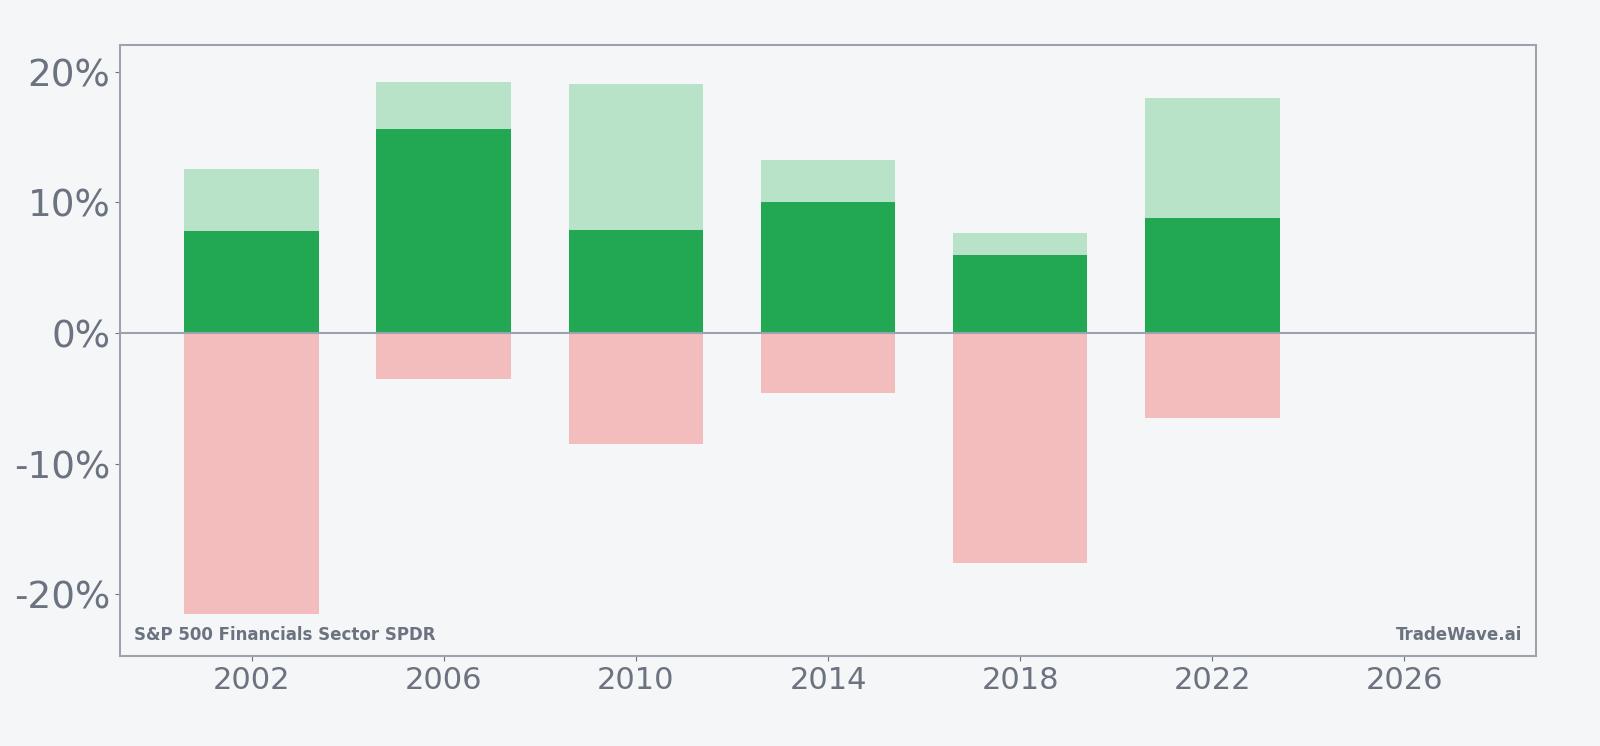
The per-year breakdown shows that even the strongest seasonal patterns come with real risk. In 2006, XLF finished the window up 15.61% after a maximum favorable move of 19.17% and only a modest 3.5% worst drawdown from entry, a relatively smooth ride for longs. By contrast, 2002 and 2018 both ended positive, up 7.8% and 5.99% respectively, but saw maximum adverse excursions of 21.52% and 17.61%, reminding traders that sizeable drawdowns have occurred inside otherwise winning years.
The 2010 and 2022 windows sit in the middle of the pack, with net gains of 7.9% and 8.8% and maximum favorable moves near or above 17%, paired with adverse swings between roughly 6% and 9%. Add it up: six midterm-year windows, six positive outcomes, and a history of XLF traveling meaningfully in both directions before finishing higher. The pattern is clear: this window has favored longs in all six midterm election years in the sample, but the path has often been bumpy.
History does not guarantee future results; adverse excursions (MAE) can be large even in winning windows.
Why does S&P 500 Financials Sector SPDR (XLF) follow this seasonal pattern?
One likely driver is the way the earnings calendar and regulatory agenda cluster for big banks and insurers around the midterm and into the year before the presidential election. Analysts have pointed to a tendency for credit quality, loan growth and capital return plans to look clearer as the cycle progresses, which can support financial stocks over long stretches. This pattern may also reflect institutional portfolio repositioning as investors rotate toward cyclicals and rate-sensitive sectors when policy uncertainty around the midterm vote begins to fade.
What is driving S&P 500 Financials Sector SPDR (XLF) today?
S&P 500 Financials Sector SPDR finished Thursday at 53.73, slipping 0.29% on the day as it traded between an intraday low of 53.55 and a high of 54.10 on volume of about 24.7 million shares.[1] The ETF is roughly 3.3% below its 52-week high of 55.55 and about 13.5% above its 52-week low near 47.34, with the 50-day moving average sitting at 51.75 and the 20-day average volume closer to 39.4 million shares, underscoring that today’s pullback came on lighter-than-typical activity.[1]
The chart below situates the latest move in its recent multi-month context and overlays a short-term seasonal projection.
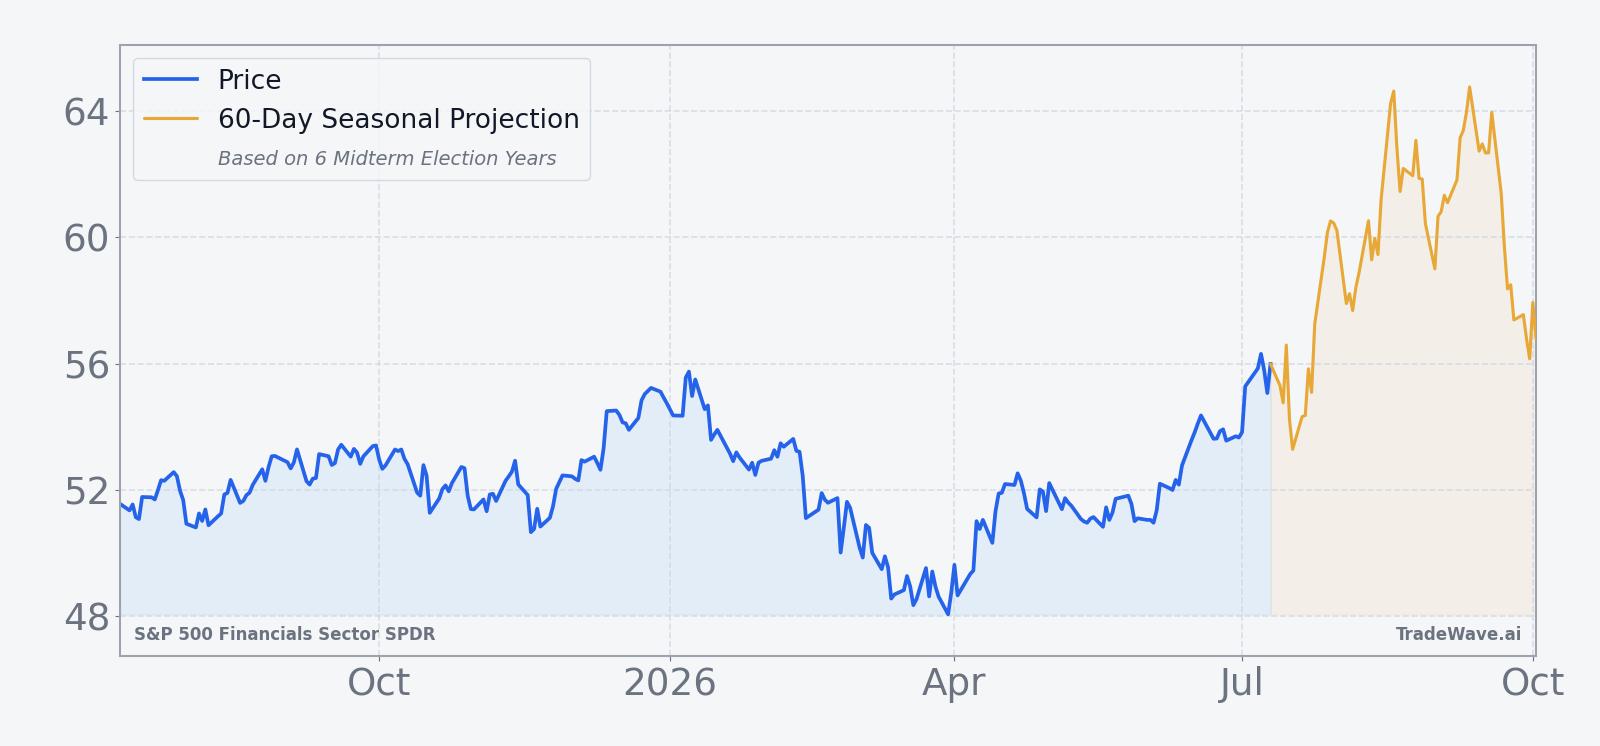
From a near-term perspective, XLF’s one-month gain of 4.33% has pulled the ETF comfortably above its 50-day moving average, suggesting a constructive trend into the heart of bank earnings season and the Federal Reserve’s summer communications calendar.[1] With the ETF already near the top of its 12-month range, the upcoming midterm-year seasonal window adds a second layer of context for traders weighing whether financials can extend this run or are due for a deeper shakeout before the longer historical pattern kicks in.
What should traders watch as this XLF seasonal window approaches?
The first marker is timing. The 358-day XLF seasonal window tied to midterm election years begins on Jul 11, 2026, and then runs straight through into the year before the presidential election. Historically, that has been a favorable backdrop for long exposure to U.S. financials, but the per-year data show that the path has included double-digit drawdowns even when the final outcome was positive.
Second, levels matter. With XLF only a few points below its 52-week high and well above its 50-day moving average, traders will be watching whether pullbacks ahead of mid-July stay shallow and orderly or start to resemble the deeper adverse excursions seen in 2002 and 2018. A pattern where dips hold above the 50-day line would rhyme more with the smoother 2006-style window, while a break back toward the low 50s or high 40s would echo the more volatile years in the sample.
Third, the macro and policy calendar will shape how this historical seasonality interacts with reality. The midterm election year often brings heightened debate over bank regulation, capital requirements and the interest-rate path, all of which feed directly into financial-sector earnings power. If credit spreads stay contained and the Fed signals a stable or gently easing stance, that would align with the constructive historical XLF seasonal trend; a surprise tightening or regulatory shock would be a clear test of how robust this pattern really is.
Finally, behavior inside the window will be the real tell. If XLF enters the Jul 11 start date with firm breadth across banks, insurers and asset managers and then begins to grind higher with only modest pullbacks, it would be another data point in favor of the long-biased midterm-year seasonal pattern. A choppy or sharply negative first leg, especially one that mirrors the large historical MAE readings, would not invalidate the pattern but would remind traders that even strong seasonal tendencies can involve uncomfortable volatility along the way.
Sources
About this seasonal analysis
Seasonal pattern data is sourced from TradeWave.ai, which analyzes historical price behavior across annual calendar windows going back up to 30 years. Read the full data methodology or the book The 100-Year Pattern by Afshin Moshrefi (2026 edition). Past performance of seasonal patterns does not guarantee future results. This article is for informational purposes only and does not constitute investment advice.