With XLK Just 3.5% Off Records, S&P 500 Technology Sector SPDR Enters Historically Bullish Yearlong Run
S&P 500 Technology Sector SPDR is nearing a midterm-year seasonal window that has never posted a loss in this dataset, even as XLK trades just below its 52-week high.

What is the seasonal pattern for S&P 500 Technology Sector SPDR (XLK)?
S&P 500 Technology Sector SPDR has risen in 6 of 6 midterm-year windows starting around early July, with an average gain of 21.08% in winning years.
- 6 for 6 in this window, with winning years averaging 21.08% gains across the last six midterm election cycles.
- The upcoming 356-day window begins Jul 2, 2026 and runs deep into the year before the presidential election.
- Percent Profitable is 100%, with 6 winners and 0 losers in the TradeWave sample.
- Annualized return across these windows is 20.86%, with a Sharpe ratio of 2.13 on end-of-window outcomes.
- The TradeWave Ratio of 2.19 signals that XLK typically travels meaningfully in the long direction during this stretch.
- Individual years have still seen sizable drawdowns inside the window, including adverse moves larger than 17% before finishing higher.
According to historical data from TradeWave.ai, this midterm-year stretch has behaved very differently from an average calendar year for XLK, and the next iteration is about to start.
How strong is the upcoming seasonal window for S&P 500 Technology Sector SPDR (XLK)?
S&P 500 Technology Sector SPDR has posted gains in every one of the last six midterm-year windows that start in early July and run for roughly a year, averaging 21.08% per cycle. Today XLK closed at 191.40, down fractionally on the session and sitting about 3.5% below its 52-week high of 198.26, after a strong run over the past month. That combination of a clean historical win streak and prices hovering near record territory sets up a high-stakes test of whether this tech-heavy seasonal pattern can extend its perfect record.
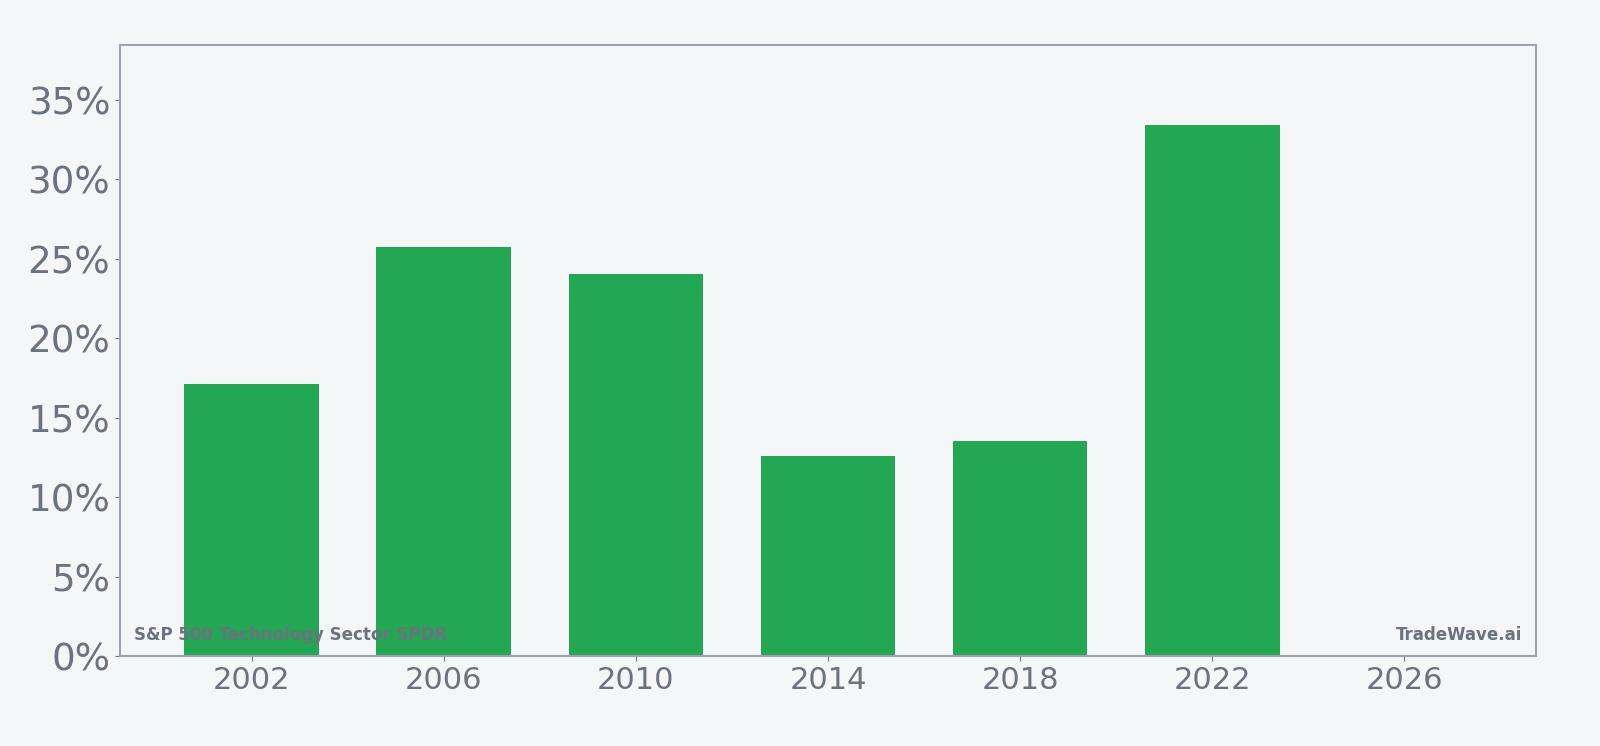
The presidential election cycle matters here because this pattern is built only from midterm election years, a phase that often features policy uncertainty early on and then a more supportive backdrop as markets look ahead to the year before the presidential election. XLK’s window starting Jul 2 sits squarely in that transition, capturing both the late-midterm environment and the historically risk-on pre-election year that follows.
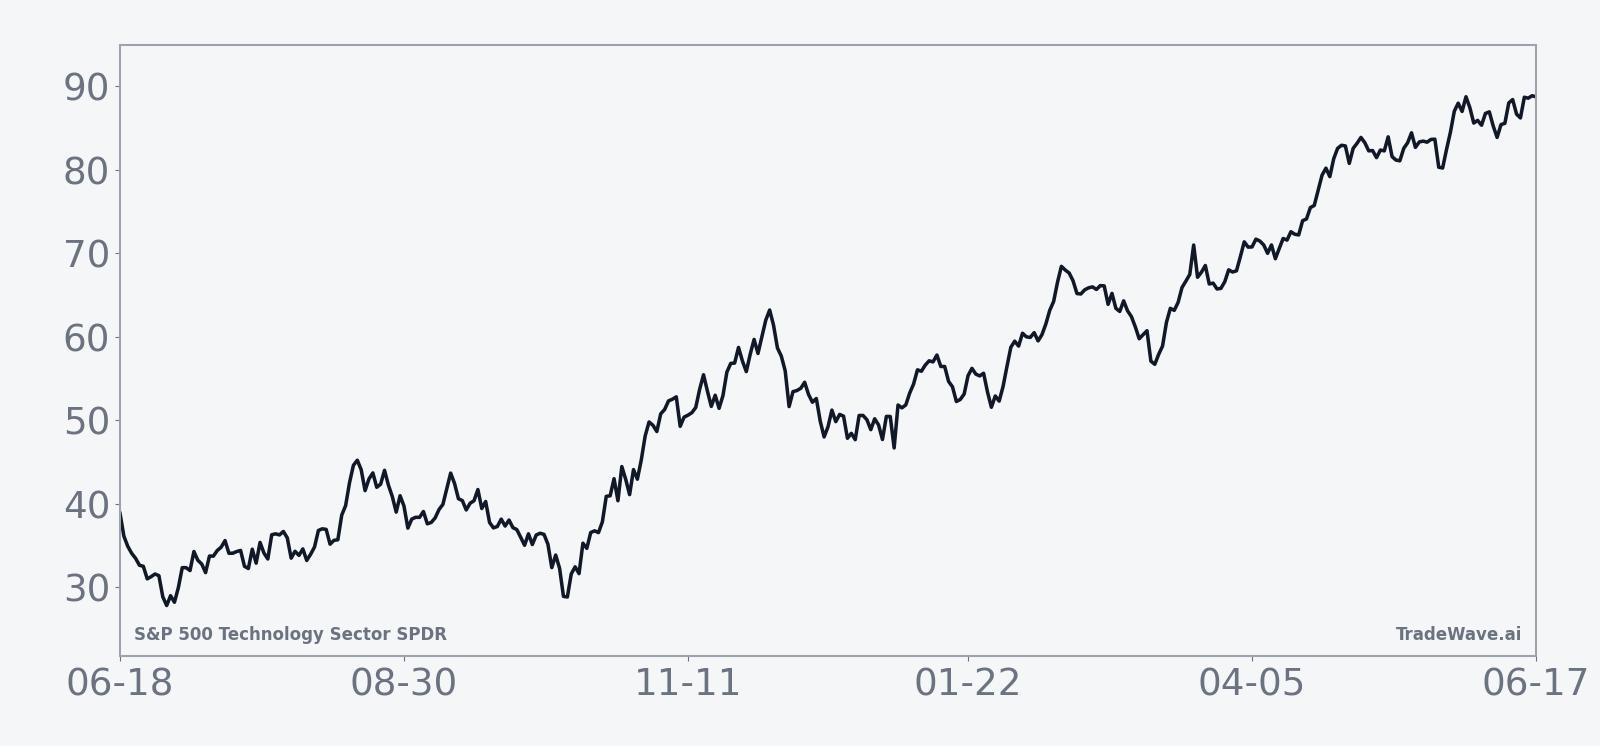
The historical seasonal average trend for this XLK window slopes higher for most of the 356 trading days, with only modest pauses. That reflects the underlying stats: a 211% cumulative return across the six-sample history and an annualized gain of 20.86% for the long trade direction. The profile is not a straight line, but the average path suggests that pullbacks have tended to be interruptions in a broader uptrend rather than regime changes.
Looking at individual years, the strongest outcome came in 2022, when XLK gained 33.44% between the early-July entry and the end of the window. The weakest gain was 12.61% in 2014, still a solid double-digit move for a sector ETF. Add it up: every midterm-year sample in this pattern delivered a positive net return, even when the broader macro backdrop was noisy.
Yearly net and intraperiod swings show how far XLK has tended to run in both directions before the window closes.
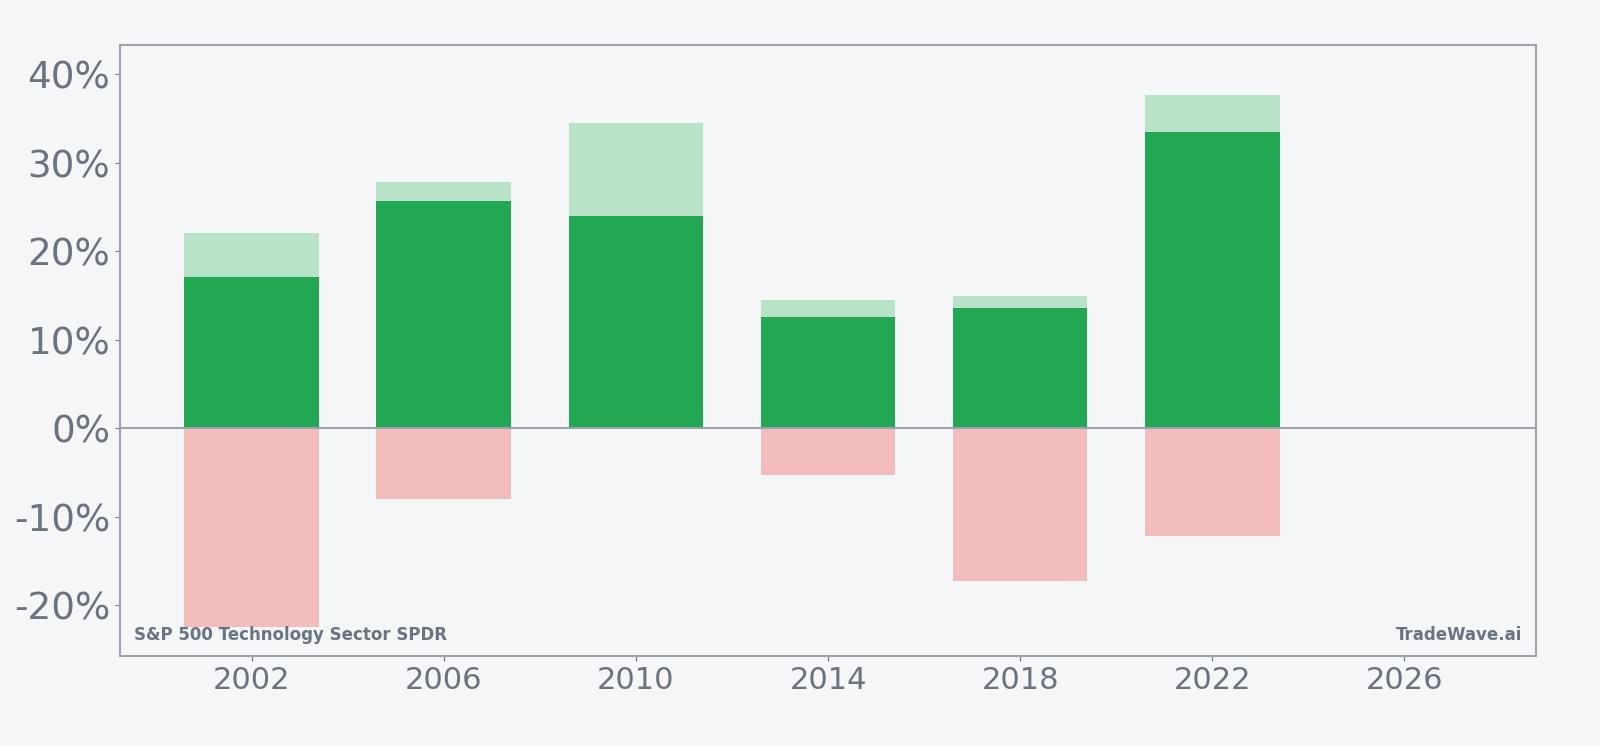
The maximum favorable move inside the window has often been larger than the final gain, with peak run-ups such as 37.69% in 2022 and 34.48% in 2010 before prices cooled into the exit. On the downside, the worst intraperiod drawdowns have been meaningful: XLK saw a 22.45% adverse move in 2002 and a 17.23% drop in 2018 at some point during otherwise winning windows. That mix of strong upside potential and sizable temporary hits is exactly what the TradeWave Ratio and the MFE/MAE profile are flagging: this is a long-biased regime, but not a gentle one.
History does not guarantee future results; adverse excursions can be large even in winning windows, and investors can experience double-digit drawdowns before the seasonal tendency reasserts itself.
The single most important takeaway is simple: XLK is 6 for 6 in this midterm-to-pre-election window, with every sample delivering a double-digit gain despite sometimes sharp drawdowns along the way.
Why does S&P 500 Technology Sector SPDR (XLK) follow this seasonal pattern?
One likely driver is the way tech earnings and capital spending plans cluster around the midterm and pre-election years, when policy visibility often improves and corporate IT budgets loosen. Analysts have also pointed to institutional portfolio rebalancing and sector rotation, as investors lean back into growth and innovation plays once early-midterm volatility passes. This XLK seasonal pattern may reflect that shift, with large-cap tech regaining leadership as the political calendar moves from midterm uncertainty toward the presidential race.
What is driving S&P 500 Technology Sector SPDR (XLK) today?
S&P 500 Technology Sector SPDR slipped 0.02% on Jun 23 to close at 191.40, a tiny move that leaves the ETF up 7.84% over the past month and about 3.5% below its 52-week high of 198.26. Trading volume of roughly 9.9 million shares came in below the 20-day average of about 15.1 million, suggesting a quiet consolidation day rather than a decisive shift in positioning. With XLK still well above its 50-day moving average near 172.71, the broader trend remains firmly higher as investors weigh the sector’s earnings power against a backdrop of elevated valuations and ongoing rate uncertainty.
The chart below situates the latest move in its recent multi-month context and overlays a short-term seasonal projection.
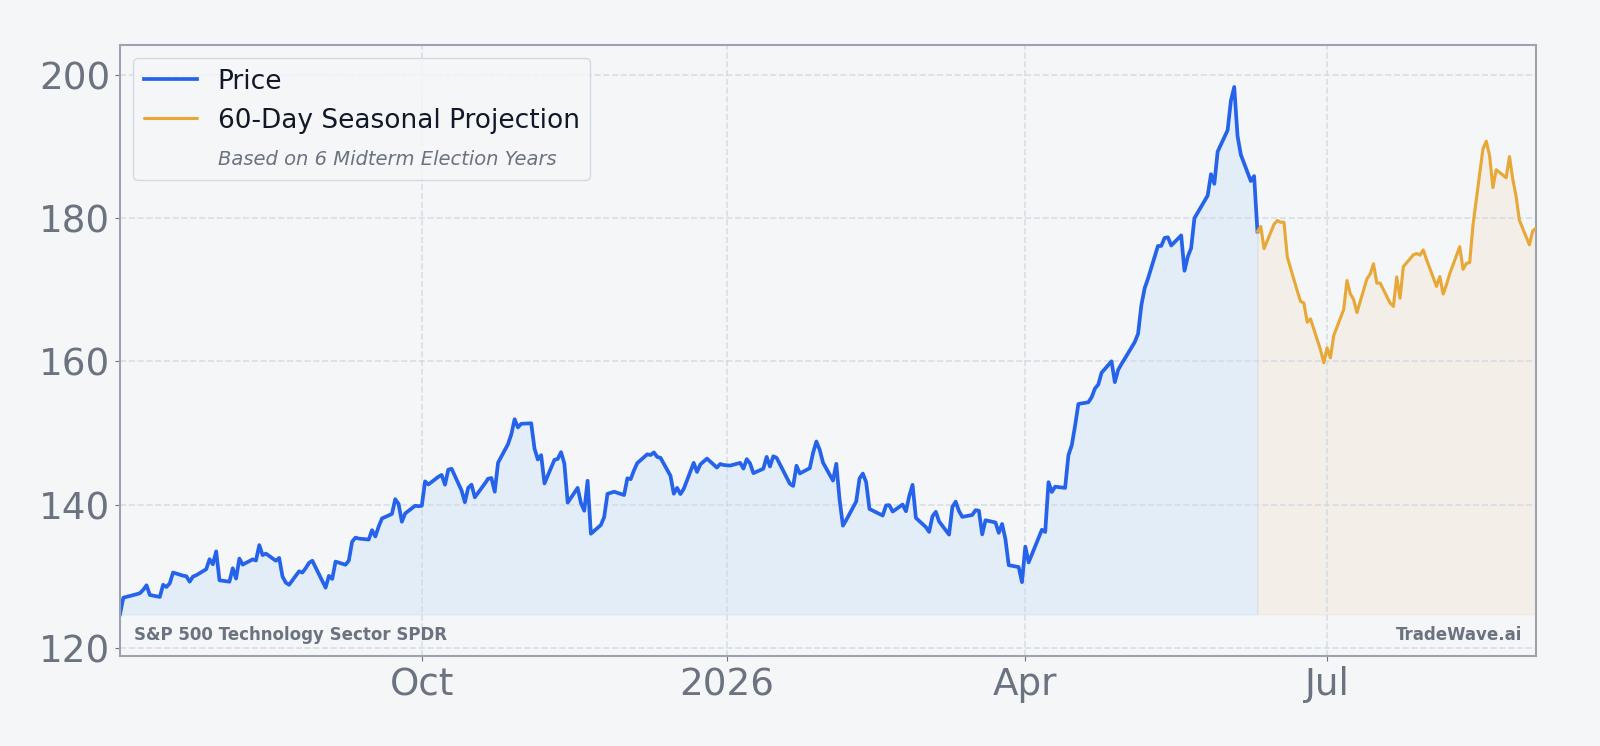
That setup creates a clear tension heading into Jul 2. On one side is a powerful existing uptrend in mega-cap technology, which has already pushed XLK to fresh highs in 2026. On the other is a long midterm-year seasonal regime that, historically, has delivered further gains but with episodes of sharp downside volatility along the way. For traders and longer-term investors alike, the question over the next few weeks is not whether seasonality “works,” but how this particular cycle’s macro and policy backdrop will interact with a pattern that has yet to produce a losing year in this dataset.
What should traders watch as this XLK seasonal window opens?
First, watch how XLK behaves around the Jul 2 start date and through the first few months of the window. In prior cycles, some of the deepest adverse moves, such as the 22.45% drawdown in 2002 and the 17.23% slide in 2018, occurred inside otherwise bullish regimes, so early weakness would not automatically invalidate the pattern. What would contradict the historical script is a sustained break that leaves the ETF down meaningfully at the end of the 356-day stretch, something that has not happened in the six-sample history.
Second, keep an eye on key levels that have mattered in recent trading. The 52-week high near 198 and the rising 50-day moving average around 172.71 bracket the current range and offer a simple read on whether buyers are still willing to pay up for tech exposure. A decisive push through the old high early in the window would be consistent with the historical tendency for strong maximum favorable moves, while a break below the 50-day line with expanding volume would hint that this cycle may diverge from the past.
Finally, map the seasonal window against the policy calendar. This midterm-year pattern runs straight into the year before the presidential election, a phase that has often coincided with more supportive fiscal and regulatory signals for growth sectors. If that backdrop repeats, and XLK continues to respect its longer-term uptrend while absorbing occasional double-digit pullbacks, the historical midterm-to-pre-election seasonal profile will have passed another real-time stress test. If instead the ETF spends most of the window grinding sideways or finishing lower, it will mark the first real break in a pattern that, so far, has been flawless.
Sources
About this seasonal analysis
Seasonal pattern data is sourced from TradeWave.ai, which analyzes historical price behavior across annual calendar windows going back up to 30 years. Read the full data methodology or the book The 100-Year Pattern by Afshin Moshrefi (2026 edition). Past performance of seasonal patterns does not guarantee future results. This article is for informational purposes only and does not constitute investment advice.