Quiet Tailwind: S&P 500 Financials Sector SPDR (XLF) Enters Long-Biased Midterm-to-Pre-Election Stretch
S&P 500 Financials Sector SPDR is trading inside a 358-day midterm-year seasonal window that has never produced a loss in the last six cycles, putting a quiet bullish tailwind behind bank and insurance stocks.

What is the seasonal pattern for S&P 500 Financials Sector SPDR (XLF)?
S&P 500 Financials Sector SPDR has risen in 6 of 6 midterm-year windows during this 358-day stretch, with an average gain of 9.36% in winning years.
- 6 for 6 in this window, with XLF posting gains every midterm-year cycle since 2002 and averaging 9.36% per winning year.
- The current 358-day S&P 500 Financials Sector SPDR trading window began Jul 11 and runs deep into the following pre-election year.
- Percent Profitable is 100%, with 6 winners and 0 losers across the last six midterm election years.
- Average winner gains of 9.36% stack up against a 70% cumulative return across all six historical windows.
- Intraperiod swings have been large, with some years seeing double-digit peak run-ups and double-digit drawdowns before finishing higher.
- The pattern aligns with the broader midterm-to-pre-election seasonal trend that has often favored risk-on exposure in financials.
According to historical data from TradeWave.ai, this midterm-year stretch has behaved very differently from an average calendar year for XLF, with a distinct long-biased profile that traders rarely see discussed in mainstream sector research.
How strong is the current seasonal window for S&P 500 Financials Sector SPDR (XLF)?
S&P 500 Financials Sector SPDR has finished higher in every one of the last six midterm election years during this 358-day window, averaging a 9.36% gain for long positions. The latest iteration of that window started on Jul 11 and will carry financials from the heart of the midterm election year into the following pre-election year, a phase that has often coincided with easier policy and firmer risk appetite. For traders who care about historical seasonality, this is one of the cleaner long-biased patterns on the XLF calendar.
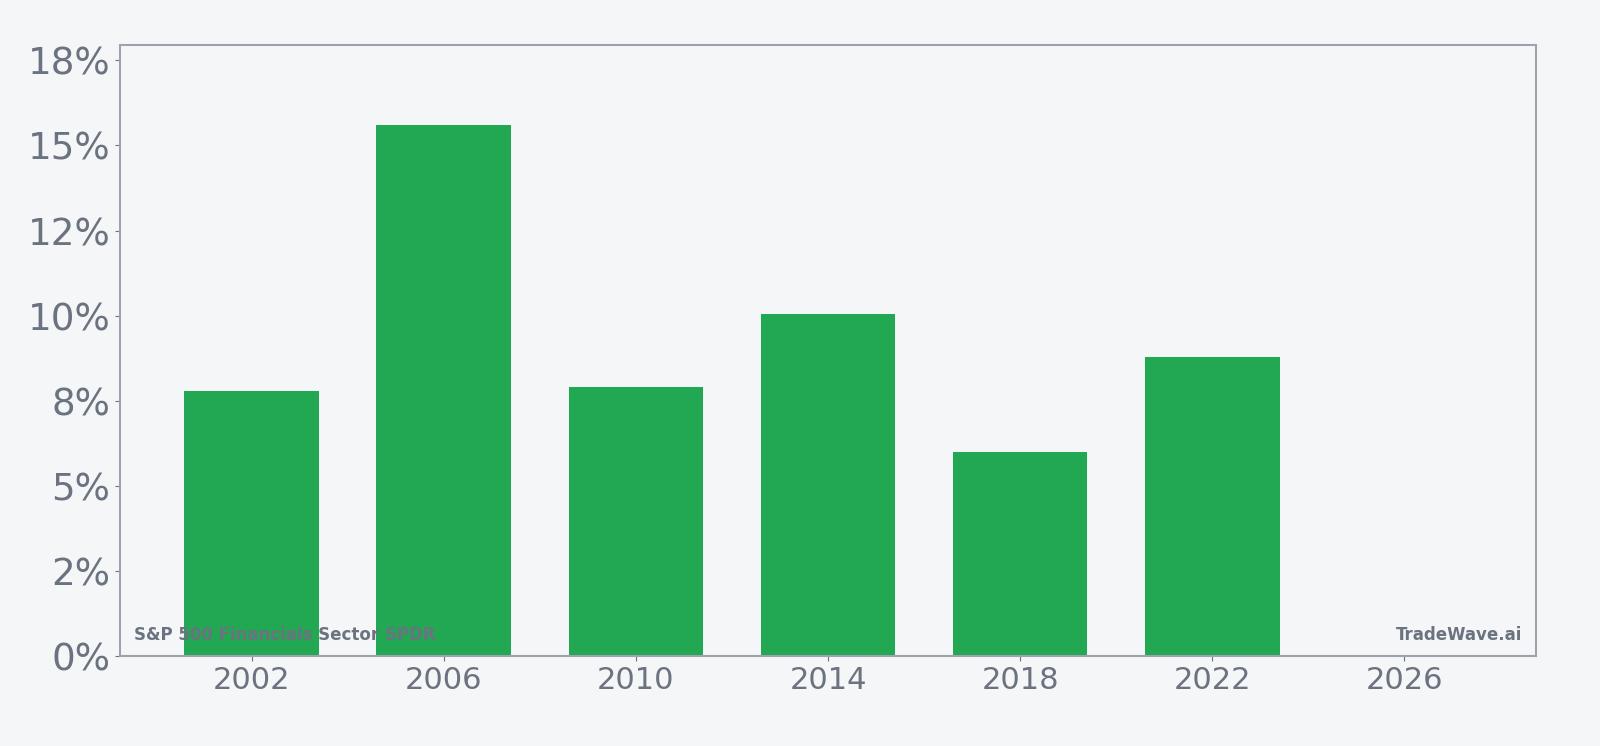
The pattern is built on the last six midterm election years, so it explicitly keys off the presidential cycle rather than simple calendar averages. In each of those years, a long XLF position held from roughly mid-July of the midterm year through the following early summer ended in the green, with net returns ranging from 5.99% in 2018 to 15.61% in 2006. That consistency is unusual for a sector ETF that is heavily exposed to interest rates, credit spreads and regulation.
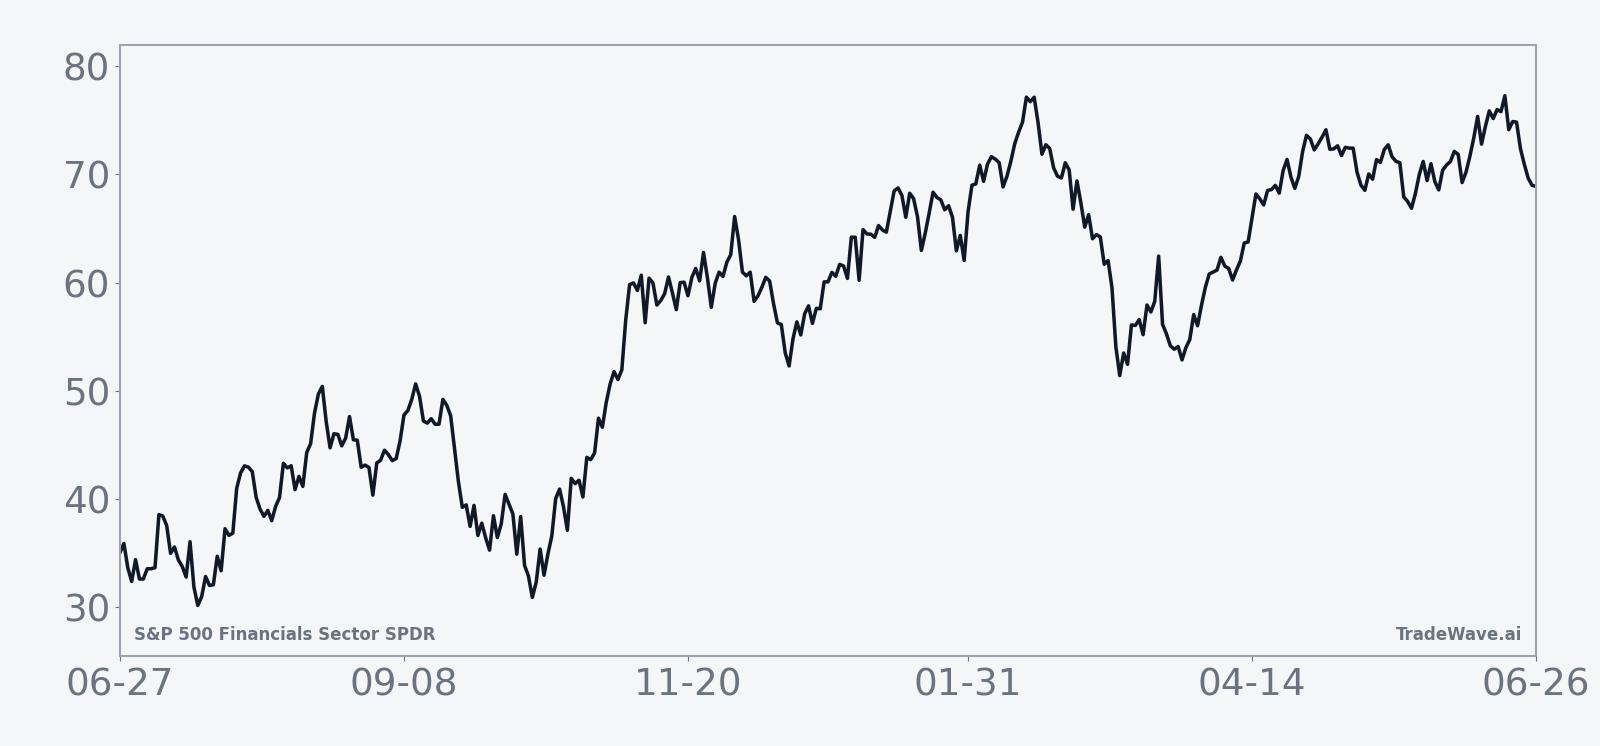
The historical seasonal average shows gains building gradually rather than in a single burst. In prior cycles, XLF has tended to grind higher through the back half of the midterm year, wobble around year-end, then extend the move as the pre-election year gets underway. That fits the broader pattern in which midterm-year volatility often gives way to a more supportive backdrop as policy uncertainty clears and the next presidential race comes into focus.
A second view layers in the best and worst intraperiod swings for each year, highlighting how much XLF has typically moved inside the window before settling at its final result.
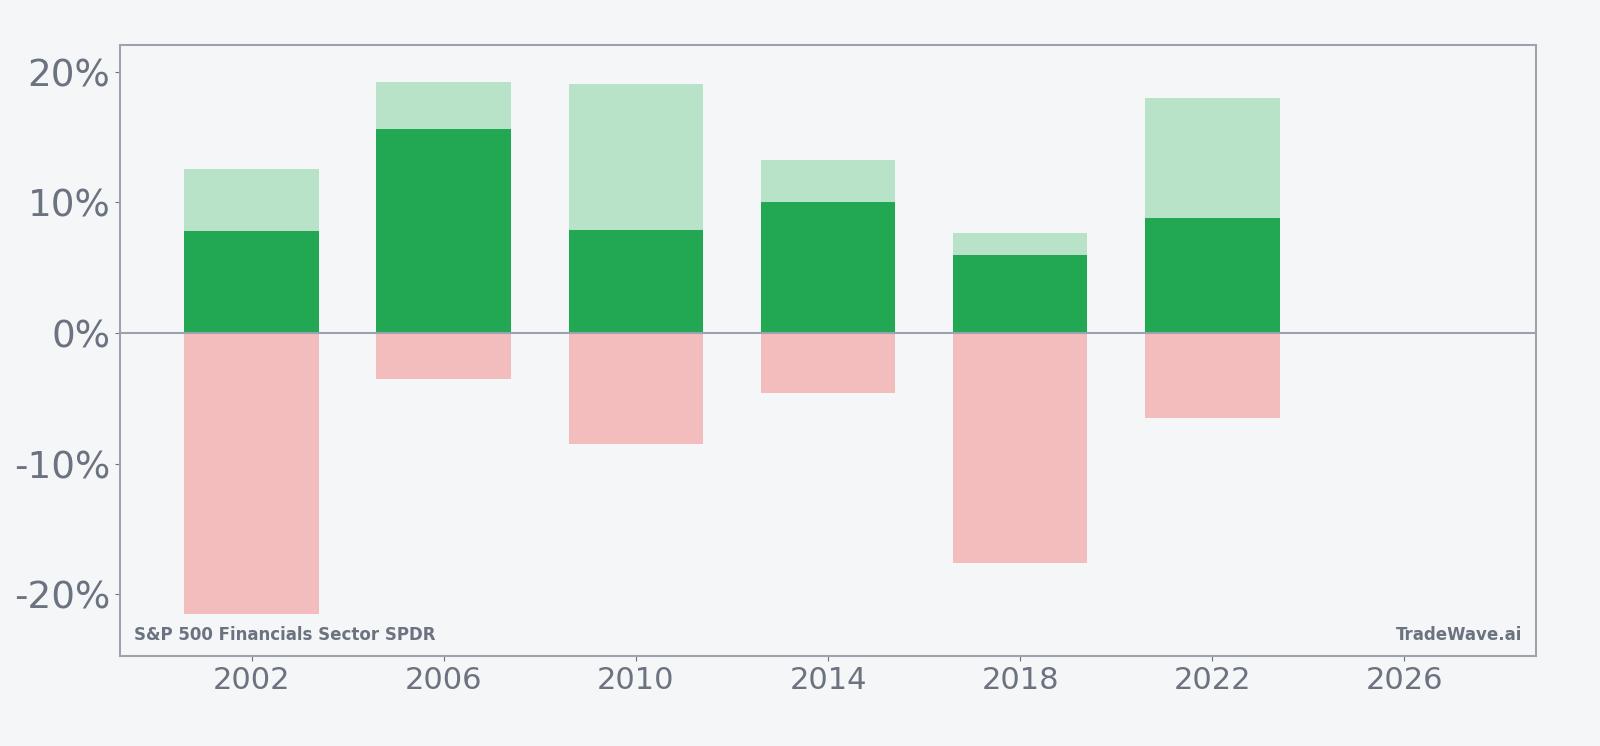
Those yearly bars show why the TradeWave Ratio of 2.4 matters: XLF has often traveled meaningfully in the trade direction inside the window, with maximum favorable moves in the mid-teens or higher, even when the final net gain was closer to single digits. At the same time, maximum adverse excursions have occasionally been deep, with years like 2002 and 2018 seeing double-digit drawdowns from the entry before recovering to finish positive. For a long-only seasonal setup, that combination of strong upside potential and real downside swings is a reminder that path matters as much as destination.
Across all six midterm-year samples, the cumulative return for this window clocks in at 70%, which is consistent with the roughly 9% annualized profile. The Sharpe ratio of 1.63, based on end-of-window outcomes, signals that the reward-to-variability has been solid for a sector ETF that lives at the intersection of equity and rate risk. The pattern is also heavily skewed to the long side, with 76 “trend long” days and zero “trend short” days in the TradeWave framework, underscoring how rarely this window has favored outright bearish positioning in financials.
History does not guarantee future results; even in a 100% winning sample, adverse excursions within the window can be large and uncomfortable before any recovery takes hold.
Why does S&P 500 Financials Sector SPDR (XLF) follow this seasonal pattern?
One likely driver is the way the presidential election cycle shapes policy expectations for banks and insurers. Midterm years often bring regulatory noise and rate uncertainty early on, but by the back half of the year and into the pre-election year, the policy path is usually clearer and credit conditions are better understood, which can support financial stocks. This pattern may also reflect institutional portfolio repositioning, as large investors rotate into cyclicals and financials when they anticipate a friendlier growth and liquidity backdrop heading into the next presidential race.
What is driving S&P 500 Financials Sector SPDR (XLF) today?
With no fresh macro or sector headlines in the latest dataset, XLF’s near-term story is less about a single catalyst and more about where it sits in the broader cycle. The ETF has logged a 7.41% gain over the past month, a move that lines up neatly with the early portion of this midterm-year seasonal window and suggests investors have been leaning back into financials as rate and credit fears ease at the margin. Average 20-day volume of about 35.5 million shares points to healthy liquidity, which can amplify both follow-through and reversals as the window progresses.
The chart below situates the latest move in its recent multi-month context, alongside a 60-day seasonal projection based on prior midterm-year behavior.
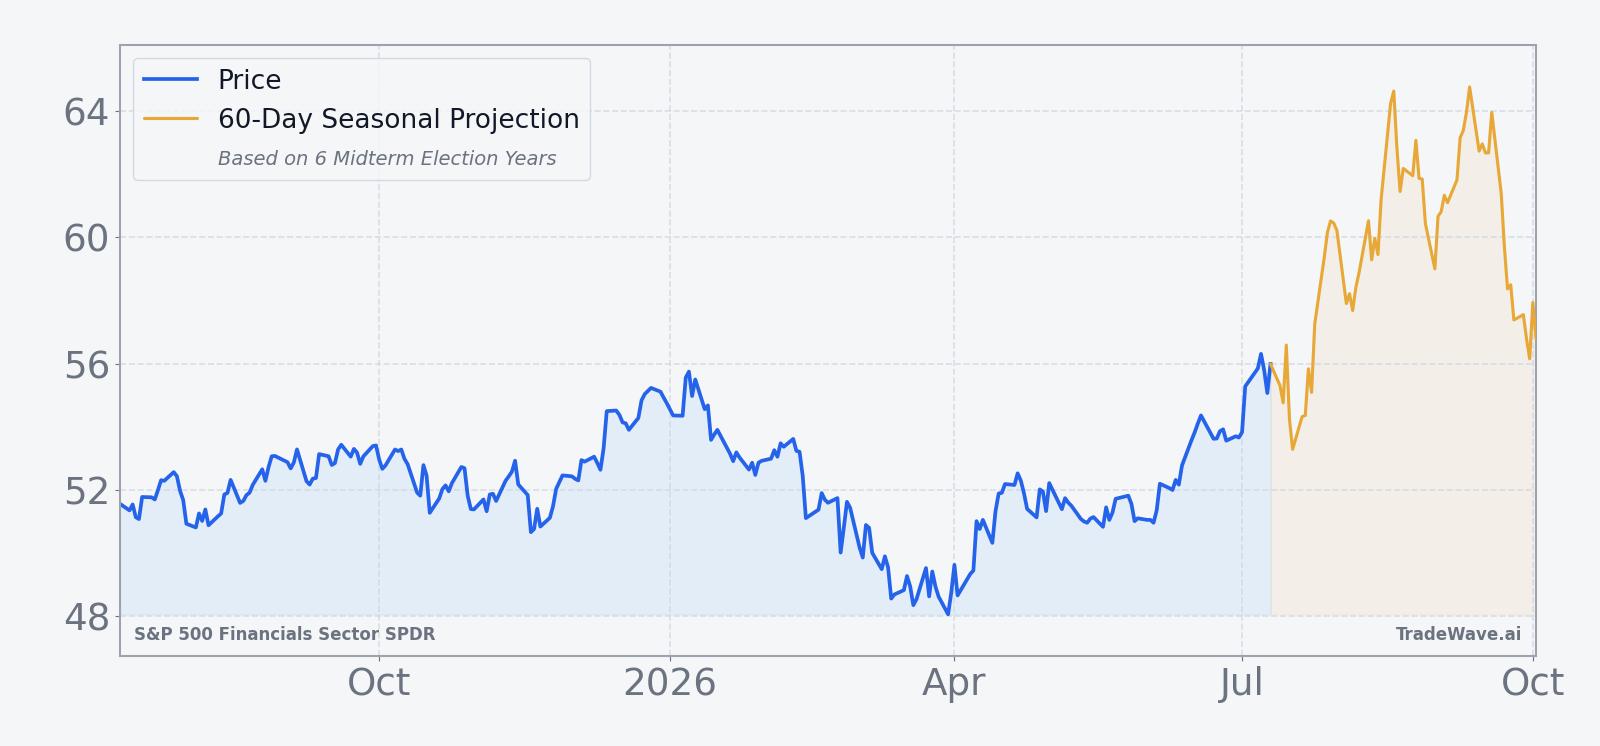
On this view, the recent one-month rally is not an outlier relative to the historical XLF seasonal trend in midterm years, which has often featured a firming tape into late summer. The 50-day moving average near 52.44 has acted as a reference line for trend followers, and the current price zone relative to that level will help determine whether this year’s path tracks the historical average or diverges. For traders watching the S&P 500 Financials Sector SPDR trading window, the key tell over the next few weeks will be whether pullbacks stay shallow and orderly, as they often have in prior winning years, or whether drawdowns start to resemble the deeper adverse excursions seen in 2002 and 2018.
What should traders watch in this XLF seasonal window?
First, watch how XLF behaves around its recent one-month gains: in prior midterm-year cycles, sustained strength into late summer has usually been a sign that the long-biased seasonal pattern is tracking on schedule. Second, monitor drawdowns relative to past maximum adverse excursions; if pullbacks remain modest compared with the double-digit dips seen in some earlier years, that would be more consistent with the smoother versions of this pattern. Third, keep an eye on policy and rate expectations as the midterm year progresses into the pre-election year, since this window historically benefits when regulatory risk feels contained and the yield curve is not flashing acute stress. Finally, if XLF were to break sharply against the historical seasonal trend with heavy volume, that would be an early signal that this cycle may be rewriting the usual midterm-year financials playbook rather than repeating it.
Sources
About this seasonal analysis
Seasonal pattern data is sourced from TradeWave.ai, which analyzes historical price behavior across annual calendar windows going back up to 30 years. Read the full data methodology or the book The 100-Year Pattern by Afshin Moshrefi (2026 edition). Past performance of seasonal patterns does not guarantee future results. This article is for informational purposes only and does not constitute investment advice.