6-for-6 Midterm Record: S&P 500 Healthcare Sector SPDR (XLV) Nears 155-Day Rally Window
S&P 500 Healthcare Sector SPDR is nearing a midterm-year seasonal window that has never posted a loss in this sample, just as call buyers and sector momentum line up behind healthcare.

What is the seasonal pattern for S&P 500 Healthcare Sector SPDR (XLV)?
S&P 500 Healthcare Sector SPDR has risen in 6 of 6 midterm-year windows starting around Jul 11, with an average gain of 9.18% in winning years.
- 6-for-6 record in this 155-day midterm-year window, with average gains of 9.18% in winning years.
- Percent Profitable is 100%, with 6 winners and 0 losers across the last six midterm election years.
- The trade direction is long, aligning with a cumulative return of 69% across all six historical windows.
- Average winner gains of about 9% come with a TradeWave Ratio of 3.09, indicating meaningful travel in the trade direction inside the window.
- Intraperiod swings have been real: the worst year saw a drawdown of about 11.92% from entry before finishing higher, while strong years posted double-digit peak run-ups.
- A Sharpe ratio of 3.88 for this pattern points to unusually consistent risk-adjusted performance in this specific slice of the midterm election year.
According to historical data from TradeWave.ai, this midterm-year stretch has behaved very differently from an average half-year for XLV. The next section walks through how that pattern has played out and where the risk has tended to cluster.
How has S&P 500 Healthcare Sector SPDR (XLV) traded in this midterm-year window?
S&P 500 Healthcare Sector SPDR has posted gains in every one of the last six midterm election years during the 155-day window that begins around Jul 11, averaging 9.18% per cycle. Today’s price is hovering near the upper end of its 12‑month range, with XLV up 9.93% over the past month and trading not far from its 52‑week high of 161.25. That combination of a clean seasonal track record and a strong recent ramp gives this upcoming window extra weight for traders trying to time healthcare exposure.
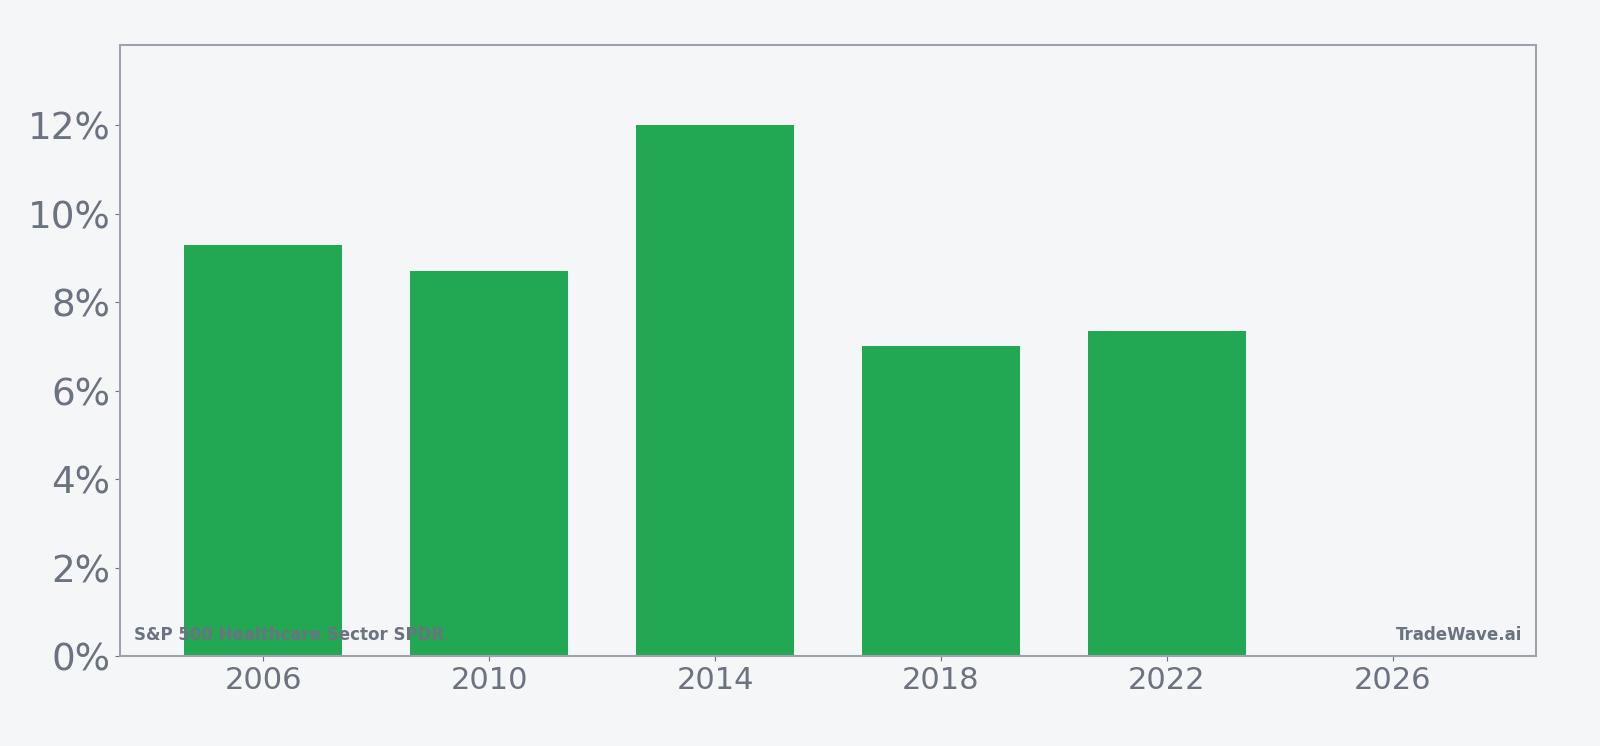
Grouping the data by the presidential election cycle matters here because this window sits in the heart of the midterm election year, a phase that often features policy noise early on and a more constructive risk backdrop as markets look ahead to the pre-election year. XLV’s pattern is drawn from the last six midterm election years, so each data point reflects how healthcare traded in this same calendar slice of those cycles, not six consecutive calendar years.
Across those six midterm years, the trade direction is firmly long. Percent Profitable is 100%, with 6 winners and 0 losers, and the cumulative return across all windows is 69%. Average profit of 9.18% lines up closely with the 9.0% median, which tells you the wins have been relatively clustered rather than driven by a single outlier year.
The per-year table shows how that plays out. In 2014, XLV gained 12.02% in this window, with a maximum favorable move of 16.33% from entry before settling back, while the weakest net year in this sample, 2018, still delivered a 7.01% gain. Even 2002, a difficult backdrop for equities, saw XLV rise 10.72% in this stretch, though it endured a maximum adverse move of 11.92% along the way.
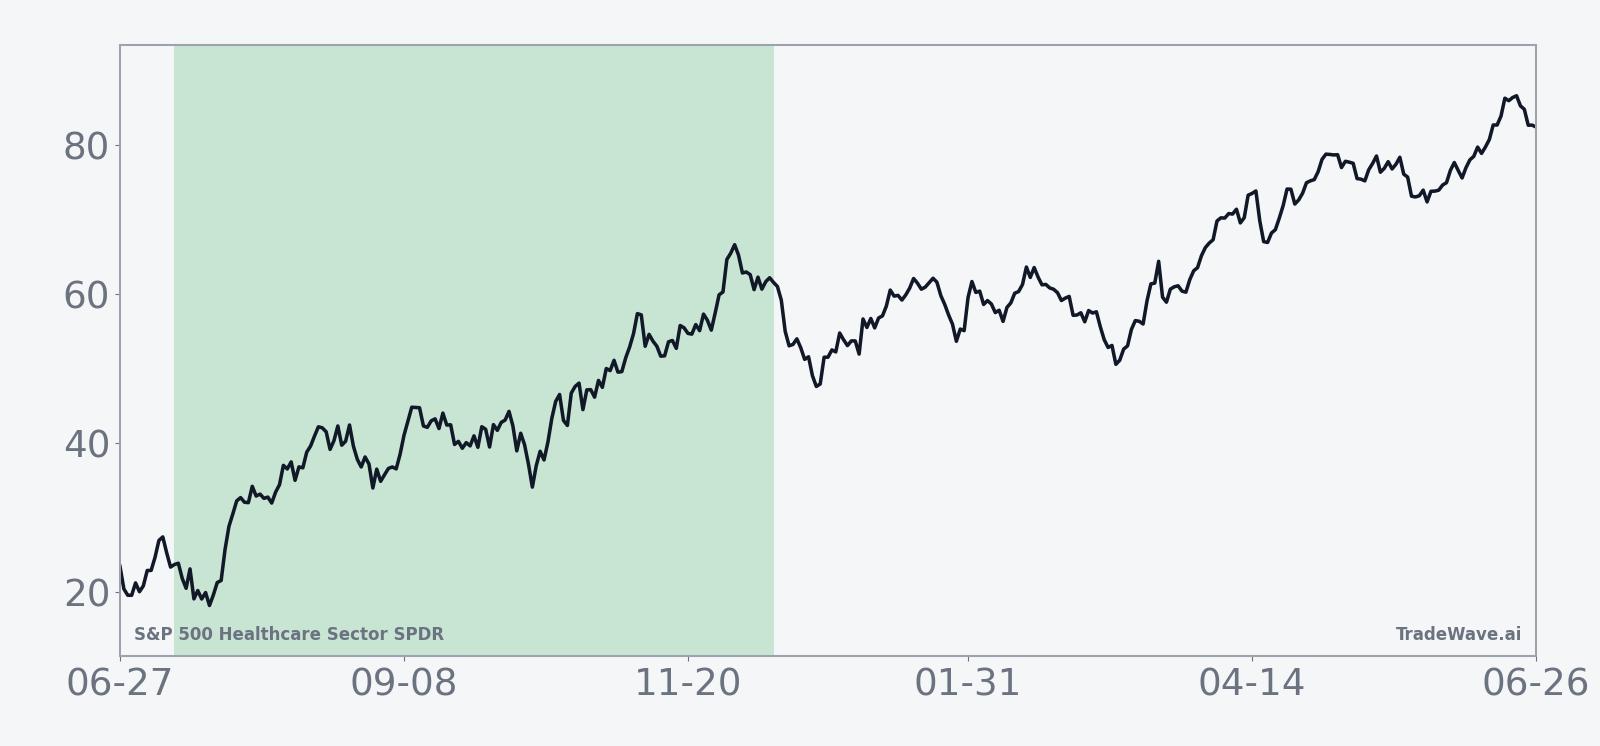
The historical seasonal trend chart shows a fairly steady upward slope rather than a front-loaded spike or back-end surge. That suggests gains have tended to accrue gradually across the 155 days, with only modest pauses, which is consistent with a long, grinding healthcare bid rather than a single event-driven pop.
The combined net, best-case, and worst-case moves by year highlight how much XLV has typically swung inside this window before settling at its final result.
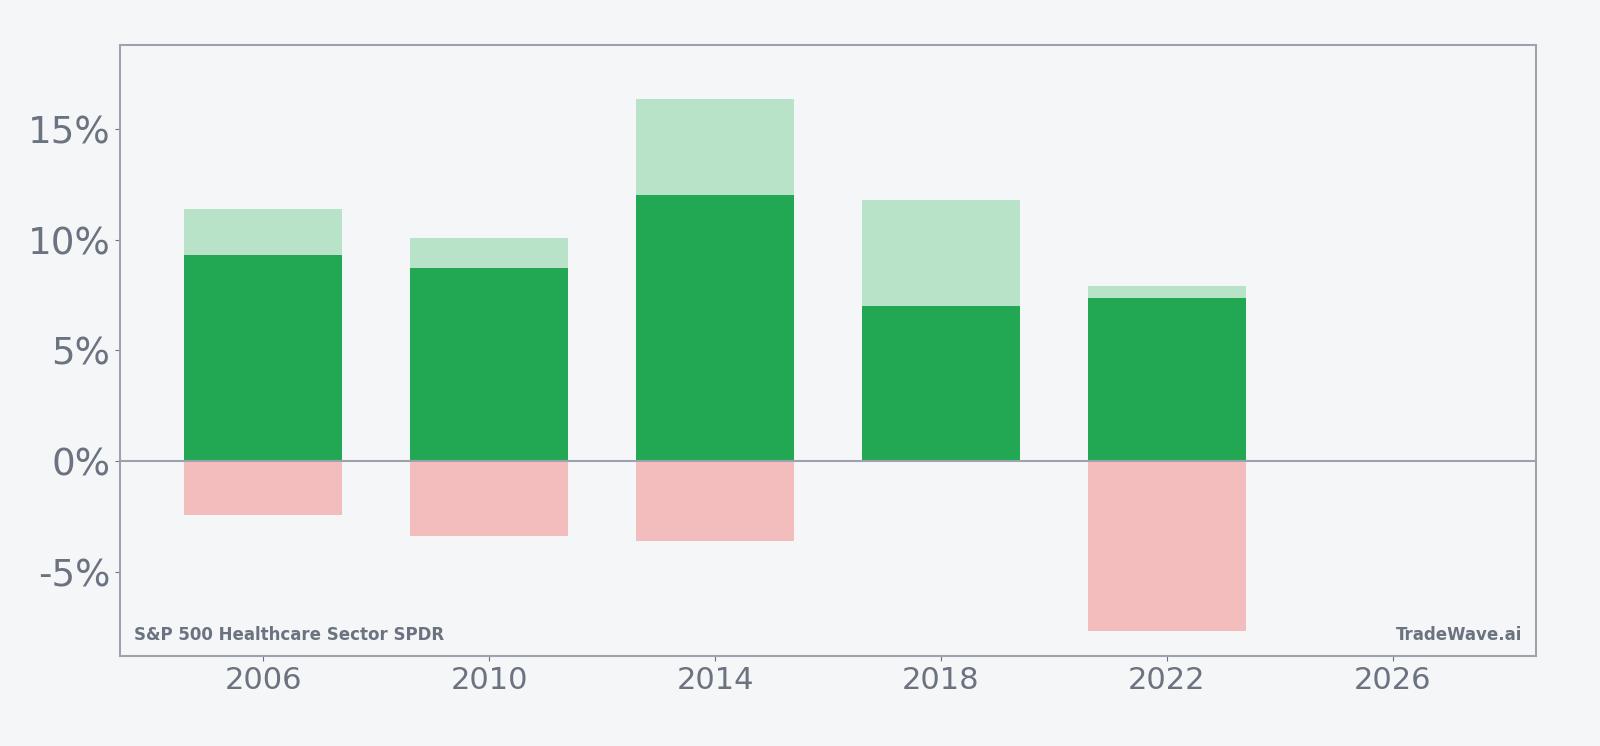
Those bars make the volatility profile clear. In strong years like 2014, XLV’s maximum favorable excursion reached 16.33%, while the worst drawdown from entry was limited to about 3.58%. In more volatile setups such as 2002 and 2022, the ETF still finished higher by 10.72% and 7.36% respectively, but only after weathering adverse moves of 11.92% and 7.65% inside the window. For a long pattern, that mix of sizable upside potential and non-trivial downside swings is exactly what the TradeWave Ratio of 3.09 and Sharpe ratio of 3.88 are flagging.
History does not guarantee future results; adverse excursions (MAE) can be large even in winning windows, and traders can still be wrong-footed inside a historically strong seasonal stretch.
Why does S&P 500 Healthcare Sector SPDR (XLV) follow this seasonal pattern?
One likely driver is the way healthcare earnings and policy headlines cluster in the back half of the midterm election year, when Washington often shifts from early-cycle legislative fights to positioning ahead of the next presidential race. That can encourage institutional portfolio rotation into defensive growth sectors like healthcare as investors look for stability with some upside. The pattern may also reflect index rebalancing and asset-allocation shifts as managers lean into sectors that historically hold up well when macro uncertainty is high but the pre-election year, which has often been strong for equities, is coming into view.
What is driving S&P 500 Healthcare Sector SPDR (XLV) today?
XLV has been in a firm uptrend into early July, rising 9.93% over the past month and trading close to its 52‑week high of 161.25 on solid volume, with 20‑day average turnover around 11.6 million shares. Sector specialists point to a textbook bottoming and breakout pattern since the August low, with constructive consolidations before each leg higher, leaving the ETF roughly 25% above that trough and reinforcing healthcare’s role as a leadership group in the current market rotation.[1] On Jun 5, options traders leaned heavily into calls, with roughly 5,300 calls trading versus about 1,000 puts and around $11 million of $13 million in notional tied to bullish contracts, a skew that signaled aggressive positioning for further upside in the S&P 500 Healthcare Sector SPDR rather than hedging.[1]
The chart below shows XLV’s 12‑month climb alongside a 60‑day seasonal projection, putting the recent breakout and options activity in the context of the historical midterm-year pattern.
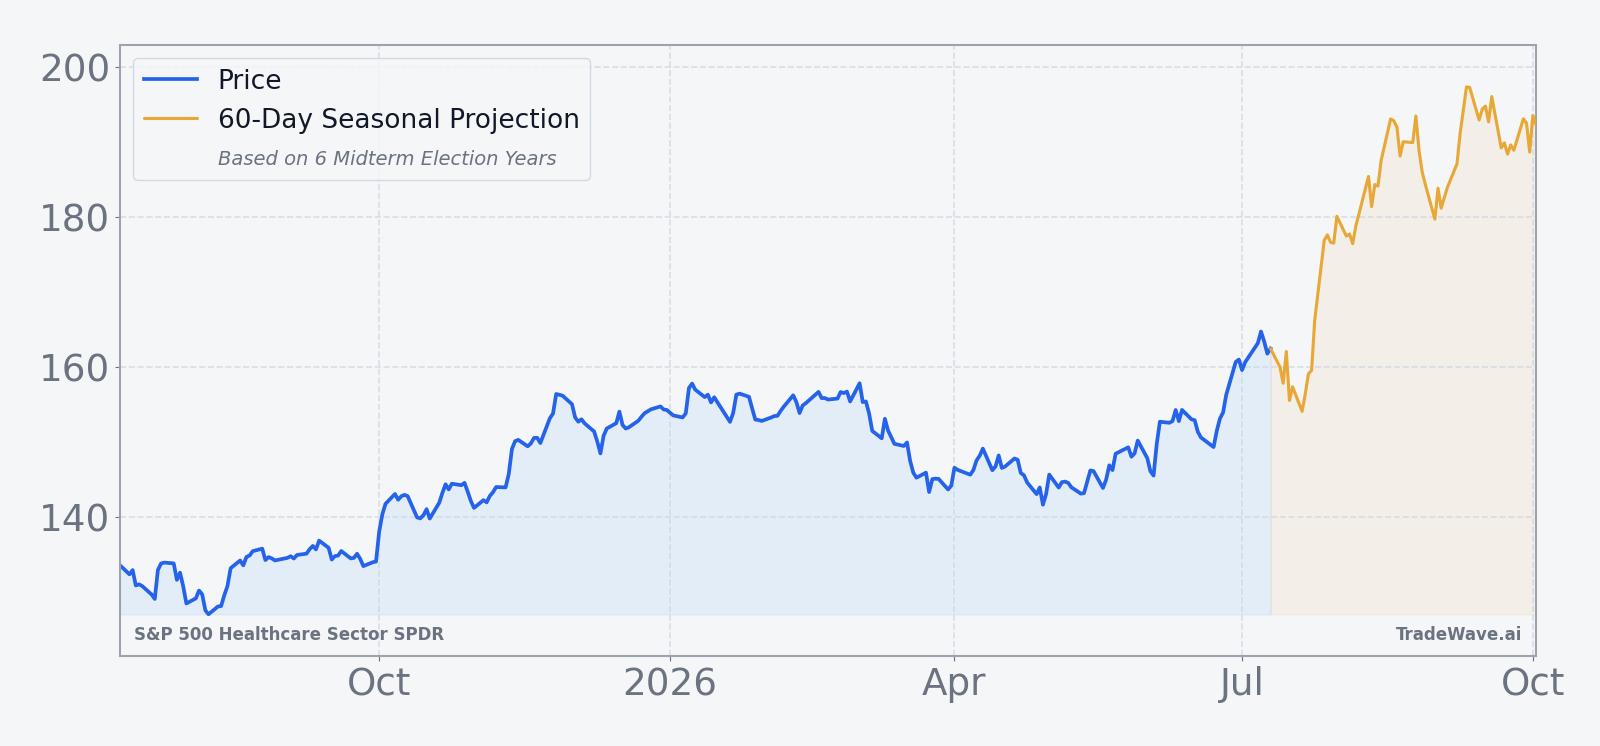
Healthcare’s leadership has also shown up at the index level. In August 2025, Reuters reported that healthcare stocks led S&P 500 sector gains on a day when the broader market hovered near record highs, underscoring how capital has rotated toward the group when investors expect rate cuts and seek more defensive growth exposure.[1] That backdrop helps explain why XLV’s current strength and the upcoming historically bullish seasonal window matter for broader risk sentiment, not just for sector specialists.
What should traders watch as this XLV seasonal window unfolds?
The first marker is timing. The 155‑day window tied to the last six midterm election years begins on Jul 11 and runs deep into the calendar, so traders will be watching whether XLV can hold above its 50‑day moving average of 148.16 and stay within striking distance of the 52‑week high as the window opens. A pattern of shallow pullbacks that respect that moving average would rhyme with prior cycles where gains built steadily rather than in a single burst.
Options flow is the second key tell. The early June session that saw about 5,300 calls trade against roughly 1,000 puts, with the bulk of notional tied to bullish contracts, marked a clear Special Insight into positioning.[1] If that call-heavy skew persists or even intensifies as the seasonal window progresses, it would signal that institutional players are leaning into the historical pattern; a sharp reversal toward put buying or light overall volume would suggest the opposite and could leave XLV more vulnerable to the kind of intraperiod drawdowns that showed up in 2002 and 2022.
Finally, macro and policy catalysts will shape how this midterm-year pattern interacts with reality. Any shift in expectations for rate cuts, changes in healthcare regulation, or surprises in sector earnings could either reinforce the historical tendency toward steady gains or trigger the kind of adverse excursions that have punctuated even winning years. For traders, the playbook is less about assuming a 7% to 12% rally and more about tracking whether price, volume, and options behavior inside the window look like prior midterm-year runs or start to diverge from the script.
Sources
About this seasonal analysis
Seasonal pattern data is sourced from TradeWave.ai, which analyzes historical price behavior across annual calendar windows going back up to 30 years. Read the full data methodology or the book The 100-Year Pattern by Afshin Moshrefi (2026 edition). Past performance of seasonal patterns does not guarantee future results. This article is for informational purposes only and does not constitute investment advice.