S&P 500 Financials Sector SPDR (XLF) Has Rallied in All 6 Midterm Windows Since 2002
S&P 500 Financials Sector SPDR is about to enter a 364-day midterm-election-year seasonal window that has never posted a loss in the last six cycles, giving traders a rare long-term pattern to weigh against today’s financials backdrop.

What is the seasonal pattern for S&P 500 Financials Sector SPDR (XLF)?
S&P 500 Financials Sector SPDR has risen in 6 of 6 midterm-election-year windows starting in early July, with an average gain of 10.33% in winning years.
- Six for six record: XLF has logged gains in every one of the last 6 midterm-year windows starting in early July, averaging 10.33% in those winning years.
- The upcoming window begins Jul 3, 2026 and runs 364 calendar days, spanning the back half of the midterm election year into the following pre-election year.
- Percent Profitable sits at 100%, with 6 winners and 0 losers across this election-cycle slice.
- Individual years have ranged from a 5.6% gain in 2002 to a 16.32% gain in 2010, showing a consistently positive but varied payoff profile.
- Intraperiod swings have been meaningful, with some years seeing double-digit peak run-ups and double-digit drawdowns before finishing higher.
- For a long-only financials allocation, this specific midterm-year trading window has historically been one of the most reliable stretches on the calendar.
According to historical data from TradeWave.ai, this midterm-year window in XLF behaves very differently from an average year, with a distinct pattern tied to the presidential election cycle rather than the simple calendar.
How has S&P 500 Financials Sector SPDR (XLF) traded in this midterm-year window?
S&P 500 Financials Sector SPDR has risen in all 6 midterm-election-year windows that start in early July and run roughly a year, posting an average gain of 10.33% for long positions. The next iteration of this 364-day trading window opens on Jul 3, 2026, catching financials as the market moves from the middle of the midterm election year toward the stronger pre-election phase. That combination of a clean win streak and a long regime that straddles two political years makes this one of the more unusual seasonal patterns on the XLF calendar.
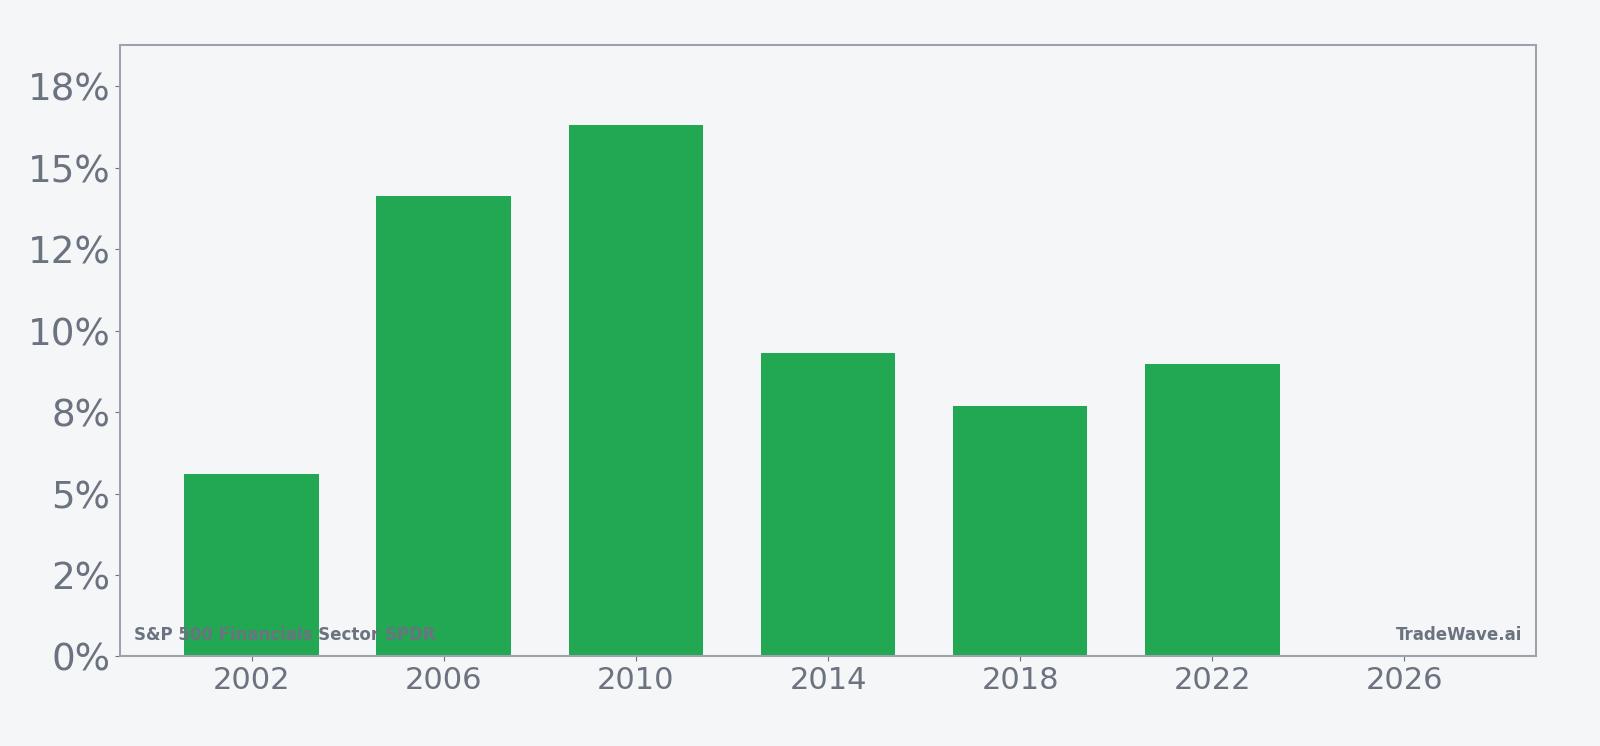
Because this pattern is grouped by presidential election cycle, it only looks at midterm-election years, not every calendar year. That matters for financials, which tend to be sensitive to regulation, fiscal policy and rate expectations that often shift in the middle of a presidential term. In this slice of history, a long XLF position held from early July of the midterm year through late June of the following pre-election year has never finished in the red.
The strongest outcome in the sample came in 2010, when XLF gained 16.32% over the window, with a maximum favorable move of 27.21% from the entry price before giving some of that back by the exit. The softest win was 2002, which still delivered a 5.6% gain despite a deep maximum drawdown of 22.53% at one point during the trade. That spread shows how the same bullish seasonal tendency can play out very differently depending on the macro backdrop and volatility regime.
Other years sit between those extremes. In 2006, XLF advanced 14.12% with a peak run-up of 18.66% and a relatively shallow worst drawdown of 3.91%. In 2014, the ETF gained 9.3% while experiencing a maximum adverse move of 6.08%, and in 2018 it rose 7.69% with a 10.0% peak rally but a 15.84% intraperiod drawdown. The most recent midterm-year sample, 2022, saw an 8.97% gain, a maximum favorable excursion of 18.16% and a worst drawdown of 6.37%.
Put together, those six years produce a cumulative return of 79% for the pattern and an annualized return of 10.27% for the long strategy. The Sharpe ratio of 1.56 points to a relatively strong risk-adjusted profile based on end-of-window outcomes, even though the path inside each year could be bumpy. For traders, the message is that this has historically been a “stay with it” window for financials rather than a quick swing-trade setup.
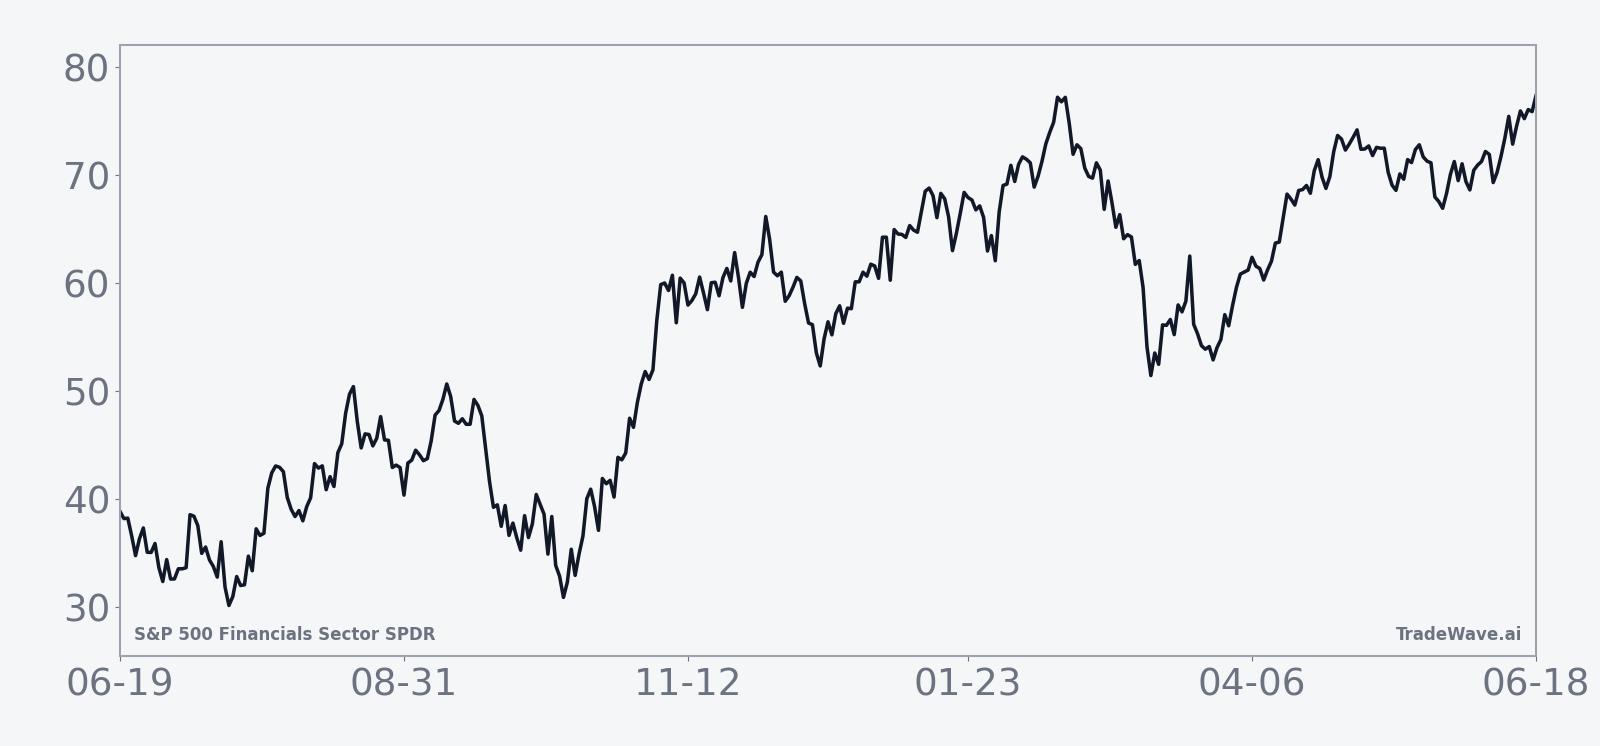
The historical seasonal average suggests that gains in this window tend to build gradually rather than in a single burst. The curve climbs over the full 364 calendar days, with periods of consolidation and pullback but a clear upward bias from entry to exit. That fits the idea of a long regime that spans both the latter half of the midterm year and the early part of the pre-election year, when risk appetite has often improved.
Year-by-year bars that include both peak rallies and worst drawdowns show how much room XLF has historically had to run and to wobble inside this window.
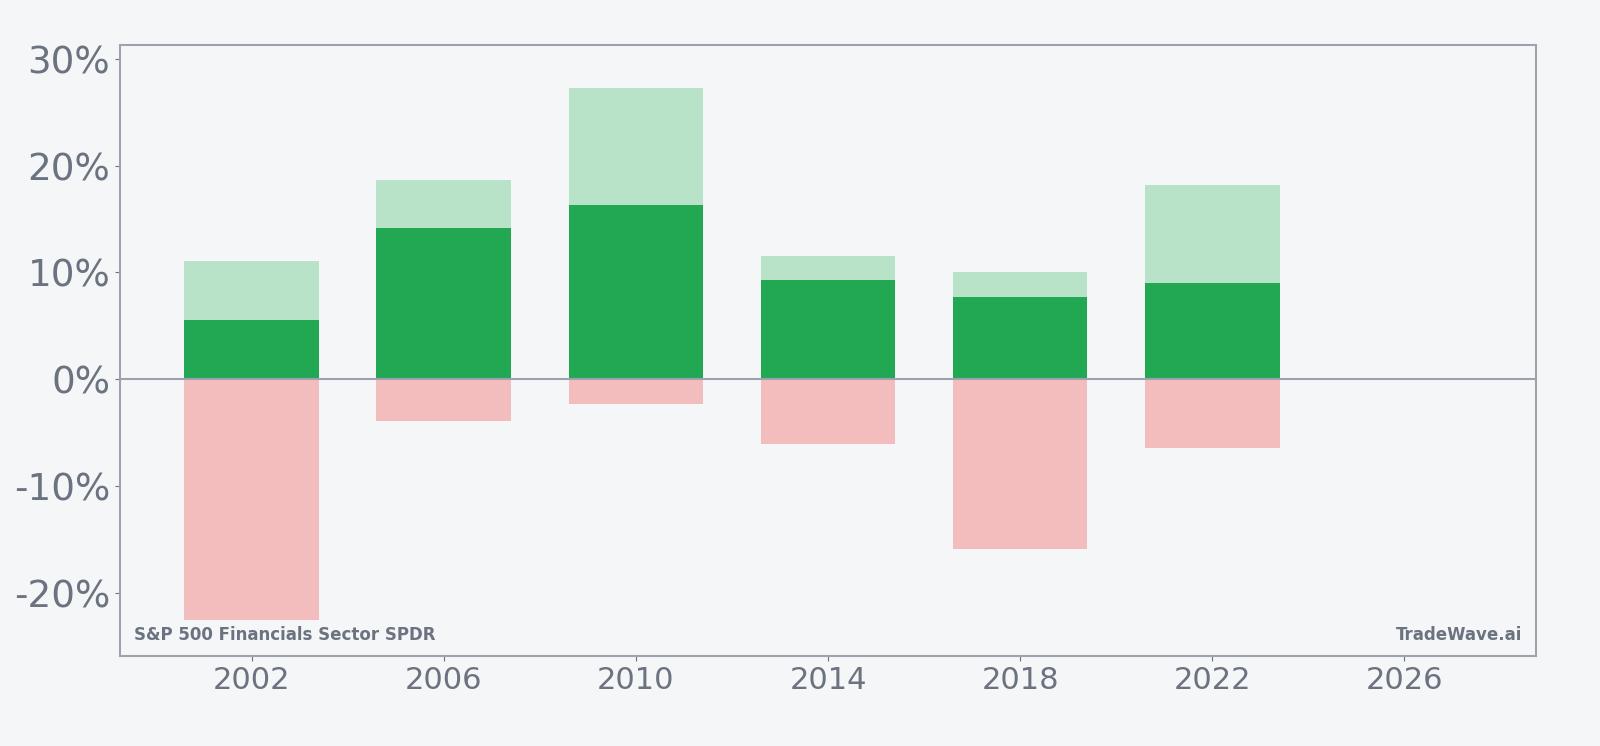
The combined net/MFE/MAE bars underline that this has been a high-conviction but not low-volatility pattern. In several years, XLF’s best point-to-peak move inside the window ran well into double digits, while the worst drawdowns also reached into the mid-teens or beyond. Large maximum favorable excursions paired with meaningful maximum adverse excursions mean the window has offered both strong upside opportunity and real downside risk along the way.
History does not guarantee future results; adverse excursions can be large even in winning windows, and traders should size positions with that path risk in mind.
Why does S&P 500 Financials Sector SPDR (XLF) follow this seasonal pattern?
One likely driver is the way the presidential election cycle shapes policy expectations for banks and insurers. Midterm years often bring regulatory noise and rate uncertainty in the first half, followed by clearer guidance and, at times, friendlier fiscal or credit conditions as the cycle shifts toward the pre-election year. This pattern may also reflect institutional portfolio rebalancing and sector rotation into financials as investors position for a more pro-growth stance heading into the next presidential campaign.
What is driving S&P 500 Financials Sector SPDR (XLF) today?
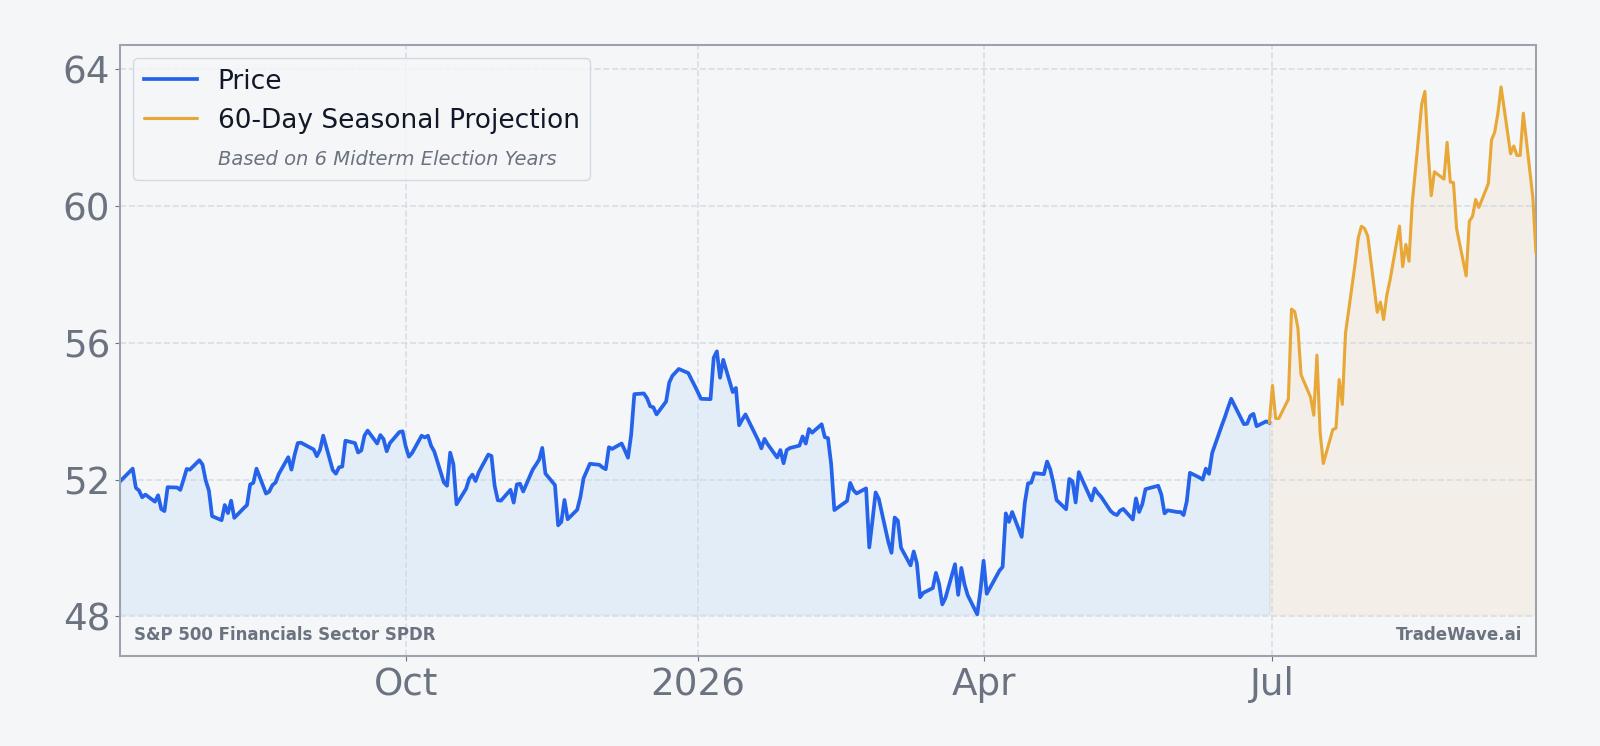
With the prior session’s close marking the latest reference point for XLF, the ETF is trading between its 52-week low of 47.34 and its 52-week high of 55.55, with a 20-day average volume of about 37.5 million shares and a 50-day moving average near 51.89. That places financials in the middle of their recent range just as the calendar flips into the heart of the midterm election year, a phase when sector leadership often rotates and investors reassess exposure to banks, brokers and insurers.
The chart below situates the latest move in its recent multi-month context, alongside a short-term seasonal projection.
What should traders watch as this XLF seasonal window opens?
First, watch how XLF behaves around the Jul 3 start date relative to its 50-day moving average near 51.89. In prior midterm years, some of the best windows began with a period of consolidation or even a modest drawdown before the longer trend higher took hold, so a soft patch early in the window would not automatically contradict the historical pattern.
Second, monitor how financials trade around key policy and economic dates in the back half of the year. The window runs straight through the midterm election and into the following pre-election year, when rate expectations, regulatory rhetoric and credit conditions can all shift. If XLF can hold above its recent range on those catalysts, it would be consistent with the historical tendency for this window to favor long exposure.
Third, keep an eye on intraperiod volatility. Past midterm-year windows have seen maximum adverse moves as deep as the low-20% range in individual years, even when the final outcome was positive. If drawdowns begin to approach those historical extremes without a corresponding pickup in maximum favorable moves, it would signal that this cycle is diverging from the prior pattern.
Finally, for investors who use sector ETFs as macro signals, XLF’s behavior in this window can serve as a read on broader risk appetite. A financials ETF that grinds higher through the midterm election into the pre-election year would fit the historical script of improving conditions for credit and capital markets, while a failure to participate could hint at a different macro playbook this time around.
Sources
About this seasonal analysis
Seasonal pattern data is sourced from TradeWave.ai, which analyzes historical price behavior across annual calendar windows going back up to 30 years. Read the full data methodology or the book The 100-Year Pattern by Afshin Moshrefi (2026 edition). Past performance of seasonal patterns does not guarantee future results. This article is for informational purposes only and does not constitute investment advice.