Nasdaq QQQ Invesco ETF (QQQ) Has Rallied in All 6 Midterm Windows, Averaging 21.45% Gains
Nasdaq QQQ Invesco ETF is stepping into a 360-day midterm-year seasonal regime that has never posted a loss in the last six cycles, even as tech leadership and macro policy remain in flux.
What is the seasonal pattern for Nasdaq QQQ Invesco ETF (QQQ)?
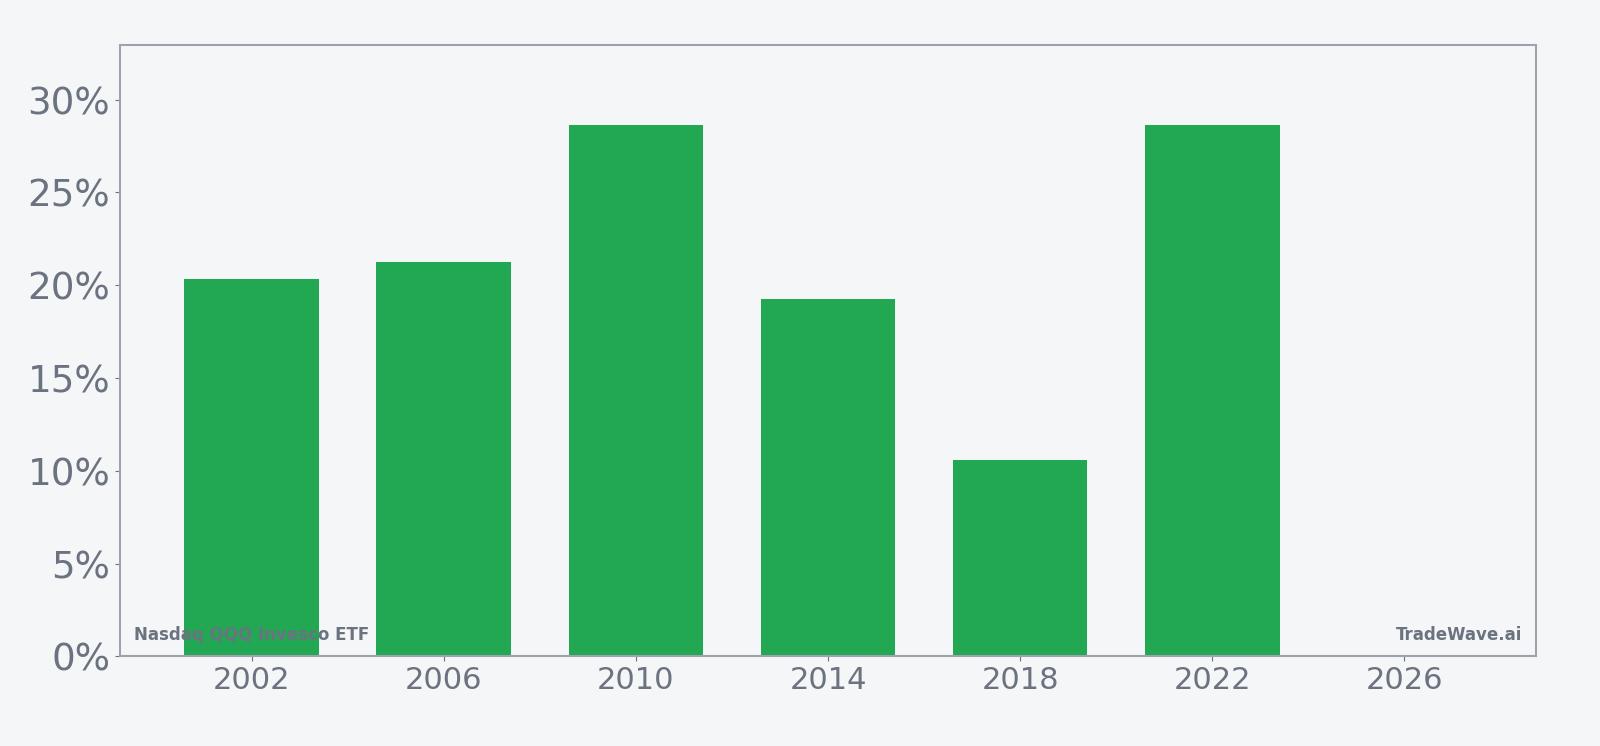
Nasdaq QQQ Invesco ETF has risen in 6 of 6 midterm-year windows starting around Jun 29 and lasting 360 days, with an average gain of 21.45% in winning years.
- 6 for 6 in this window, with winning years averaging 21.45% gains across the last six midterm election years.
- Seasonal window runs from Jun 29 for 360 calendar days, covering the back half of the midterm year and most of the following pre-election year.
- Percent Profitable is 100%, with 6 winners and 0 losers in the historical sample.
- Cumulative return across all six windows totals 218%, with a Sharpe ratio of 2.59 on end-of-window outcomes.
- TradeWave Ratio of 2.35 signals that price has typically traveled meaningfully in the long direction within the window, even before final closes.
- Individual years have still seen sizable drawdowns inside the window, including adverse moves of up to -20.48% before recovering.
According to historical data from TradeWave.ai, this midterm-year stretch in QQQ has behaved very differently from an average calendar year, with a distinct long-biased pattern that many investors overlook.
How strong is the upcoming seasonal window for Nasdaq QQQ Invesco ETF (QQQ)?
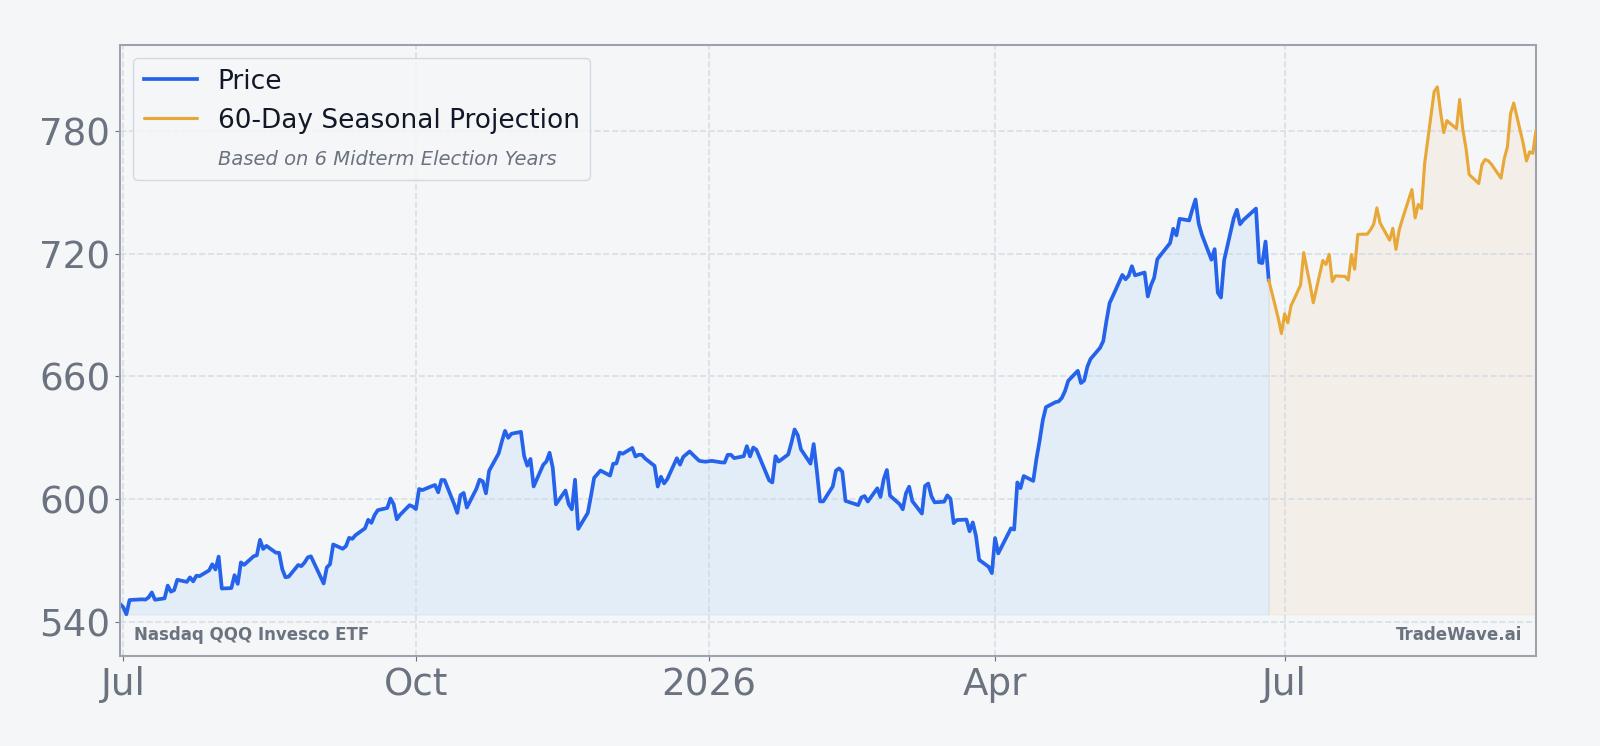
Nasdaq QQQ Invesco ETF has posted gains in all six midterm election years during this 360-day window starting Jun 29, averaging 21.45% in those winning stretches. The new iteration of the window begins today, with QQQ trading between its 52-week low of 536.34 and high of 747.00 over the past year, and coming off a one-month decline of 3.74% that has cooled some of the ETF’s earlier momentum. That combination of a flawless midterm-year track record and a modest recent pullback sets up a high-stakes test of whether the historical QQQ seasonal trend can reassert itself against a more cautious tape.
The presidential election cycle matters here because this window is defined specifically by midterm election years, which often feature policy uncertainty early in the year followed by a more constructive backdrop as the calendar rolls toward the pre-election year. In this case, the 360-day stretch from late June of the midterm year into the following year before the presidential election has historically lined up with a friendlier environment for large-cap growth and tech, sectors that dominate QQQ.
Across the six midterm election years in the sample, QQQ’s seasonal pattern in this window has been unambiguously long-biased. Percent Profitable is 100%, with 6 winners and 0 losers, and the cumulative return across those windows is 218%. Average profit of 21.45% means that in a typical winning year, a long position held from late June of the midterm year through most of the following pre-election year captured a move on the order of one-fifth higher.
The per-year breakdown shows how that strength has played out. The weakest net outcome was still a gain of 10.57% in 2018, while the strongest years, 2010 and 2022, delivered net returns of 28.62% and 28.66% respectively. Even 2002, a difficult year for many tech names, saw QQQ rise 20.36% across this specific midterm-year window.
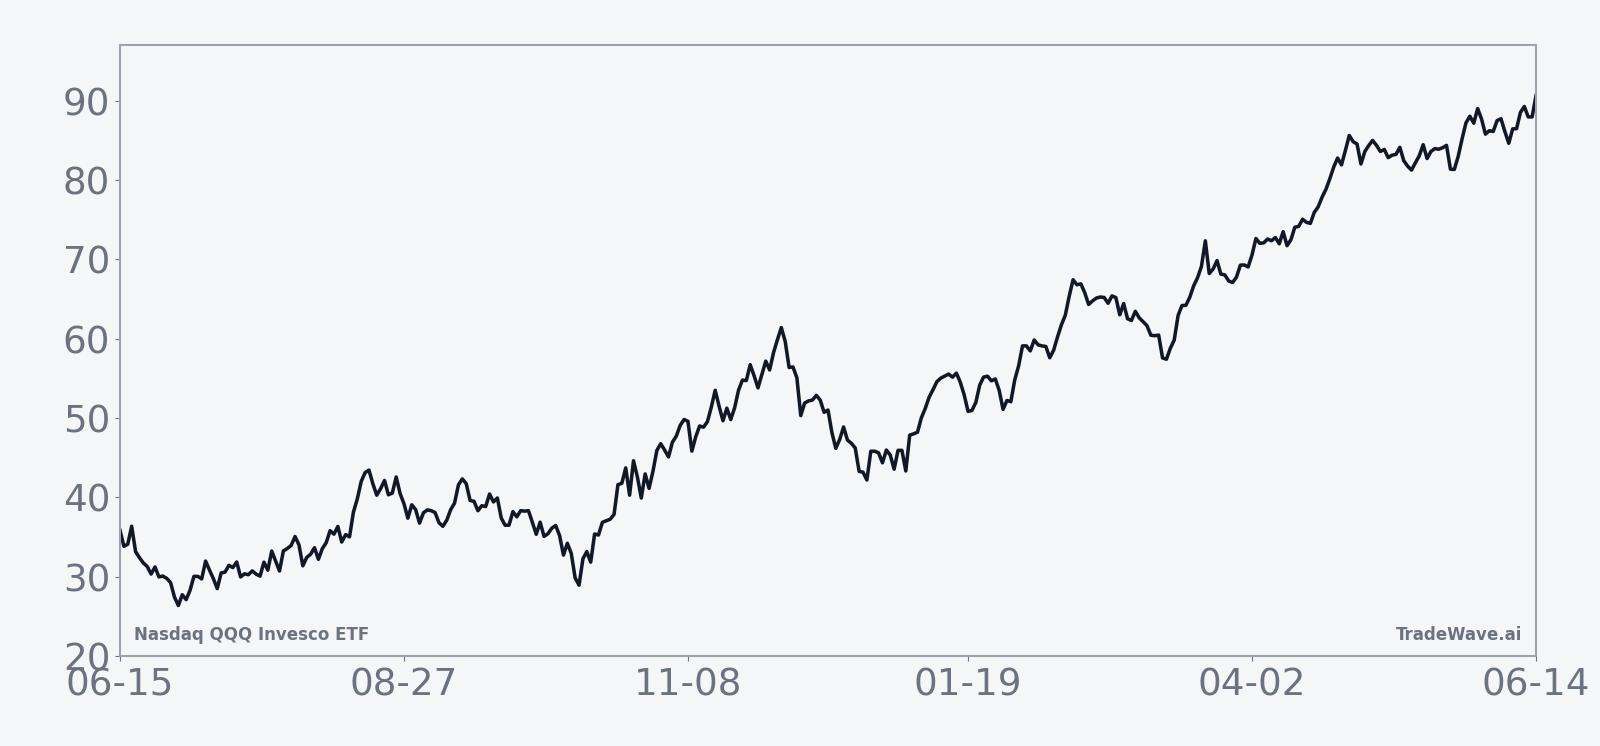
The historical seasonal trend chart suggests that gains have tended to accrue relatively steadily rather than in a single burst. The average path slopes higher across much of the 360-day span, with only modest pauses, which fits the idea that this window straddles the back half of the midterm year and the traditionally stronger pre-election year for equities.
A closer look at yearly net returns and intraperiod swings shows how much QQQ has moved inside the window before finishing higher.
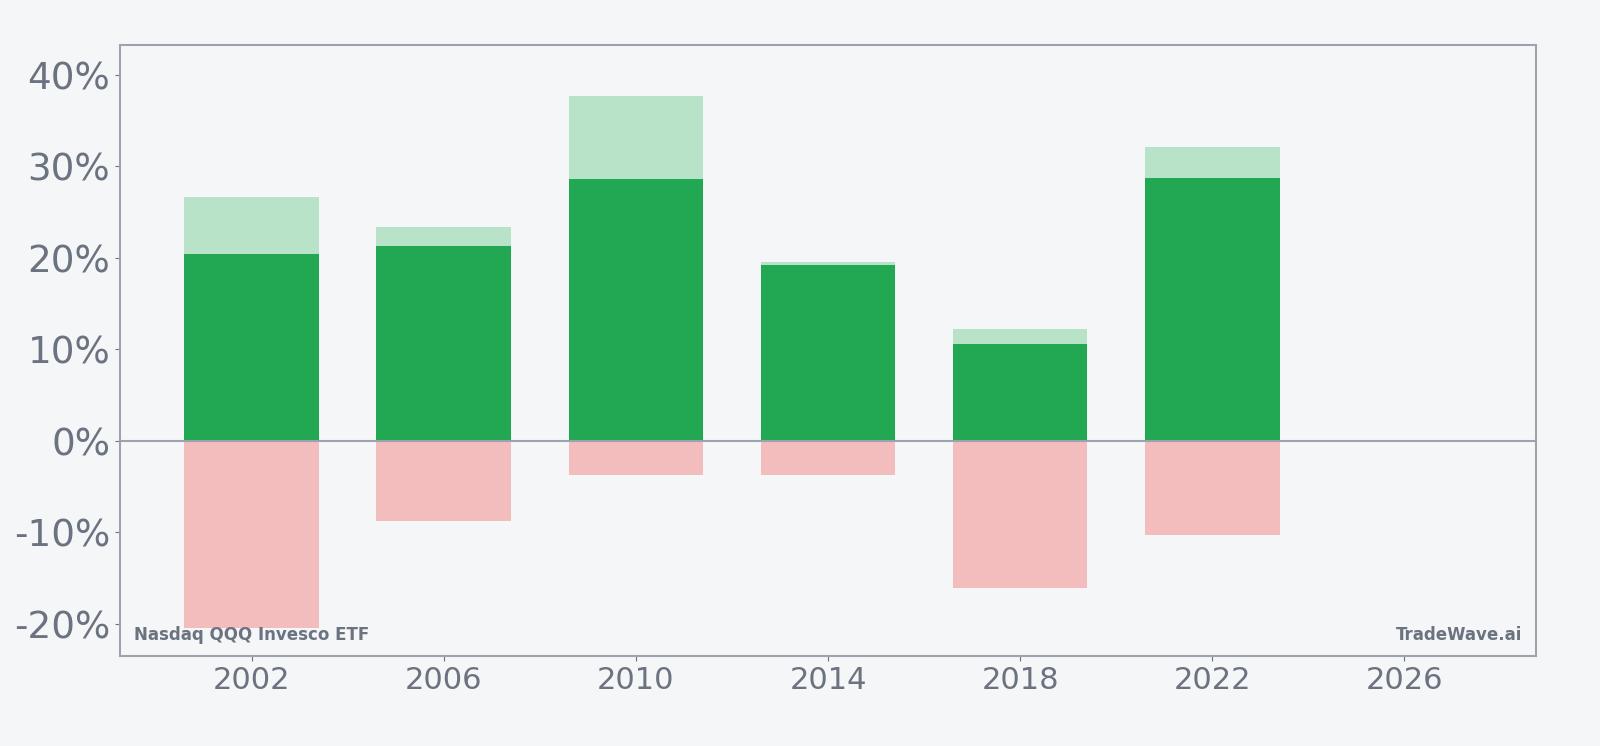
The bars with maximum favorable and adverse excursions underline that the ride has not been smooth, even in winning years. In 2002, QQQ ultimately gained 20.36%, but at one point the ETF was up as much as 26.64% and at another it was down 20.48% from the entry level before recovering. In 2018, the net gain of 10.57% came with a worst intraperiod drawdown of -16.03%, while 2022 saw a best run-up of 32.13% and a temporary setback of -10.25%. That mix of sizable upside potential and meaningful downside swings is consistent with a TradeWave Ratio of 2.35, which indicates that price has typically traveled a substantial distance in the long direction within the window, even if the final close captures only part of that path.
History does not guarantee future results, and the adverse excursions inside this window show that QQQ can experience double-digit drawdowns even in years that ultimately finish higher.
Why does Nasdaq QQQ Invesco ETF (QQQ) follow this seasonal pattern?
One likely driver is the way the policy and earnings calendar lines up in the back half of the midterm year and into the year before the presidential election. Analysts often point to reduced policy uncertainty after midterm votes, combined with a tendency for fiscal and monetary settings to be more supportive as the next presidential race approaches, which can favor growth-heavy benchmarks like QQQ. This pattern may also reflect institutional portfolio repositioning, as large managers lean back into tech and communication services once early midterm-year volatility has passed.
What is driving Nasdaq QQQ Invesco ETF (QQQ) today?
QQQ comes into this new seasonal window after a softer month, with a one-month return of -3.74% that leaves the ETF below its 50-day moving average of 701.40 and between its 52-week low of 536.34 and high of 747.00. Trading volumes remain heavy, with a 20-day average of about 52.5 million shares changing hands, underscoring how central the ETF is to daily positioning in large-cap growth and the broader Nasdaq complex.[1]
Macro headlines in recent weeks have focused less on QQQ-specific catalysts and more on broad market snapshots, where intraday QQQ levels are used as shorthand for tech-led risk appetite.[1] That keeps the ETF at the center of debates over how far the artificial intelligence and mega-cap growth trade can stretch in a midterm election year that still features shifting expectations for interest rates and regulation.
The chart below situates the latest pullback against QQQ’s past year of trading and a short-term seasonal projection.
What should traders watch in this QQQ seasonal window?
First, watch how QQQ behaves around the 50-day moving average near 701.40. In prior midterm-year windows, strong years often saw the ETF reclaim and hold key moving averages early in the stretch, then build on that base as the calendar moved toward the pre-election year.
Second, monitor macro and policy catalysts that could either reinforce or disrupt the historical pattern. Inflation prints, Federal Reserve communication and any shifts in regulatory rhetoric toward large-cap tech will matter more than usual because this window historically overlaps a period when policy uncertainty tends to fade rather than rise.
Third, track volatility and drawdowns inside the window, not just end-point returns. Past cycles show that QQQ can be down 10% to 20% from the entry level at points within the window and still finish the period with double-digit gains, so how the ETF trades through those swings will say a lot about whether the historical QQQ seasonal trend is repeating or breaking.
Finally, because QQQ is a core vehicle for institutional and retail exposure to the Nasdaq 100, any divergence between its price action and the strong midterm-year seasonal record could have broader implications for risk sentiment. If the ETF struggles to regain upside traction despite a historically favorable window, that would be an early sign that the current macro and policy mix is overpowering the usual election-cycle tailwinds.
Sources
About this seasonal analysis
Seasonal pattern data is sourced from TradeWave.ai, which analyzes historical price behavior across annual calendar windows going back up to 30 years. Read the full data methodology or the book The 100-Year Pattern by Afshin Moshrefi (2026 edition). Past performance of seasonal patterns does not guarantee future results. This article is for informational purposes only and does not constitute investment advice.