Nasdaq QQQ Invesco ETF (QQQ) Has Risen in 6 of 6 Midterm Oct-Apr Runs, Averaging 11.57% Gains
Nasdaq QQQ Invesco ETF is approaching a historically strong Oct 25–Apr 26 stretch tied to the midterm election cycle, just as options-driven flows and tech concentration keep volatility elevated.

What is the seasonal pattern for Nasdaq QQQ Invesco ETF (QQQ)?
Nasdaq QQQ Invesco ETF has risen in 6 of 6 midterm-election-year Oct 25–Apr 26 windows, with an average gain of 11.57% in winning years.
- 6 for 6 in this window, with QQQ averaging 11.57% gains across the last six midterm election years.
- The upcoming seasonal window runs from Oct 25, 2026 through Apr 26, 2027, spanning 184 calendar days.
- Percent Profitable is 100.0%, with 6 winners and 0 losers across the historical sample.
- Average profit of 11.57% reflects a long trade direction, with no losing years in the dataset.
- The TradeWave Ratio of 5.37 indicates that price has typically traveled meaningfully in the long direction within the window.
- Individual years have seen sizable intraperiod swings, including adverse moves as deep as about 15.9% before finishing higher.
According to historical data from TradeWave.ai, this midterm-election-year Oct–April stretch has behaved very differently from an average six-month period for QQQ, and the next iteration is about to open.
How has Nasdaq QQQ Invesco ETF (QQQ) traded in the Oct 25–Apr 26 midterm window?
Nasdaq QQQ Invesco ETF has closed higher in every single Oct 25–Apr 26 window across the last six midterm election years, averaging an 11.57% gain for long positions. The ETF most recently exited this pattern on Sep 29, 2026, and will re-enter it on Oct 25 as markets wrap the current midterm election year and pivot toward the historically stronger pre-election phase. That track record makes this tech-heavy seasonal window one of the cleaner bullish regimes in QQQ’s election-cycle history, even as intraperiod drawdowns have sometimes been sharp.
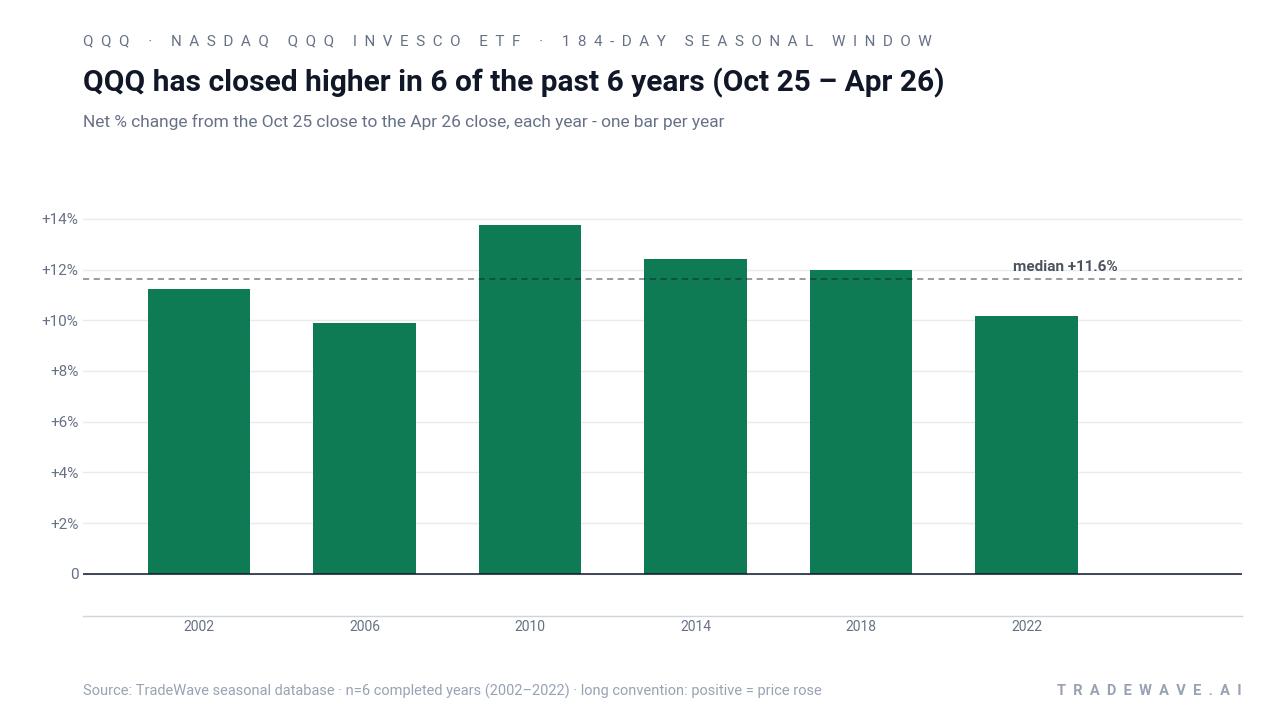
The presidential election cycle matters here because this pattern only looks at the last six midterm election years, then tracks how QQQ behaved from late October into the following spring. That means the results aggregate across 2002, 2006, 2010, 2014, 2018 and 2022, all of which saw the ETF finish this 184-day stretch in positive territory. Grouping by the election cycle rather than by consecutive calendar years isolates how policy uncertainty, rate paths and fiscal debates in midterm years have lined up with QQQ’s tech-heavy profile.
Across those six midterm-year windows, the average gain for long exposure was 11.57%, with a median outcome of 11.61%. The strongest year in the sample was 2010, when QQQ rallied 13.74% between the late-October entry and the late-April exit, while the softest was 2006 with a still-solid 9.91% rise. Add it up and stacking this same window across the six cycles would have compounded to a 92.83% cumulative return.
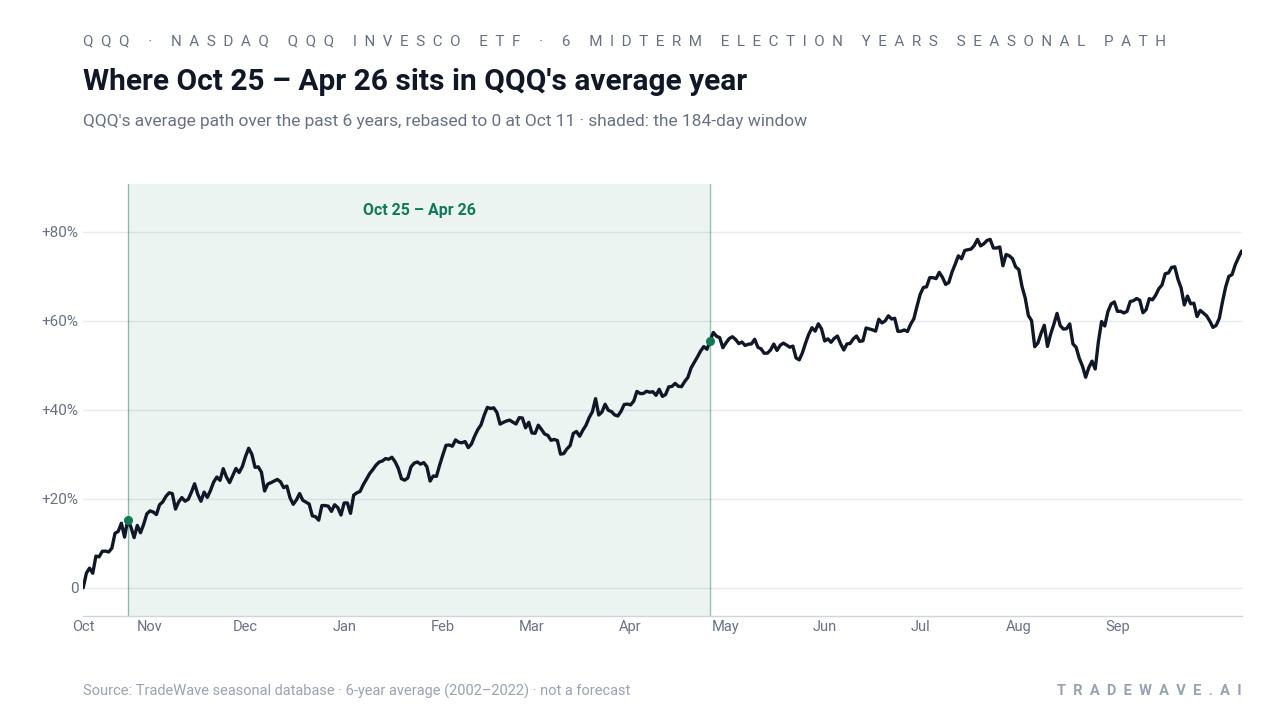
A second view shows how much QQQ has typically swung inside the window before finishing higher.
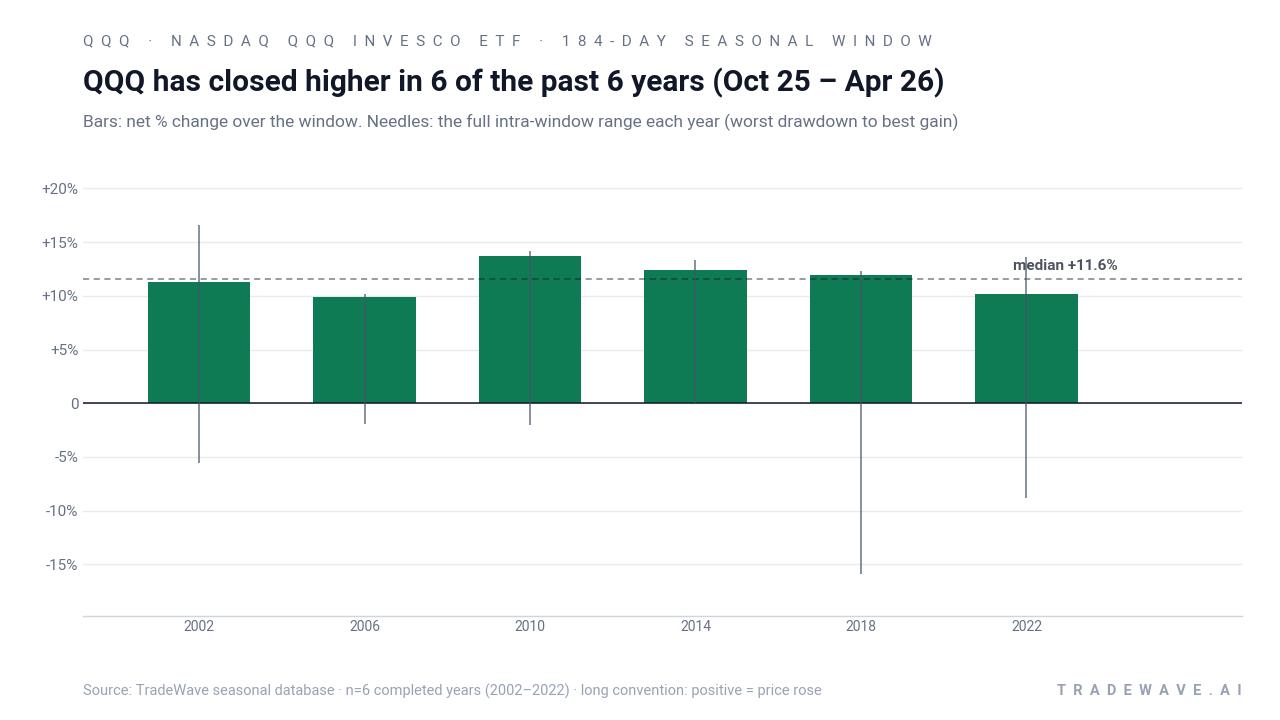
The intraperiod profile has not been a straight line. In 2018, for example, QQQ ultimately gained 11.97% over the window but first suffered a maximum adverse move of about 15.89% from the entry before recovering. In 2022, the ETF’s best run-up within the window reached 13.61% at one point, while the worst drawdown from entry was about 8.84%, underscoring that even “all winner” samples can involve deep swings in both directions.
Across the six midterm-year windows, the maximum favorable move within each period has tended to cluster in the low- to mid-teens, with several years seeing intraperiod rallies of roughly 13% to 16%. That aligns with the long trade direction and the elevated TradeWave Ratio of 5.37, which captures how far price has typically traveled in the long direction during the window. The Sharpe ratio of 6.64, based on end-of-window outcomes, reflects how unusually consistent those positive finishes have been relative to volatility at the close.
Put simply, this has been a bullish seasonal regime for QQQ in midterm election years, with every sampled window finishing higher and several delivering double-digit gains. The catch is that the path has often been bumpy, with adverse excursions that would have tested conviction before the pattern played out.
History does not guarantee future results; adverse excursions (MAE) can be large even in winning windows.
Why does Nasdaq QQQ Invesco ETF (QQQ) follow this seasonal pattern?
One likely driver is the way the tech-heavy Nasdaq-100 responds to the policy and liquidity backdrop as midterm election uncertainty fades and investors start positioning for the pre-election year, which has often been supportive for risk assets. Analysts have also pointed to the clustering of big-cap tech earnings, year-end portfolio rebalancing and early-year guidance as catalysts that can funnel flows into QQQ during this stretch, especially when growth and innovation themes are back in favor.[2]
What is driving Nasdaq QQQ Invesco ETF (QQQ) today?
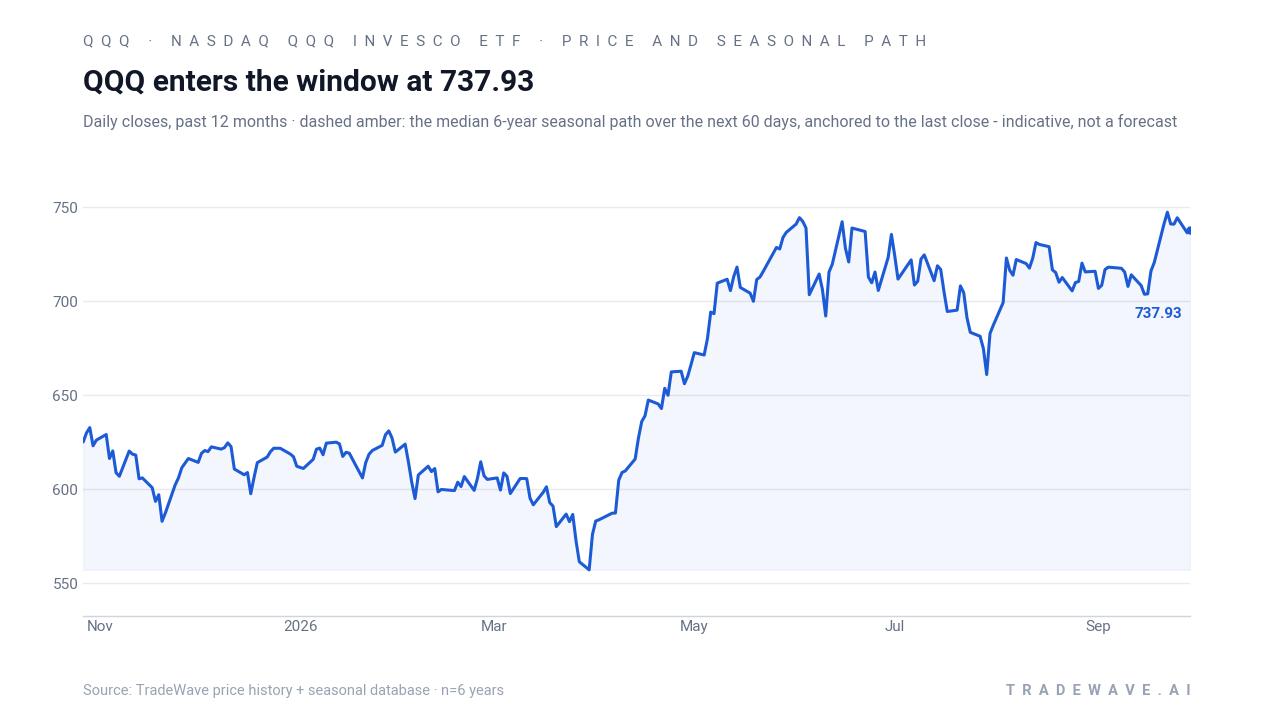
QQQ enters late September with a one-month gain of 3.17%, trading not far from its 52-week high of 748.35 and well above its 52-week low near 553.22. The ETF’s 20-day average volume sits around 33.2 million shares, and price is tracking above its 50-day moving average of roughly 713.04, a setup that keeps the broader trend pointed higher even as intraday swings remain sharp. Options desks have flagged a “gamma flip” in August that pulled QQQ into the center of market-maker hedging flows, meaning large options positioning can amplify moves in either direction when spot price crosses key strikes.[1]
Under the hood, QQQ remains heavily concentrated in mega-cap technology and related growth names, with Nvidia, Apple, Micron, Microsoft and Amazon among its largest holdings as of early July.[2] That concentration has made the ETF more volatile than the S&P 500 in this cycle, and it ties QQQ’s path closely to the earnings and guidance of a handful of dominant companies. In July 2026, Dow Jones Newswires highlighted that the Nasdaq-100’s volatility gap versus the S&P 500 could widen further as SpaceX joins the index, a change that will flow directly into QQQ’s portfolio and could alter its liquidity and sector mix over time.[2]
The chart below situates the latest move in its recent multi-month context alongside a historical seasonal projection.
What should traders watch as the next QQQ seasonal window opens?
First, the calendar. The upcoming Oct 25–Apr 26 window sits at the junction between the concluding midterm election year and the start of the pre-election year, a phase that has historically been friendlier to growth and tech risk. How QQQ behaves around that handoff, especially if it is still hovering near its 52-week high, will show whether this cycle rhymes with the prior six midterm-year patterns or breaks the mold.
Second, options flow. The August “gamma flip” episode showed how quickly QQQ can become the fulcrum of dealer hedging, with options positioning forcing market makers to chase the tape as spot moved through key levels.[1] Traders will be watching whether that dynamic reappears into late October and early November, particularly around major tech earnings clusters and macro events, because persistent options-driven flows could either reinforce or overwhelm the historical seasonal bias.
Third, index composition and concentration. SpaceX’s planned inclusion in the Nasdaq-100, combined with QQQ’s existing tilt toward a handful of mega-cap tech names, means any idiosyncratic shock in those holdings can ripple through the ETF and its seasonal pattern.[2] If volatility in those leaders spikes during the window, it could translate into larger intraperiod swings than the historical averages suggest, even if the end-of-window result remains positive.
Finally, levels. On the upside, traders will focus on how QQQ behaves if it pushes decisively above the prior 52-week high while the seasonal window is open. On the downside, reactions around the 50-day moving average and any pullbacks toward the 52-week low zone will be watched for signs that this cycle is diverging from the six-for-six historical record. A pattern of buying dips within the window would echo prior midterm-year behavior, while sustained weakness through key support would mark a clear break from the historical script.
Sources
About this seasonal analysis
Seasonal pattern data is sourced from TradeWave.ai, which analyzes historical price behavior across annual calendar windows going back up to 30 years. Read the full data methodology or the book The 100-Year Pattern by Afshin Moshrefi (2026 edition). Past performance of seasonal patterns does not guarantee future results. This article is for informational purposes only and does not constitute investment advice.