S&P 500 SPDR (SPY) Has Rallied in 7 of 7 Late-October Midterm Windows, Averaging 5.03%
S&P 500 SPDR is nearing a late-October seasonal window that has never posted a loss in midterm-election years, giving traders a bullish historical backdrop into early December.

What is the seasonal pattern for S&P 500 SPDR (SPY)?
S&P 500 SPDR has risen in 7 of 7 midterm-election-year late-October windows, with an average gain of 5.03% in winning years.
- 7 for 7 in this window, with S&P 500 SPDR averaging 5.03% gains across all winning years from Oct 29 to Dec 2.
- The 35-day window begins Oct 29 and has been a bullish SPY seasonal trend in the last 7 midterm election years.
- Percent Profitable is 100.0%, with 7 winners and 0 losers in the historical sample.
- Average profit in winning years is 5.03%, with a median gain of 5.36% and a cumulative return of 40.85% when the window is stacked.
- The TradeWave Ratio of 2.33 signals that price typically travels meaningfully in the long direction within the window, while the Sharpe ratio of 2.84 reflects strong risk-adjusted returns.
- Intraperiod swings have included worst drawdowns of up to about 4.5% in 2022, so even a strong seasonal edge has come with real downside volatility.
According to historical data from TradeWave.ai, this late-October stretch has behaved very differently from an average month on the calendar for SPY. The next section walks through how that pattern has played out across the last seven midterm election years.
How has S&P 500 SPDR (SPY) traded in the late-October midterm window?
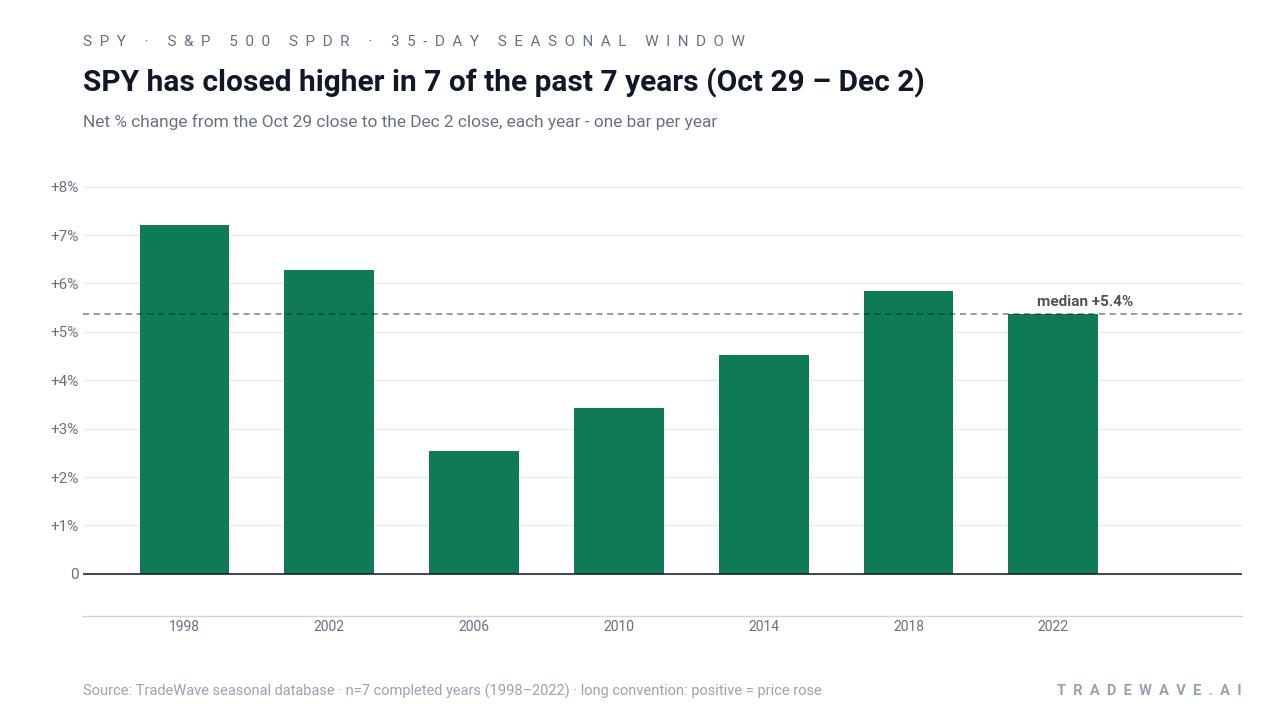
S&P 500 SPDR has closed higher in every single Oct 29 to Dec 2 window across the last seven midterm election years, averaging a 5.03% gain for long positions. The upcoming 35-day stretch begins on Oct 29, just as markets wrap up the midterm election year and pivot toward the historically stronger pre-election year regime. That combination of a clean 7-for-7 record and a transition into a friendlier phase of the presidential cycle makes this SPY seasonal pattern hard for index traders to ignore.
The presidential election cycle matters here because this pattern is built only from midterm election years, a phase that often delivers a powerful late-year rally as policy uncertainty clears and investors start to discount the pre-election year. In this case, the Oct 29 to Dec 2 window also sits inside the broader midterm-to-pre-election “100-Year Pattern” regime, a roughly 295-day span from late September of the midterm year through mid-July of the pre-election year that has historically been unusually strong for the S&P 500.
Across the seven midterm years in the sample, SPY’s average gain of 5.03% in this 35-day window comes with a median profit of 5.36%, suggesting the distribution of outcomes has been tight rather than skewed by a single outlier year. The cumulative return from repeatedly holding only this slice of the calendar compounds to 40.85%, which is a sizable contribution for a period that represents less than 10% of the year. Annualized, the pattern translates to a 5.01% return profile, reflecting both the magnitude of the typical move and the consistency of the wins.
Looking at individual years, 1998 stands out as one of the strongest examples, with SPY gaining 7.2% between Oct 29 and Dec 2 as the maximum favorable move reached 9.43% from the entry. At the other end of the spectrum, 2006 delivered a more modest 2.53% net gain, with a best intraperiod rally of 2.71% and a shallow worst drawdown of 1.59% from the starting level. Even in 2022, a volatile year for equities, SPY still finished the window up 5.36% after enduring an intraperiod drawdown of 4.51%, underscoring that the path can be bumpy even when the final outcome is positive.
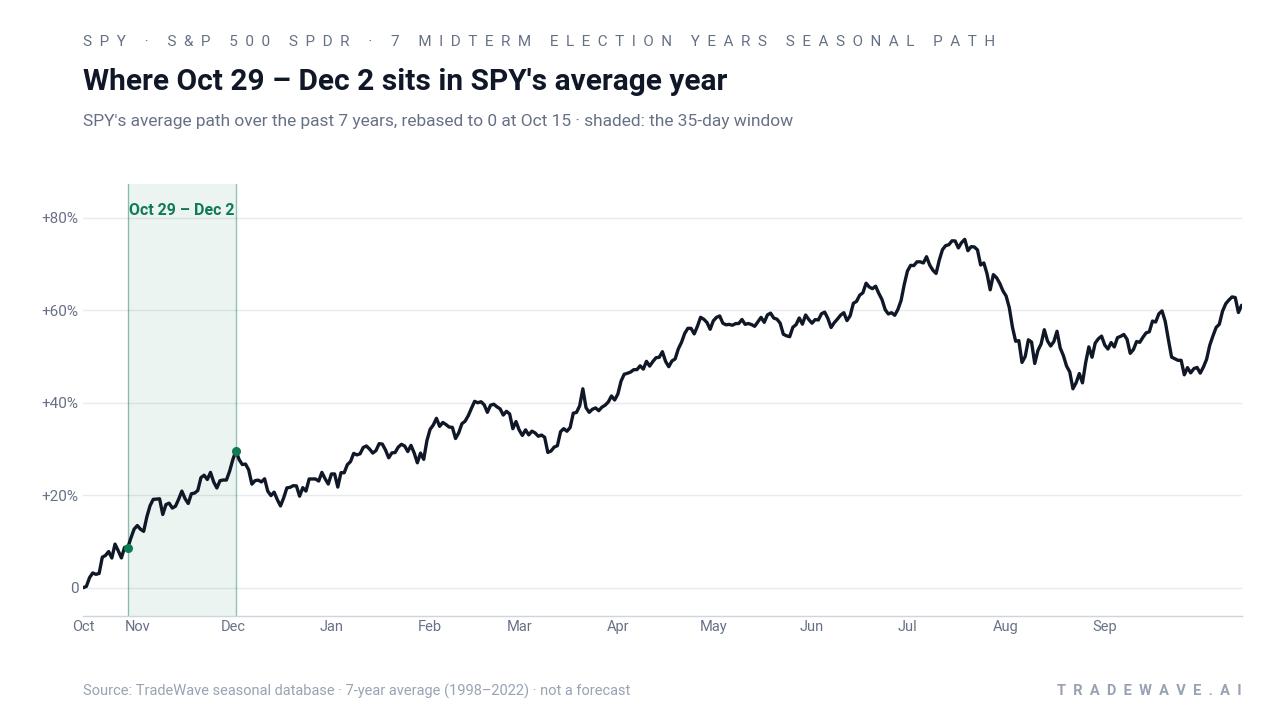
The historical seasonal average shows SPY tending to grind higher into this late-October start date, then accelerating during the 35-day window as year-end positioning and macro clarity build. The curve is not a forecast, but it illustrates how this slice of the calendar has repeatedly lined up with a late-year push in midterm cycles.
Year-by-year ranges show how much SPY has typically swung inside the window before settling at those higher closes.
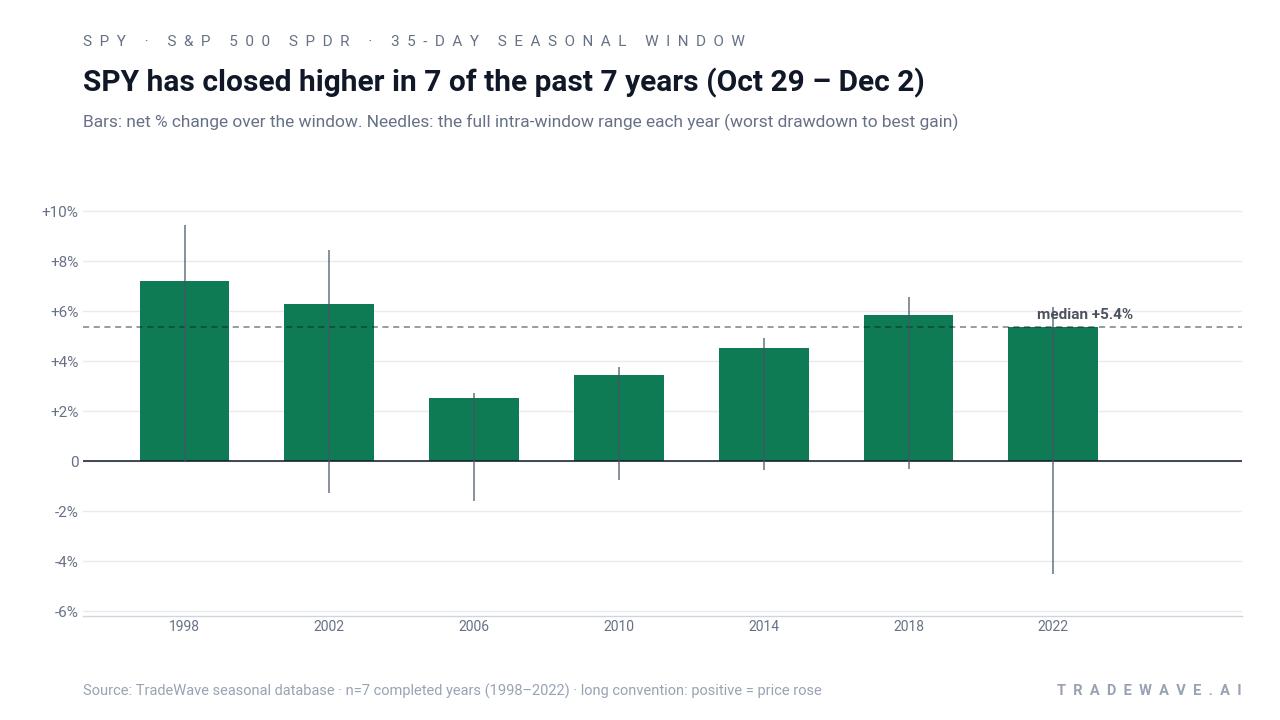
The combined net / maximum favorable / maximum adverse chart makes the trade-off clear: upside excursions have often stretched into the 6% to 9% zone, while the worst intraperiod drawdowns have usually been contained to low single digits, apart from the roughly 4.5% dip in 2022. That profile aligns with the strong TradeWave Ratio of 2.33 and a Sharpe ratio of 2.84, signaling that when this window has moved, it has tended to move in the long direction with relatively efficient use of risk.
History does not guarantee future results; adverse excursions can still be meaningful even in windows where every historical sample finished higher.
Why does S&P 500 SPDR (SPY) follow this seasonal pattern?
One likely driver is the clustering of macro and policy catalysts around the end of the midterm election year, when political uncertainty fades and investors start to price the typically stronger pre-election year. Portfolio managers also tend to rebalance and window-dress into year-end, which can favor large, liquid index vehicles like SPY as they adjust exposure to the S&P 500. This pattern may also reflect sector rotation into growth and technology leaders that dominate the index, especially when earnings visibility improves heading into the new year.
What is driving S&P 500 SPDR (SPY) today?
SPY is trading near the upper end of its 12-month range, with the prior 52-week high at about 775.51 and the low at roughly 622.95, leaving the ETF roughly 19.6% above its trailing-year floor based on the latest seasonal price snapshot. Over the past month, the fund has inched higher by about 0.12%, a modest move that masks the ongoing tug-of-war between AI-fueled enthusiasm in mega-cap tech and lingering concerns about a deeper pullback in 2026 as some strategists warn of an “epic” correction in the S&P 500.[1] At the same time, commentary around continued AI-driven demand from hyperscalers keeps the technology concentration story front and center, reinforcing SPY’s role as the primary vehicle for expressing views on that theme.[1]
The chart below shows how that push-pull has played out over the past year, alongside the indicative seasonal projection for the next two months.
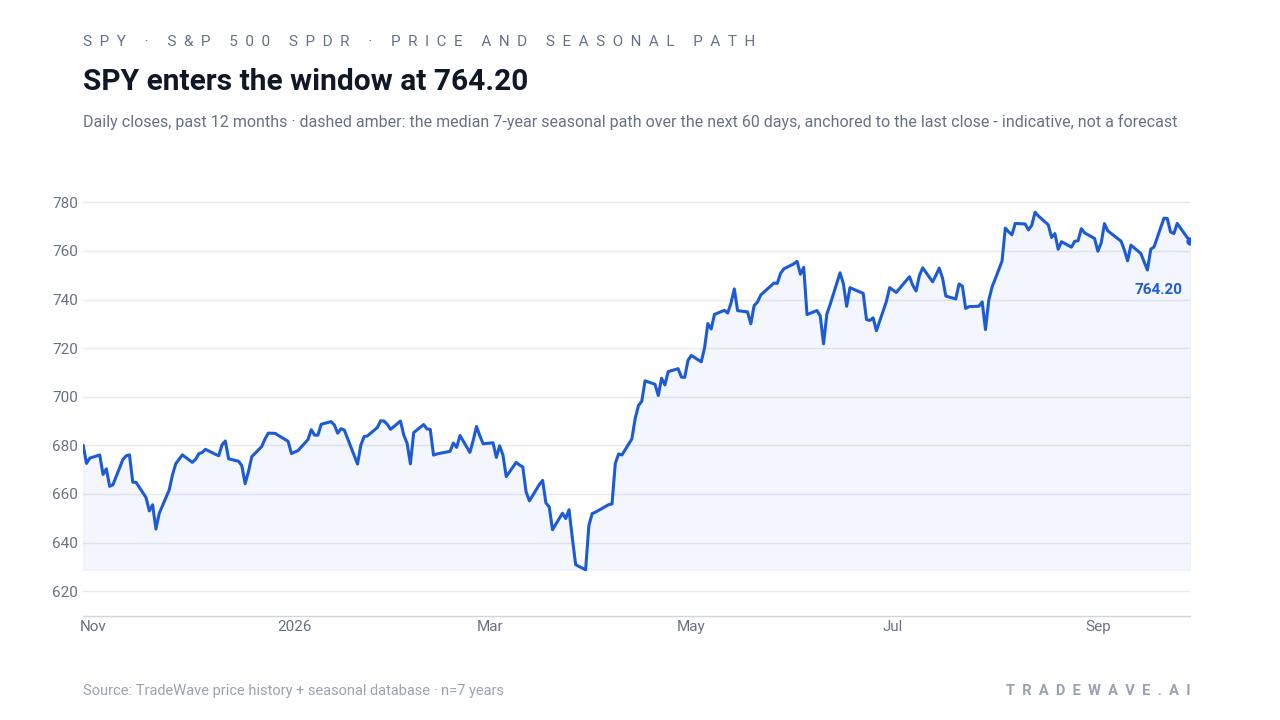
Pattern phase and calendar phase are now aligned: the market is concluding the midterm election year in real time while the seasonal dataset isolates the last seven midterm cycles. That makes this upcoming window a clean test of whether the historical late-year strength can reassert itself against a backdrop of concentrated tech leadership, elevated macro risk scenarios for 2026, and ongoing debate about whether the AI trade has more room to run.[1] For traders who watch stock pattern analysis and SPY seasonal trends, the next few weeks of price action into Oct 29 will set the stage for how much weight to put on that 7-for-7 record.
What should traders watch as this SPY seasonal window approaches?
First, the calendar: the 35-day S&P 500 SPDR trading window from Oct 29 to Dec 2 sits squarely inside the historically strong midterm-to-pre-election regime, so behavior in the days just before the start date will shape how much “fuel” is left for a late-year push. Second, levels and volatility: if SPY enters the window near its recent highs with intraday swings picking up, traders will want to see whether pullbacks stay shallow, in line with most prior midterm samples, or start to resemble the deeper 2022-style drawdown. Third, the macro and policy calendar: any developments that shift expectations around 2026 growth, inflation, or regulation of large-cap tech could either reinforce or blunt the usual seasonal tailwind, given how much of SPY’s weight sits in those names.[1] Finally, watch how closely actual price action tracks or diverges from the historical seasonality path; a strong rally that builds steadily through November would echo the pattern, while a failure to hold gains inside the window would be an early sign that this cycle is breaking from the script.
Sources
About this seasonal analysis
Seasonal pattern data is sourced from TradeWave.ai, which analyzes historical price behavior across annual calendar windows going back up to 30 years. Read the full data methodology or the book The 100-Year Pattern by Afshin Moshrefi (2026 edition). Past performance of seasonal patterns does not guarantee future results. This article is for informational purposes only and does not constitute investment advice.