Russell 2000 Ishares ETF (IWM) Has Risen in 6 of 6 Midterm Fall Windows, Averaging 6.86% Gains
Russell 2000 Ishares ETF is heading into a historically strong 40-day midterm-year window even as the ETF trades below its highs and small caps remain tied to the rate path.
What is the seasonal pattern for Russell 2000 Ishares ETF (IWM)?
Russell 2000 Ishares ETF has risen in 6 of 6 midterm-year fall windows from Oct 24 to Dec 2, with an average gain of 6.86% in winning years.
- 6 for 6 in this window, averaging 6.86% gains in winning years across the last six midterm election cycles.
- Seasonal window runs from Oct 24 through Dec 2, spanning 40 calendar days late in the midterm election year.
- Percent Profitable is 100.0%, with 6 winners and 0 losers in the historical sample.
- Median profit of 5.89% and a Sharpe ratio of 2.3 point to a strong, relatively consistent upside profile.
- TradeWave Ratio of 2.48 indicates that price has typically traveled meaningfully in the long direction within the window, not just at the close.
- Intraperiod swings have included modest drawdowns alongside solid maximum favorable moves, underscoring that gains have not come in a straight line.
According to historical data from TradeWave.ai, this late-October stretch has behaved very differently from an average month for IWM in past midterm election years.
How has Russell 2000 Ishares ETF (IWM) traded in the late-October midterm window?
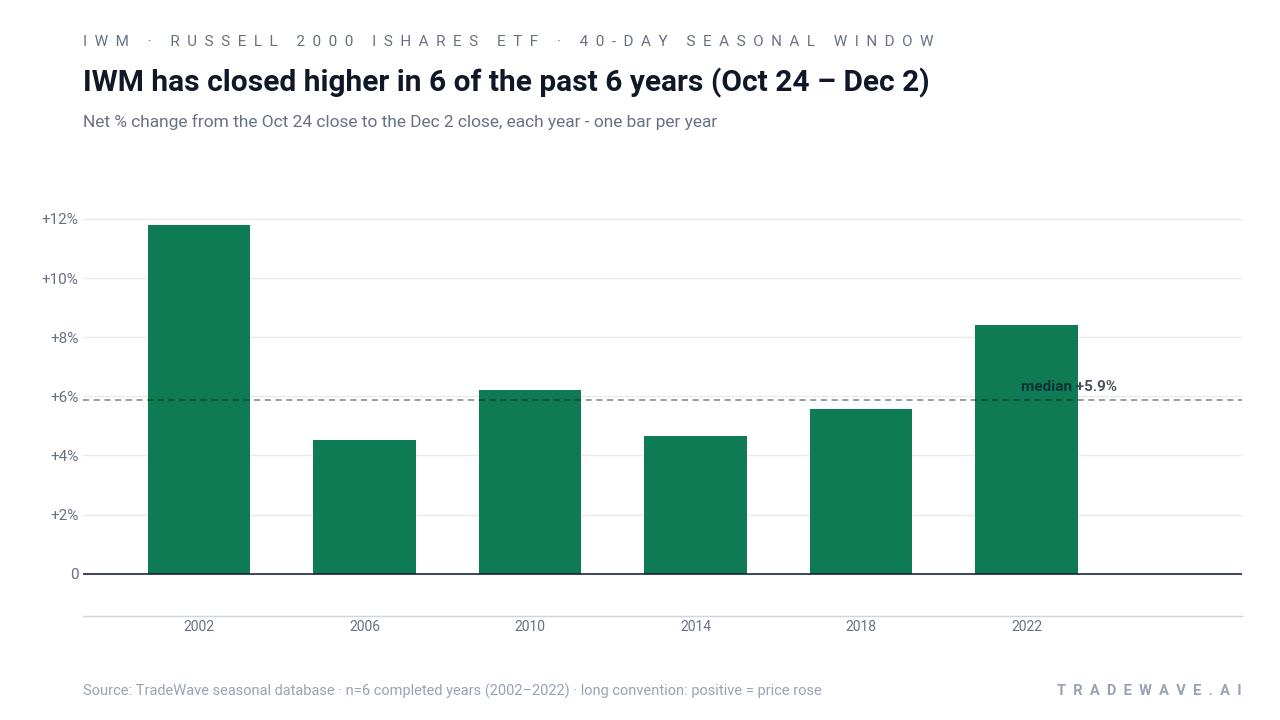
Russell 2000 Ishares ETF has closed higher in every one of the past six midterm election years during the Oct 24 to Dec 2 window, averaging a 6.86% gain. The ETF finished the prior session at 283.92, about 6.4% below its 52-week high of 303.59 and up 15.34% year to date. That combination of a strong historical seasonal trend and a market still shy of its highs is drawing fresh attention to how small caps behave as the midterm year wraps up.
The pattern sits in a specific part of the presidential election cycle: the late portion of the midterm election year, just before markets roll into the pre-election year, which has often been a risk-on phase for equities. Grouping by this cycle matters because fiscal policy, regulation and the Federal Reserve’s stance tend to follow four-year rhythms, and small caps like those in IWM are especially sensitive to shifts in growth expectations and financing costs.
Across the six completed midterm-year windows since 2002, the trade direction has been long, and every instance has delivered a positive net return over the 40 days. The strongest year in this sample was 2002, when IWM gained 11.78% between Oct 24 and Dec 2, while the softest was 2006 with a still-positive 4.51% move. Add it up: stacking those six windows compounds to a 48.63% cumulative gain, with an annualized return of 6.83% for this slice of the calendar alone.
Average winner gains of 6.86% sit slightly above the 5.89% median, which hints at a couple of outsized years but not wild outliers. The standard deviation of 2.8% is relatively low for a small-cap ETF, and the Sharpe ratio of 2.3 signals that, historically, the reward per unit of volatility in this window has been unusually strong for longs. For traders who think in terms of path, the TradeWave Ratio of 2.48 suggests that price has typically moved a fair distance in the trade direction inside the window, not just at the closing mark.
Intraperiod swings have still mattered. Maximum favorable moves have ranged from 4.52% in 2006 to 13.6% in 2002, showing that in strong years the ETF has often pushed well beyond its final gain before consolidating. On the downside, the worst intraperiod drawdowns have been contained by small-cap standards, with the largest maximum adverse move of about 2.37% in 2006 and several years, such as 2002 and 2018, seeing less than 1% pullbacks from the entry level before recovering.
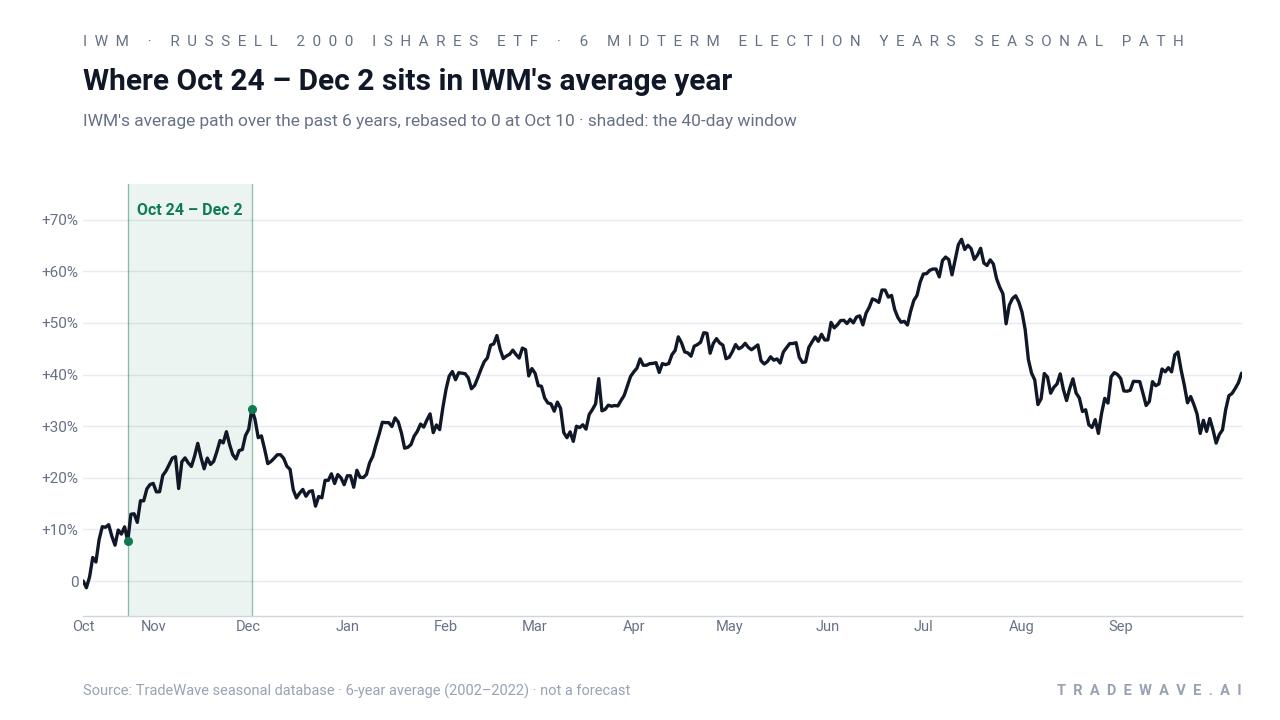
The timing of those moves has tended to favor an early-to-mid window build. The historical seasonal trend chart shows IWM’s average path starting to grind higher soon after the window opens, with gains accruing steadily rather than in a single late spike. That profile fits the idea of investors repositioning into small caps as year-end visibility on policy and earnings firms up in the back half of the midterm year.
A second view shows how each year’s best run-up and worst drawdown have stacked around those net gains.
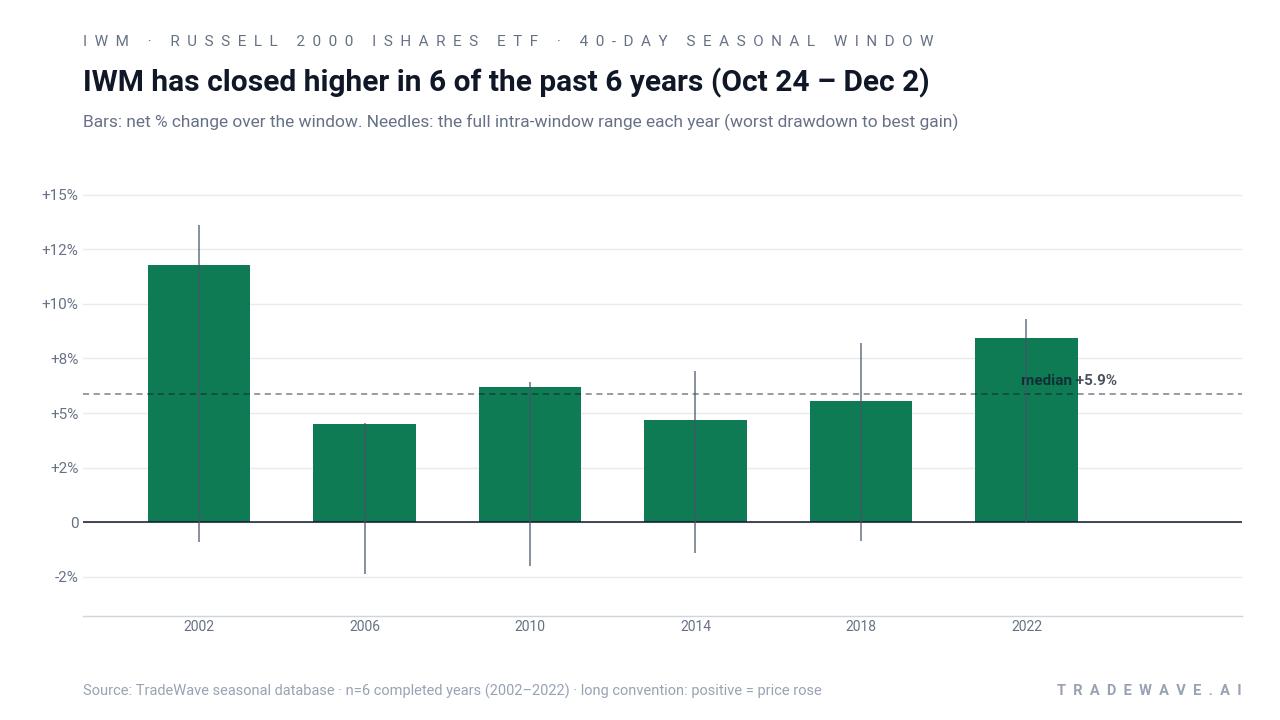
The bars-and-range view underlines the point: every bar is positive, but the needles show that IWM has still experienced 1% to 2% dips inside the window before finishing higher, alongside maximum favorable excursions that often overshoot the final close. For traders, that combination has historically meant a bullish seasonal bias with manageable, but not trivial, downside swings along the way.
History does not guarantee future results; adverse excursions can still be meaningful even in windows where every past instance has finished higher.
Why does Russell 2000 Ishares ETF (IWM) follow this seasonal pattern?
One likely driver is the way the policy and earnings calendar lines up late in the midterm election year. By late October, much of the political uncertainty that can weigh on risk assets earlier in the cycle has been priced, while investors start to look ahead to the pre-election year, which has often been friendlier for equities. At the same time, portfolio managers frequently rebalance into smaller, more cyclical names as visibility on the following year’s growth and rate path improves, which can funnel flows into IWM during this specific fall window.
What is driving Russell 2000 Ishares ETF (IWM) today?
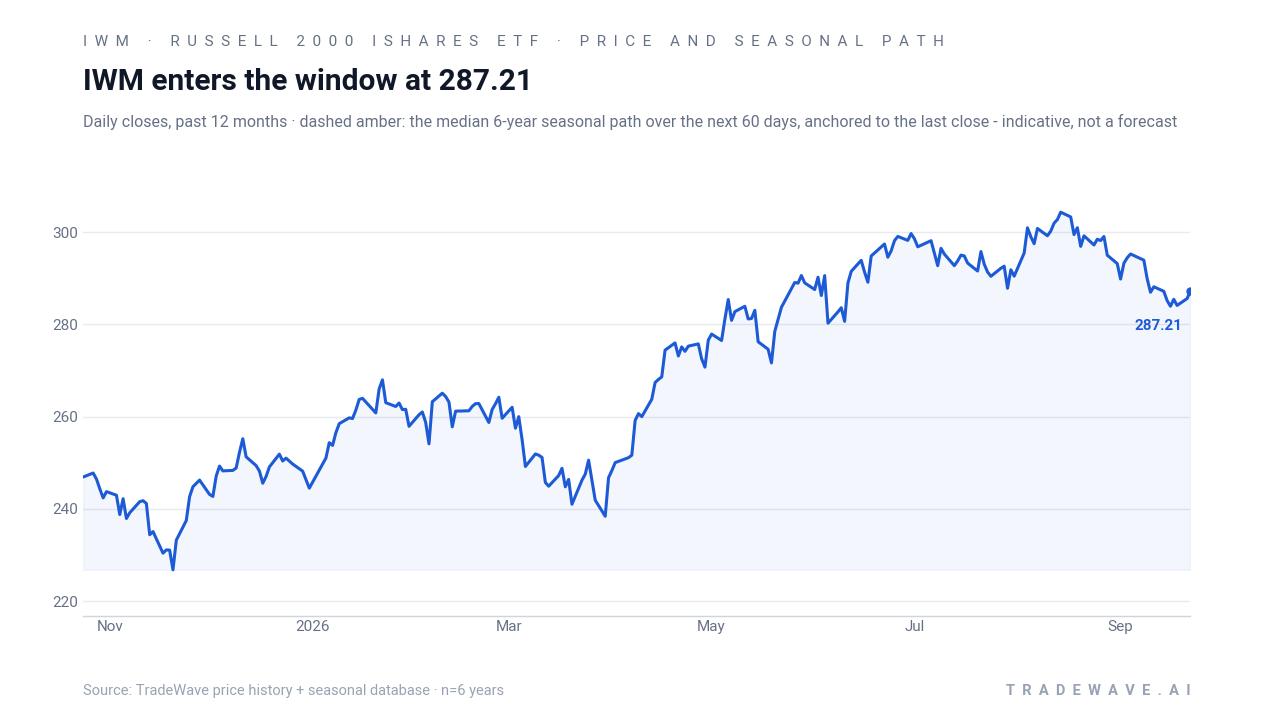
Russell 2000 Ishares ETF ended the prior session at 283.92, down 0.43% on the day and about 6.4% below its 52-week high of 303.59, while still up 15.34% so far in 2026. Fresh data from MarketBeat and MarketWatch show IWM sitting near the upper end of its one-year range after a strong run that has pushed assets under management toward the $80 billion mark, underscoring its role as the primary vehicle for U.S. small-cap exposure.[1][4][7]
Liquidity remains deep, with average daily volume around 21 million shares according to Finviz, which helps keep bid-ask spreads tight for both the ETF and its options.[2] In April 2026, MarketBeat highlighted that the Russell 2000’s push toward new highs was closely tied to expectations for the Federal Reserve’s rate path, a linkage that still defines the small-cap trade: lower real yields tend to ease financing pressure on smaller companies and support IWM, while any renewed hawkish tone from the Fed can hit the fund harder than large-cap benchmarks.[3]
Fund descriptions from MarketBeat and Markets Insider reiterate that IWM tracks the Russell 2000 Index, giving investors a broad basket of U.S. small-cap stocks across sectors from industrials and financials to health care and technology.[1][4] That breadth means the ETF is effectively a barometer for domestic risk appetite and earnings breadth in the lower reaches of the market-cap spectrum. GuruFocus has recently flagged valuation concerns, noting that IWM screens as significantly overvalued on its proprietary metrics as of Sep 21, 2026, which could make the ETF more sensitive to any disappointment on growth or policy in the months ahead.[6]
On the positioning side, GuruFocus also reports no notable insider buying or selling activity tied directly to IWM over the past year, which is consistent with its structure as an index ETF rather than an operating company.[5] Instead, flows are driven by asset allocators and traders rotating between small caps and other risk buckets. Barchart’s performance and volatility data show that IWM has delivered strong year-to-date gains but with the higher beta and swings that investors expect from small caps, reinforcing why the upcoming seasonal window could matter for portfolio risk management.[8]
The chart below places the latest pullback in the context of the past year and overlays the historical seasonal path for the next two months.
Sources
- Markets Insider (Business Insider) - iShares Russell 2000 ETF ETFs | Markets Insider
- Finviz - IWM - iShares Russell 2000 Index Fund Stock Price and Quote
- MarketBeat - Russell 2000 Heading for New Highs Is Bullish for IWM and VTWO
- MarketBeat (IWM page) - iShares Russell 2000 ETF (IWM) Price, Holdings, & News (NYSEARCA:IWM)
- GuruFocus - Russell 2000 ETF (IWM) Poised for Best Year Since 1991 - GuruFocus
- GuruFocus News - IWM Looks 47.0% Overvalued on GF Value™ as of September 21, 2026
- MarketWatch - iShares Russell 2000 ETF Overview - IWM
- Barchart - IWM Performance Report for Russell 2000 Ishares ETF - Barchart.com
About this seasonal analysis
Seasonal pattern data is sourced from TradeWave.ai, which analyzes historical price behavior across annual calendar windows going back up to 30 years. Read the full data methodology or the book The 100-Year Pattern by Afshin Moshrefi (2026 edition). Past performance of seasonal patterns does not guarantee future results. This article is for informational purposes only and does not constitute investment advice.