S&P 500 Financials Sector SPDR (XLF) Has Closed Higher in Every Oct 20-Jul 2 Midterm Window
S&P 500 Financials Sector SPDR is trading just below record territory as it approaches an Oct 20 seasonal window that has historically favored financial bulls in midterm election years.

What is the seasonal pattern for S&P 500 Financials Sector SPDR (XLF)?
S&P 500 Financials Sector SPDR has risen in 6 of 6 midterm-election-year Oct 20–Jul 2 windows, with an average gain of 9.06% in winning years.
- 6 for 6 in this window, averaging 9.06% gains in winning years across the last 6 midterm election cycles.
- Seasonal window runs from Oct 20 through Jul 2, spanning 256 calendar days and covering the late midterm year into the pre-election year.
- Percent Profitable is 100.0%, with 6 winners and 0 losers in the historical sample.
- Avg Profit of 9.06% reflects all years in the sample, since every window finished positive.
- TradeWave Ratio of 2.76 suggests price has typically traveled meaningfully in the long direction within the window, while the Sharpe ratio of 2.62 points to strong risk-adjusted returns.
- Individual years have seen sizable intraperiod swings, with some windows experiencing double-digit drawdowns before finishing higher.
According to historical data from TradeWave.ai, this upcoming stretch for XLF behaves very differently from an average year for financials, with a distinct election-cycle flavor that traders often overlook.
How strong is the upcoming seasonal window for S&P 500 Financials Sector SPDR (XLF)?
S&P 500 Financials Sector SPDR has closed higher in every single Oct 20 to Jul 2 window across the last six midterm election years, averaging 9.06% gains for long positions. The ETF finished the prior session at 54.84, about 6.1% below its 52-week high of 58.19 and roughly 16.6% above its 52-week low of 47.01, leaving it near the upper end of its recent range.
The presidential election cycle matters here because this pattern is built only from midterm election years, a phase that often features heavy policy debate on regulation, capital requirements and fiscal priorities before the pre-election year typically turns more risk-on. Pattern phase equals midterm election year, while the calendar is also in the concluding midterm election year, so the upcoming window lines up cleanly with how prior midterm cycles behaved.
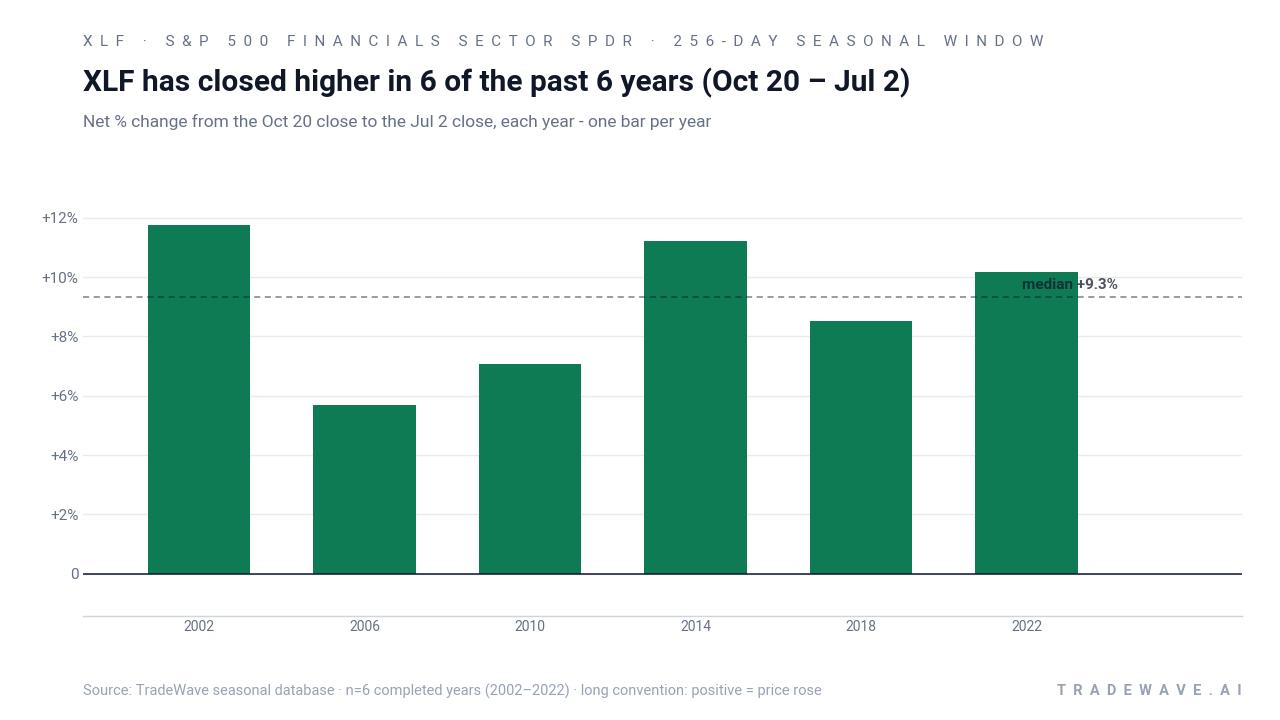
Trade direction for this setup is long, so positive returns are favorable years for the pattern. Across the six completed midterm-election-year samples, Percent Profitable is 100.0%, with 6 winners and 0 losers, and the average profit of 9.06% already reflects all years because there were no losing windows. Median profit of 9.34% sits close to the average, which suggests the gains have been relatively consistent rather than driven by a single outlier year.
The per-year table shows how that plays out in practice. The strongest window came in 2002, when XLF returned 11.74% between the Oct 20 entry and the Jul 2 exit, with a best intraperiod run-up of 16.09% and a worst drawdown of 15.69% from the starting level. The softest outcome was 2006, which still delivered a 5.69% net gain, with a maximum favorable move of 9.89% and a relatively shallow 1.96% adverse move.
More recent cycles have echoed that pattern. In 2018, XLF gained 8.51% over the window, but the worst intraperiod drawdown reached 14.99% before the ETF recovered into the exit date. In 2022, the ETF finished the window up 10.17%, with a maximum favorable excursion of 19.46% and only a 1.69% worst drawdown, a profile that looks more like a steady grind higher than a whipsaw.
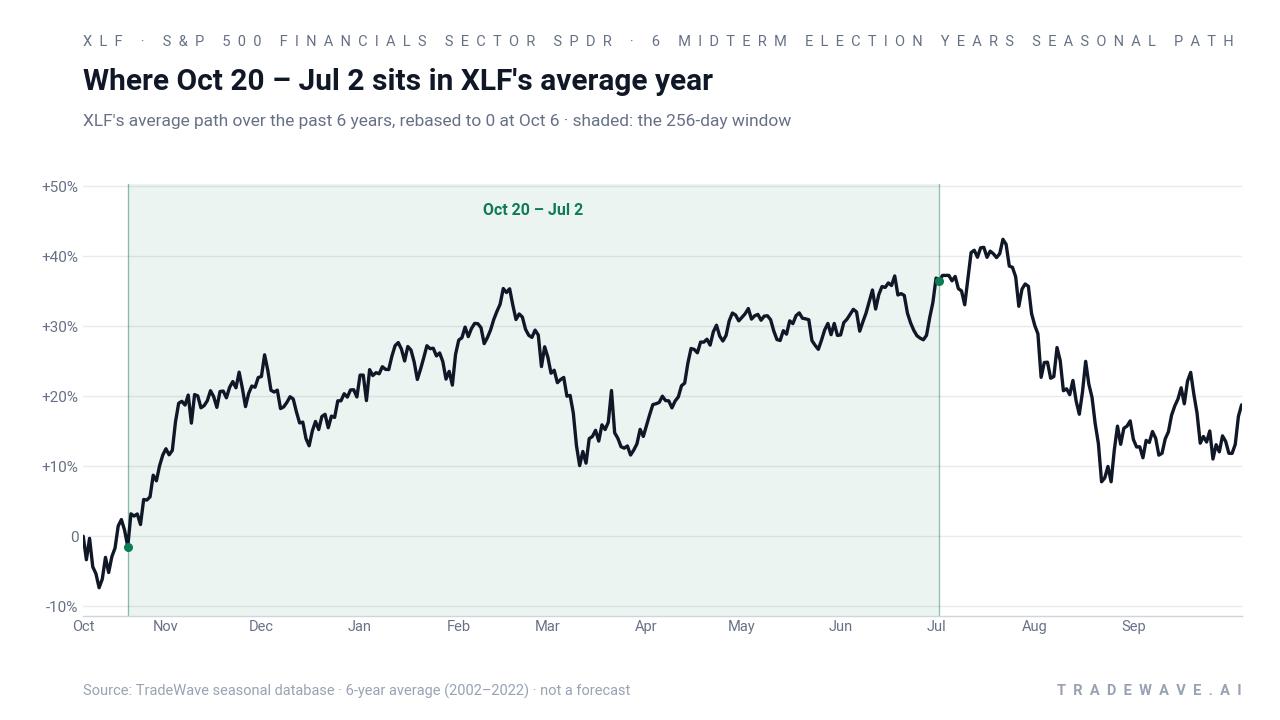
Year-by-year ranges highlight how much XLF has typically swung inside this window before settling at a higher close.
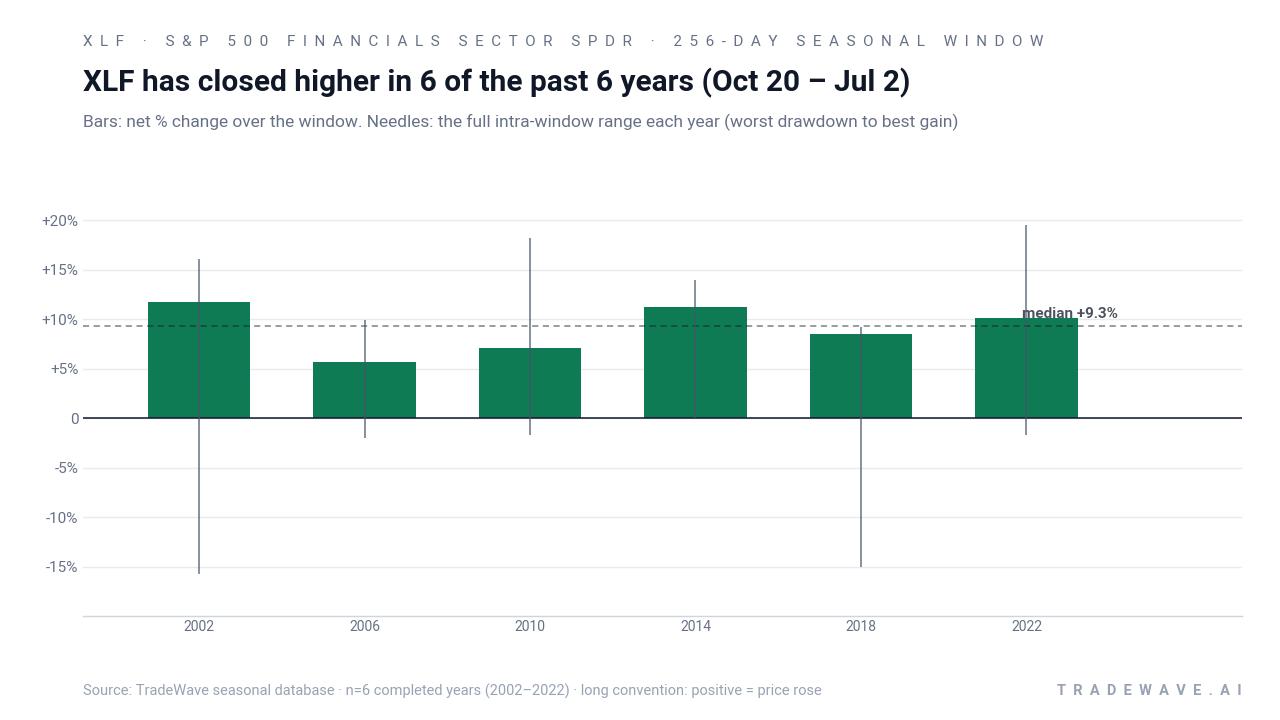
The bars-and-needles profile makes the volatility story clear. Maximum favorable moves have often stretched into the mid-teens or higher, while maximum adverse moves in some years have also pushed into double-digit losses before the window closed in positive territory. That combination of large best-case and worst-case excursions means the window has historically rewarded patience in the long direction but has not been a smooth ride.
The cumulative chart for this pattern compounds each Oct 20–Jul 2 result across the six midterm-election-year samples and reaches a total gain of 68.11%. Add it up: stacking this specific window across those cycles has historically produced a sizable chunk of XLF’s long-run return profile, even though it covers less than a full calendar year each time.
History does not guarantee future results; adverse excursions can be large even in winning windows, and traders using this pattern still face the risk that the next cycle breaks from the historical script.
Why does S&P 500 Financials Sector SPDR (XLF) follow this seasonal pattern?
One likely driver is the way bank and financial earnings cluster from late October through the following summer, which can front-load guidance and capital-return news into this stretch. Analysts have also pointed to institutional portfolio repositioning around the midterm election year, as investors adjust to regulatory and fiscal signals before the typically more supportive pre-election year. This window may also reflect sector rotation tied to the Federal Reserve’s policy path, with financials often benefiting when rate expectations stabilize or tilt higher after midyear volatility.
What is driving S&P 500 Financials Sector SPDR (XLF) today?
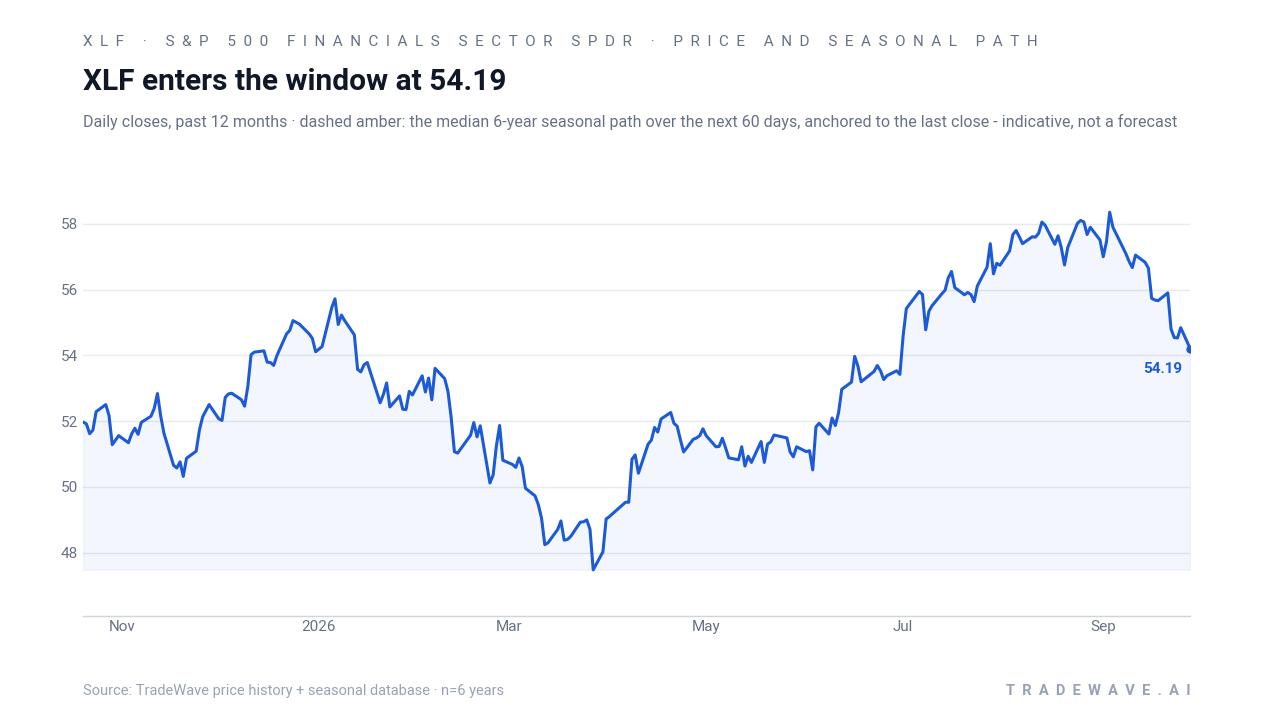
S&P 500 Financials Sector SPDR ended the prior session at 54.84, up 0.57% on the day and sitting about 6.1% below its 52-week high of 58.19 while holding roughly 16.6% above its 52-week low of 47.01. That leaves XLF near the top of its one-year range after a year that has swung from oversold conditions in March to record highs in late July as investors rotated back into financial stocks on stronger earnings and easing worries about private credit and AI-related risks.[1]
In March 2026, MarketBeat highlighted financials as one of the weakest sectors, with XLF trading well below its January peak and technical indicators flashing oversold readings as rates and mortgage policy weighed on sentiment.[1] By Aug 02, 2026, Morningstar reported that financial stocks were “crushing it,” with XLF hitting a record closing high of 57.60 after blended second-quarter earnings for S&P 500 financial companies rose 19.4% year over year and revenue climbed 12.6%.[3] That earnings strength, combined with financials trading at a discount to the broader market, helped fuel a powerful rebound in the ETF.
Short interest has also been shifting. MarketBeat’s short-interest data show notable month-to-month changes in reported short positions across 2025 and 2026, including 61,136,464 shares on Jan 15, 2026 and 59,730,956 shares on Jan 30, 2026, underscoring that positioning in XLF has been active rather than static.[2] Those flows matter because XLF’s top holdings, including large banks and payment networks, collectively represent a significant slice of the S&P 500’s financials sector and can amplify moves when shorts cover into rallies or press into weakness.[3]
The chart below situates the latest move in its recent multi-month context and overlays the median seasonal path for the next 60 days.
Macro drivers remain familiar. Federal Reserve policy and the shape of the yield curve continue to dominate the financials sector outlook, with prior episodes showing that holding or hiking rates can spark intraday volatility in XLF around policy decisions.[3] A flatter or inverted curve has been flagged as a risk for bank margins, while a steeper curve and stable credit conditions have historically supported the ETF. Against that backdrop, the upcoming Oct 20 seasonal window arrives just as markets transition from the policy-heavy midterm election year into the pre-election year, a phase that has often coincided with more constructive risk appetite for cyclicals like financials.
What to watch from here is whether XLF can hold near the upper end of its range as the seasonal window opens, and how earnings revisions, Fed communication and short-interest trends interact with the historical pattern. If the ETF respects support on pullbacks and rallies on solid earnings and a stable rate path, that would rhyme with prior midterm-election-year windows that ultimately finished higher despite sizable drawdowns along the way.[1] A break of key support levels on renewed curve inversion or credit stress, by contrast, would mark a clear departure from the six-for-six track record and signal that this cycle’s macro backdrop is overpowering the usual seasonal tailwind.
Sources
About this seasonal analysis
Seasonal pattern data is sourced from TradeWave.ai, which analyzes historical price behavior across annual calendar windows going back up to 30 years. Read the full data methodology or the book The 100-Year Pattern by Afshin Moshrefi (2026 edition). Past performance of seasonal patterns does not guarantee future results. This article is for informational purposes only and does not constitute investment advice.