Six-for-Six Midterm Run: S&P 500 Technology Sector SPDR (XLK) Averages 12.8% Gains
S&P 500 Technology Sector SPDR is nearing a historically strong 220-day midterm-year seasonal window even as recent trading has been choppy and macro volatility has kept tech leadership in flux.

What is the seasonal pattern for S&P 500 Technology Sector SPDR (XLK)?
S&P 500 Technology Sector SPDR has risen in 6 of 6 midterm-year Sep 17–Apr 24 windows, with an average gain of 12.8% in winning years.
- 6 for 6 in this window, with XLK posting gains every midterm-year Sep 17–Apr 24 stretch in the sample.
- Percent Profitable is 100%, with 6 winners and 0 losers across the last six midterm election years.
- Average profit in winning years is 12.8%, contributing to a compounded cumulative return of 105% when the window is stacked across cycles.
- The TradeWave Ratio is 1.61, indicating price typically travels meaningfully in the long direction within the window.
- The Sharpe ratio of 2.56 points to a historically strong risk-adjusted profile for this long seasonal setup.
- Individual years have still seen sizable intraperiod drawdowns, so the path has not been a straight line even in winning windows.
According to historical data from TradeWave.ai, this upcoming midterm-year stretch has behaved very differently from an average calendar period for XLK. The next section walks through how that pattern has played out in prior cycles and where the risks have clustered.
How has S&P 500 Technology Sector SPDR (XLK) traded in this midterm-year window?
S&P 500 Technology Sector SPDR has booked gains in every single Sep 17–Apr 24 midterm-year window across the last six cycles, averaging a 12.8% rise for long positions. The ETF is coming off a volatile summer in which tech leadership swung from sharp underperformance in July to a strong August rebound, leaving traders focused less on levels and more on whether the sector can hold its role as the market’s growth engine.[1][2]
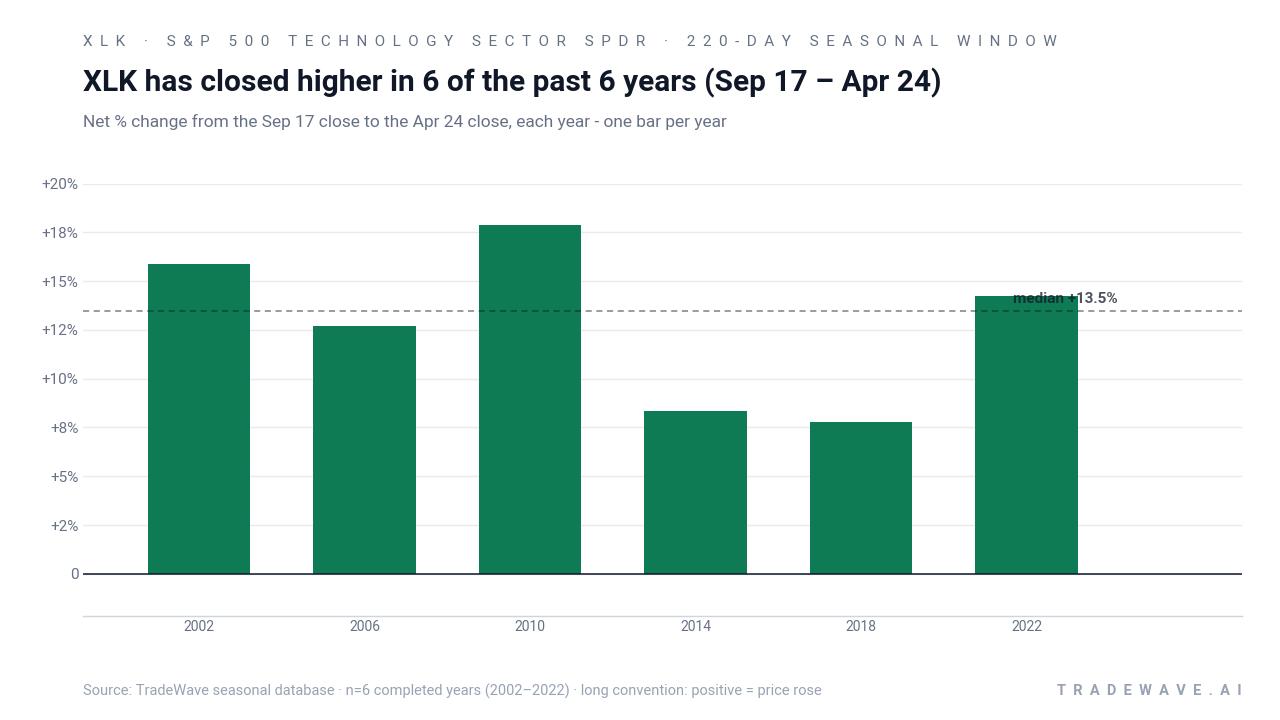
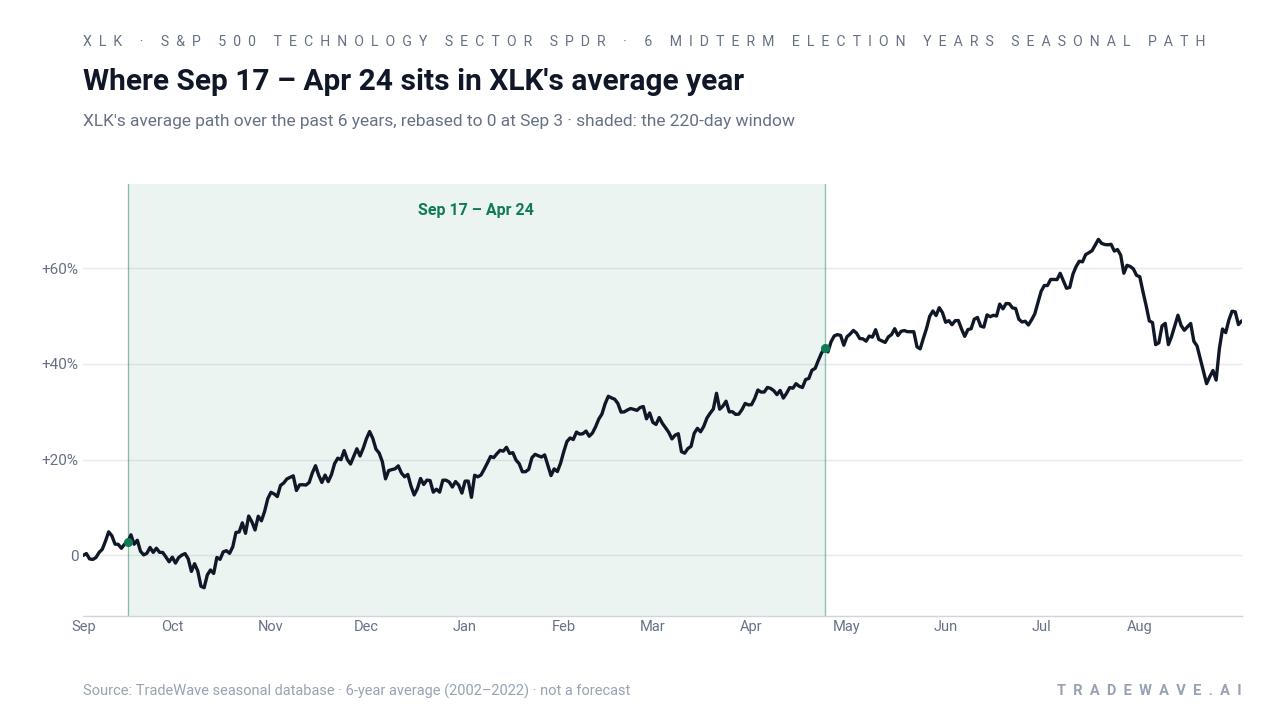
Because this pattern is grouped by the presidential election cycle, it only looks at midterm election years that match today’s phase and then follows XLK from late September into the following spring. That matters for tech because policy risk, regulation headlines and fiscal debates tend to cluster in midterm years, while the following pre-election year has often coincided with a friendlier liquidity and risk backdrop for growth stocks.
The upcoming window begins on Sep 17 and runs for 220 calendar days, carrying XLK from the final weeks of the midterm election year into the heart of the pre-election year. Across the six midterm cycles in this sample, every one of those windows finished positive for a long trade, with net returns ranging from 7.77% in 2018 to 17.86% in 2010. Add it up and stacking those six windows compounds to a 105% cumulative gain, which is why this slice of the calendar stands out inside XLK’s broader seasonal map.
Intraperiod swings have been meaningful. Maximum favorable moves, or the best point-to-peak rallies within each window, have run as high as 31.85% in 2002 and 20.67% in 2010, showing that strong years often saw sizable upside bursts before the final close. On the flip side, maximum adverse moves, the worst drawdowns from entry, reached as deep as -21.6% in 2018 and -15.55% in 2002, reminding traders that even winning midterm-year windows have included sharp pullbacks along the way.
Looking at individual years, 2010 stands out as the strongest net result with a 17.86% gain from entry to exit, while 2018 is the softest at 7.77% despite that year’s -21.6% intraperiod drawdown. That combination of positive finishes and sometimes violent dips fits the broader story of tech in mid-cycle environments: policy noise and rate scares can hit valuations, but by the time the pre-election year gets going, growth leadership has often reasserted itself.
A second view that layers in both rallies and drawdowns shows how wide the trading range has been inside this otherwise consistent pattern.
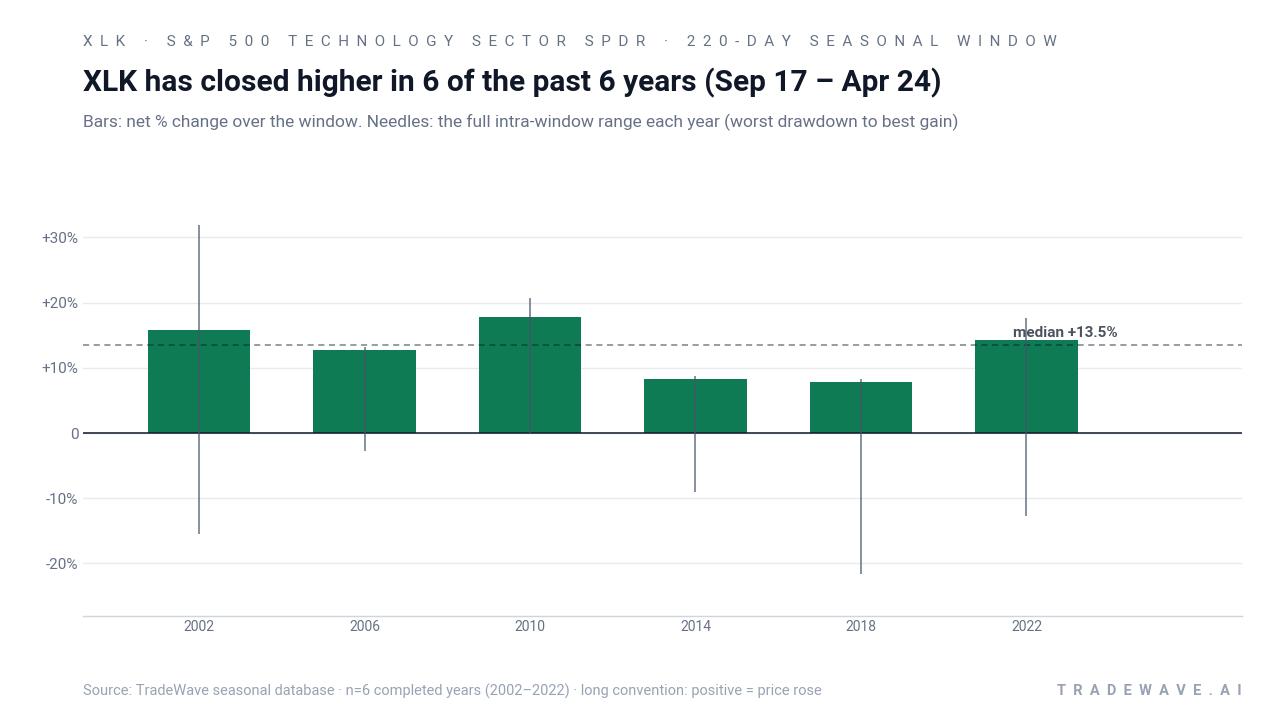
History does not guarantee future results; adverse excursions (MAE) can be large even in winning windows.
Why does S&P 500 Technology Sector SPDR (XLK) follow this seasonal pattern?
One likely driver is the way the tech earnings calendar and guidance updates bunch up between late Q3 and early Q2, which often resets growth expectations as the cycle moves from midterm uncertainty into the pre-election year. Analysts have also pointed to institutional portfolio rebalancing and sector rotation, with investors adding back to growth and technology as policy visibility improves and fiscal support becomes clearer. This pattern may also reflect how rate expectations evolve across this phase of the presidential cycle, since lower or stabilizing yields tend to favor long-duration tech cash flows.
What is driving S&P 500 Technology Sector SPDR (XLK) today?
XLK heads into this seasonal setup after a whipsaw summer in relative performance. In July, the ETF suffered its worst 10-day stretch versus the S&P 500 since 2002, a sharp reminder that even dominant tech names can lag badly when investors rotate toward value and cyclicals.[2] By late August, strong earnings from Nvidia, Microsoft, Meta and Apple helped XLK rebound more than 6% for the month, although that rally came with late-month volatility tied to rising oil prices and renewed geopolitical tensions around U.S.-Iran relations.[1]
The chart below situates the latest swings in XLK against its past year of trading and a median seasonal projection for the next two months.
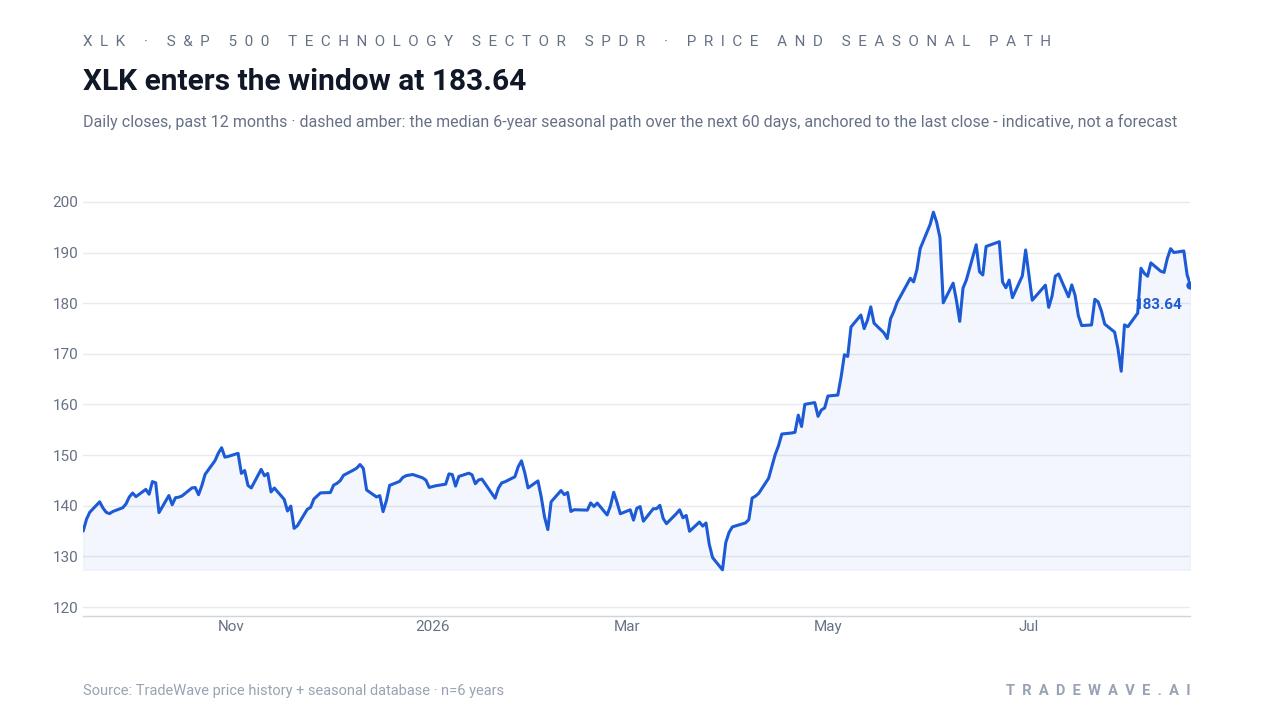
Under the surface, the sector’s earnings-season behavior has been more nuanced than the headline August bounce suggests. In late July, Charles Schwab data cited by Bloomberg showed that XLK components beating earnings-per-share estimates underperformed the S&P 500 by about 3.3% on or the day after reporting, a sign that good news was already priced in or that investors were using strength to rotate elsewhere.[1] Combined with July’s relative slump, that pattern has kept positioning in big tech more tactical, with traders quick to fade rallies when macro headlines turn.
Macro and policy risk remain central to the tech-sector outlook as the midterm election year winds down. Higher oil prices and geopolitical tensions have already injected bouts of volatility into August trading, and the policy calendar into year-end is heavy with potential catalysts on regulation, antitrust and fiscal priorities that matter for large-cap tech.[1][2] Against that backdrop, the historical midterm-to-pre-election seasonal tailwind for XLK is not a forecast, but it does frame how the sector has tended to behave once the political noise begins to clear.
What should traders watch as XLK enters this seasonal window?
First, watch how XLK trades around the Sep 17 start date and into October: in prior midterm years, the ETF has often seen its deepest drawdowns early in the window before grinding higher into spring. A break of recent support accompanied by contained intraperiod downside would still fit the historical pattern, while a sustained slide that fails to recover would mark a clear departure from the six-for-six track record.
Second, monitor sector leadership within XLK. The last few months showed that even when mega-cap tech delivers strong earnings, the ETF can still lag the broader market if investors rotate toward other sectors or fade crowded winners.[1][2] If the upcoming window is going to rhyme with history, tech leaders such as Nvidia, Microsoft, Meta and Apple will likely need to reassert consistent relative strength rather than just delivering one-off post-earnings pops.
Third, keep an eye on the macro and policy calendar as the midterm election year concludes and the pre-election year approaches. Historically, this transition has coincided with a friendlier backdrop for growth and risk assets, but that tendency has played out alongside falling or stable rates and clearer fiscal guidance. If bond yields stay elevated or regulatory pressure on big tech intensifies, the usual midterm-year seasonal tailwind for XLK could face a tougher test than in prior cycles.
Finally, traders should track volatility inside the window, not just the end result. The historical record shows that XLK’s midterm-year Sep 17–Apr 24 windows have combined strong average gains with sizable intraperiod swings, including drawdowns of more than 20% in some years. If this cycle again delivers wide trading ranges but ultimately resolves higher, it would be another chapter in a pattern that has quietly gone six for six. A smoother, low-volatility grind or a persistent downtrend, by contrast, would signal that the election-cycle playbook for tech is changing.
Sources
About this seasonal analysis
Seasonal pattern data is sourced from TradeWave.ai, which analyzes historical price behavior across annual calendar windows going back up to 30 years. Read the full data methodology or the book The 100-Year Pattern by Afshin Moshrefi (2026 edition). Past performance of seasonal patterns does not guarantee future results. This article is for informational purposes only and does not constitute investment advice.