6-for-6 Midterm Winter Run: Nasdaq QQQ Invesco ETF (QQQ) Averages 12.05% Gains
Nasdaq QQQ Invesco ETF is heading toward a late-October seasonal window that has never been negative in past midterm election years, just as tech valuations and policy uncertainty keep volatility elevated.

What is the seasonal pattern for Nasdaq QQQ Invesco ETF (QQQ)?
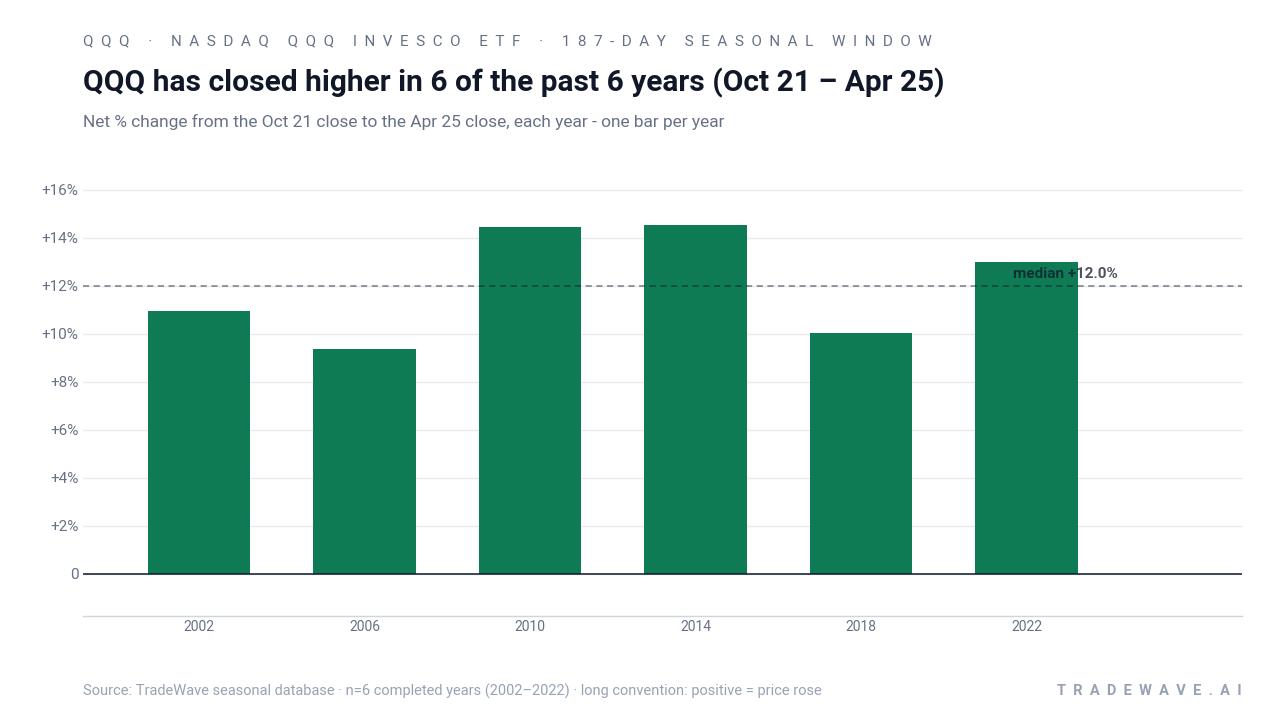
Nasdaq QQQ Invesco ETF has risen in 6 of 6 midterm-year Oct 21 to Apr 25 windows, with an average gain of 12.05% in winning years.
- 6 for 6 in this window, with QQQ posting gains every time from Oct 21 to Apr 25 in the last six midterm election years.
- Percent Profitable is 100.0%, with 6 winners and 0 losers across the sample.
- Avg Profit in those winning years is 12.05%, with a median gain of 11.98% over the 187-day stretch.
- The trade direction is long, and the TradeWave Ratio (TWR) of 3.36 shows price has typically traveled meaningfully in the upside direction within the window.
- A Sharpe ratio of 4.46 points to unusually strong risk-adjusted returns for this specific Nasdaq QQQ Invesco ETF trading window.
- Individual years have still seen sizable drawdowns inside the window, including a worst intraperiod drop of -17.27% in 2018 before finishing higher.
According to historical data from TradeWave.ai, this late-October to late-April stretch has behaved very differently from an average six-month period for QQQ. The next section walks through how that pattern has played out across the last six midterm election years.
How strong is the upcoming seasonal window for Nasdaq QQQ Invesco ETF (QQQ)?
Nasdaq QQQ Invesco ETF has closed higher in 6 of 6 prior midterm-year windows running from Oct 21 to Apr 25, averaging a 12.05% gain over 187 days. The next iteration of that window begins on Oct 21, 2026, as markets wrap up the midterm election year and pivot toward the historically friendlier pre-election year phase for risk assets.
Grouping the data by the presidential election cycle matters here because this window always lands in the late part of a midterm election year, when Washington policy risk is high but markets are already starting to discount the pre-election year, which has often been supportive for growth and tech exposure. In this sample, the pattern phase is defined as “the last 6 midterm election years,” so each observation reflects how QQQ behaved in that specific political and macro backdrop rather than in a random calendar year.
The trade direction for this pattern is long, and the track record is clean. Across 2002, 2006, 2010, 2014, 2018 and 2022, QQQ finished the Oct 21 to Apr 25 stretch higher every time, with net returns ranging from 9.35% to 14.51%. Average gains of 12.05% and a median of 11.98% show that the typical outcome has been a double-digit advance rather than a one-off outlier.
Looking at individual years, 2014 stands out as the strongest net result, with a 14.51% gain and a best intraperiod move of 15.44% from the entry price. The softest year in the set, 2006, still delivered a 9.35% net gain, with the maximum favorable move almost identical at 9.37%, suggesting a relatively smooth grind higher in that instance. Even in 2018, when QQQ suffered a -17.27% worst drawdown inside the window, the ETF still finished the period up 10.04% from the Oct 21 entry.
The MFE/MAE profile shows why this Nasdaq QQQ Invesco ETF seasonal trend has attracted attention. Maximum favorable excursions have ranged from roughly 9% to more than 18%, while maximum adverse excursions have varied from less than 1% to that -17.27% outlier. In plain English, the best years saw QQQ push quickly higher with limited downside, while the tougher years still ended positive but forced investors to sit through deeper drawdowns along the way.
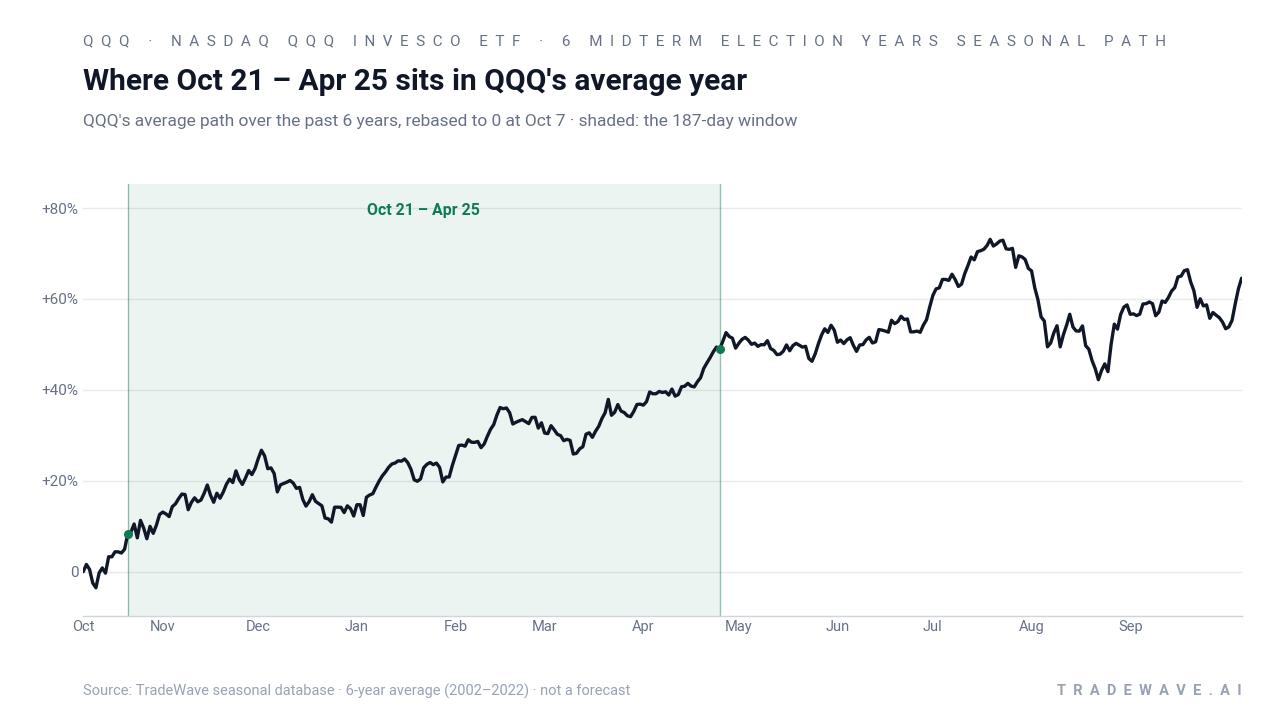
A per-year view of net returns and intraperiod swings helps clarify how much upside and downside QQQ has historically packed into this window.
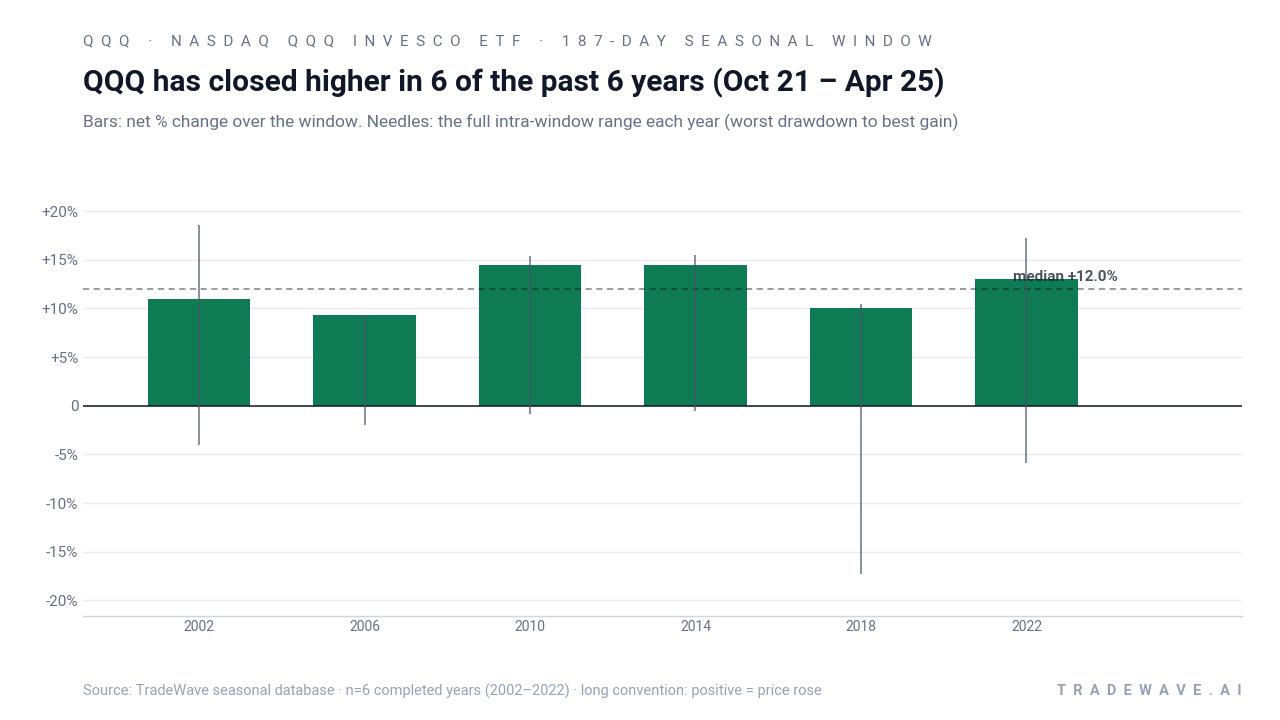
The cumulative view is just as striking. Compounding the six completed Oct 21 to Apr 25 windows produces a 97.68% total return, nearly doubling capital across those slices of the calendar alone. That is consistent with the 12.03% annualized return and a Sharpe ratio of 4.46, which is unusually high for a six-month holding period tied to a single part of the election cycle.
History does not guarantee future results; even in a 100% winning sample, adverse excursions within the window have at times been large, and future midterm-year conditions may differ from the past.
Why does Nasdaq QQQ Invesco ETF (QQQ) follow this seasonal pattern?
One likely driver is the way the tech-heavy Nasdaq complex reacts to the policy calendar around midterm elections, with uncertainty peaking into the vote and easing as the legislative picture clears. Analysts have also pointed to institutional portfolio repositioning into growth and higher-beta names as the market transitions from the midterm election year into the pre-election year, a phase that has often coincided with easier financial conditions and stronger earnings breadth for large-cap tech. This QQQ seasonal pattern may reflect that combination of reduced policy risk, renewed risk appetite and the clustering of major earnings reports across the winter and early spring.
What is driving Nasdaq QQQ Invesco ETF (QQQ) today?
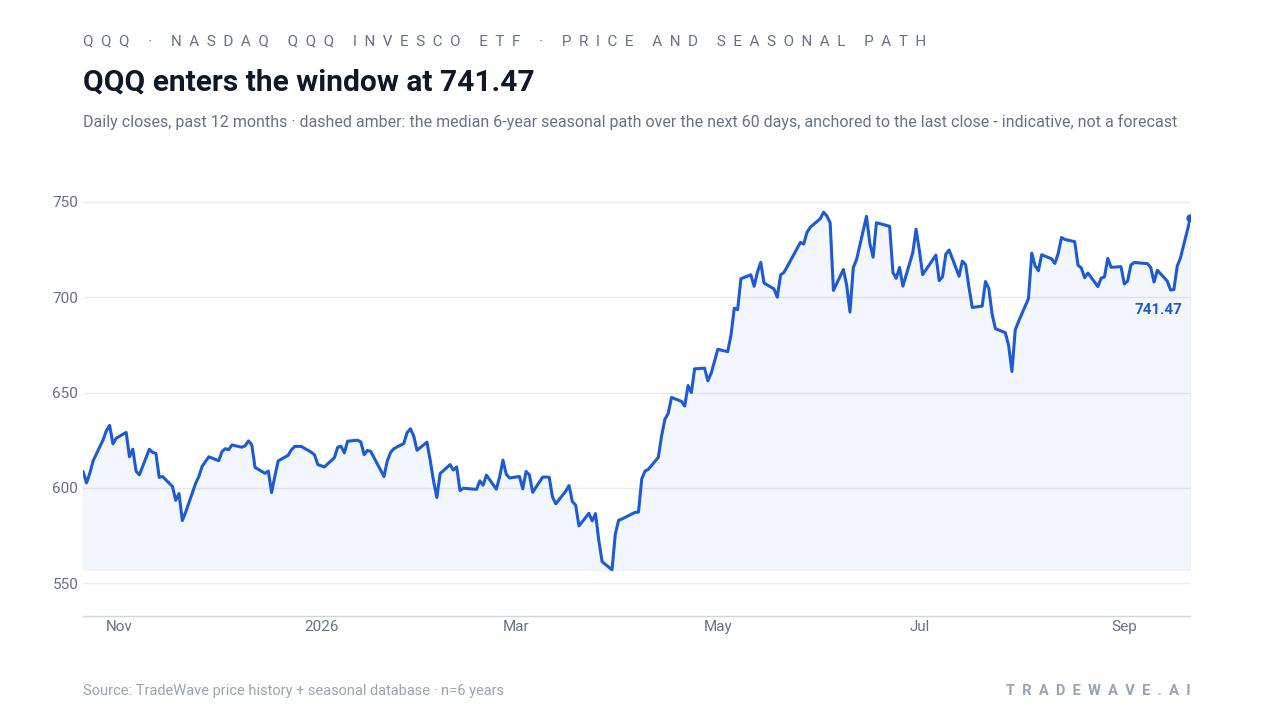
QQQ is trading near the upper end of its 52-week range, with the prior year’s high at 745.45 and the low at 553.22, underscoring how far the tech-led rally has already run. Options screens show active speculative positioning in the ETF, with dedicated unusual-activity trackers flagging concentrated call buying and elevated volume in late August that pointed to traders leaning into upside exposure ahead of the fall policy and earnings calendar.[1] At the same time, institutional ownership remains deep and diversified, with large asset managers and pension funds continuing to use QQQ as a core vehicle for Nasdaq 100 exposure.[7]
Behind the scenes, the fund’s regulatory filings and disclosure cadence have stayed steady, with recent SEC documents detailing portfolio composition, risk factors and derivatives usage that are broadly consistent with its long-running mandate to track the Nasdaq 100.[4][5][6] On the governance side, insider-trading trackers show routine activity tied to the trust’s structure rather than directional bets, suggesting that flows and macro sentiment, not insider moves, remain the primary drivers of day-to-day price action.[3]
The chart below situates the latest move in its recent multi-month context and overlays the median historical seasonal path for the next 60 days.
What should traders watch as this QQQ seasonal window approaches?
First, the calendar. The upcoming Oct 21 start date lands as the market is concluding the midterm election year and shifting into the pre-election year, a transition that has historically been supportive for growth-heavy benchmarks like QQQ. How the ETF behaves into and through that handoff will show whether the 6-for-6 pattern is aligning with the current macro backdrop or starting to fade.
Second, intraperiod volatility. Prior windows have delivered strong net gains but sometimes with sharp drawdowns, including a -17.27% worst drop in 2018 before the trade finished higher. If the next window again features large swings between maximum favorable and adverse moves, traders will need to distinguish between routine seasonal noise and a genuine break from the historical script.
Third, options and flow signals. The late-August burst of unusual options activity in QQQ highlighted how quickly speculative positioning can build when traders anticipate a move.[1] Watching whether call-heavy flows persist, flip to puts, or simply normalize as Oct 21 approaches will offer a real-time read on how much of the historical seasonality is already priced in. Add it up: a spotless 6-for-6 record, double-digit average gains and a live options market leaning into tech risk make this one of the more consequential seasonal windows on the calendar for Nasdaq QQQ Invesco ETF.
Sources
- Barchart - QQQ Unusual Options Activity for Invesco QQQ Trust ETF ...
- Yahoo Finance - Invesco QQQ Trust (QQQ) Options Chain - Yahoo Finance
- Fintel - QQQ Insider Trading - Invesco QQQ Trust, Series 1 - Fintel
- Fintel - QQQ / Invesco QQQ Trust, Series 1 - SEC Filings, Annual ...
- MarketBeat - Invesco QQQ (QQQ) 10K Form and Latest SEC Filings 2026 | MarketBeat
- Seeking Alpha - Latest SEC filings for Invesco QQQ Trust, Series 1 ETF (QQQ) | Seeking Alpha
- MarketBeat - Invesco QQQ (QQQ) Institutional Ownership 2026 - MarketBeat
About this seasonal analysis
Seasonal pattern data is sourced from TradeWave.ai, which analyzes historical price behavior across annual calendar windows going back up to 30 years. Read the full data methodology or the book The 100-Year Pattern by Afshin Moshrefi (2026 edition). Past performance of seasonal patterns does not guarantee future results. This article is for informational purposes only and does not constitute investment advice.