CBOE Volatility Index (VIX) Has Dropped in 9 of 10 Years in This 69-Day Summer Window
CBOE Volatility Index is approaching a historically weak 69-day seasonal window even as spot VIX sits near the middle of its 52-week range, giving equity traders a rare volatility roadmap into early summer.
What is the seasonal pattern for CBOE Volatility Index (VIX)?
CBOE Volatility Index has fallen in 9 of 10 years during this 69-day May–July window, with an average 13.73% gain for short positions in winning years.
- 9 for 10 in this window, with short VIX trades averaging 13.73% gains in winning years.
- The upcoming seasonal window starts May 6 and runs for 69 trading days into mid-summer.
- Percent Profitable sits at 90%, with 9 winners and just 1 losing year across the past decade.
- Avg Profit - All, which includes the lone losing year, is still a strong 12%, pointing to a persistent downside bias in VIX.
- The TradeWave Ratio of 2.27 signals that VIX typically travels meaningfully in the trade direction within the window, even when final closes vary.
- A Sharpe ratio of 1.22 over the sample suggests the pattern has delivered unusually strong risk-adjusted returns for short volatility exposure.
According to historical data from TradeWave.ai, this stretch of the calendar has behaved very differently from an average month for volatility. The next section walks through how that pattern has played out in prior years and what it could mean for the coming window.
How has CBOE Volatility Index (VIX) behaved in this May–July window?
CBOE Volatility Index has dropped in 9 of the past 10 years during the 69 trading days starting May 6, making this one of the most consistently weak seasonal windows for VIX on the calendar. Today the index closed at 19.49, down 7.37% on the session and sitting about 45.5% below its 52-week high of 35.75 while trading roughly 45.6% above its 52-week low of 13.38.
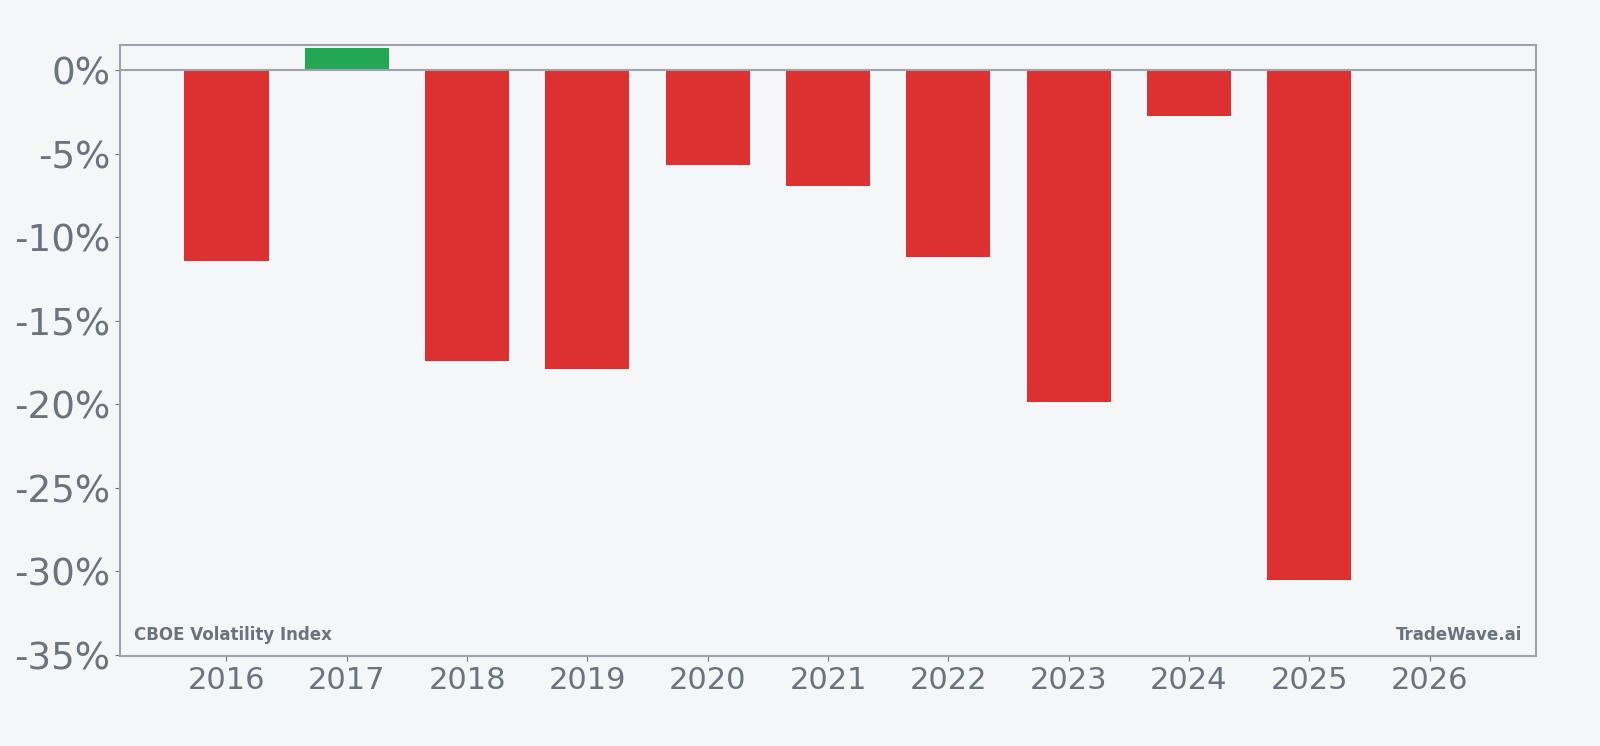
TradeWave’s stats frame this as a short-volatility regime. With a short trade direction, years where VIX falls are the “winners,” and those have dominated the sample. Across the past decade, the window has delivered a 207% cumulative return for short exposure, with an annualized return of 11.87% and a median profit of 11.28%.
The average winning year has produced a 13.73% gain for shorts, while including the single losing year still leaves Avg Profit - All at 12%. That losing year was 2017, when VIX finished the window up 1.33% from entry, a modest setback in an otherwise strong run for the pattern. The weakest outcome for shorts came in 2017, but the most painful intraperiod drawdown arrived in 2025, when VIX’s worst adverse move within the window reached -36.59% before the index ultimately finished sharply lower.
On the flip side, maximum favorable excursions have been large. In 2016, VIX spiked as much as 81.52% above the entry level at one point in the window before sliding into an 11.41% net decline by the end. That combination of big intraperiod spikes and lower closes is typical of a short-volatility pattern where volatility shocks tend to fade over several weeks.
The 10-year seasonal trend chart shows VIX often starting the window with a brief burst of volatility before grinding lower into late June and early July. The typical path is not a straight line; instead, it features one or two mid-window bumps that have historically failed to break the broader downward drift.
A combined view of net returns and intraperiod swings shows how often volatility spikes have ultimately faded during this stretch.
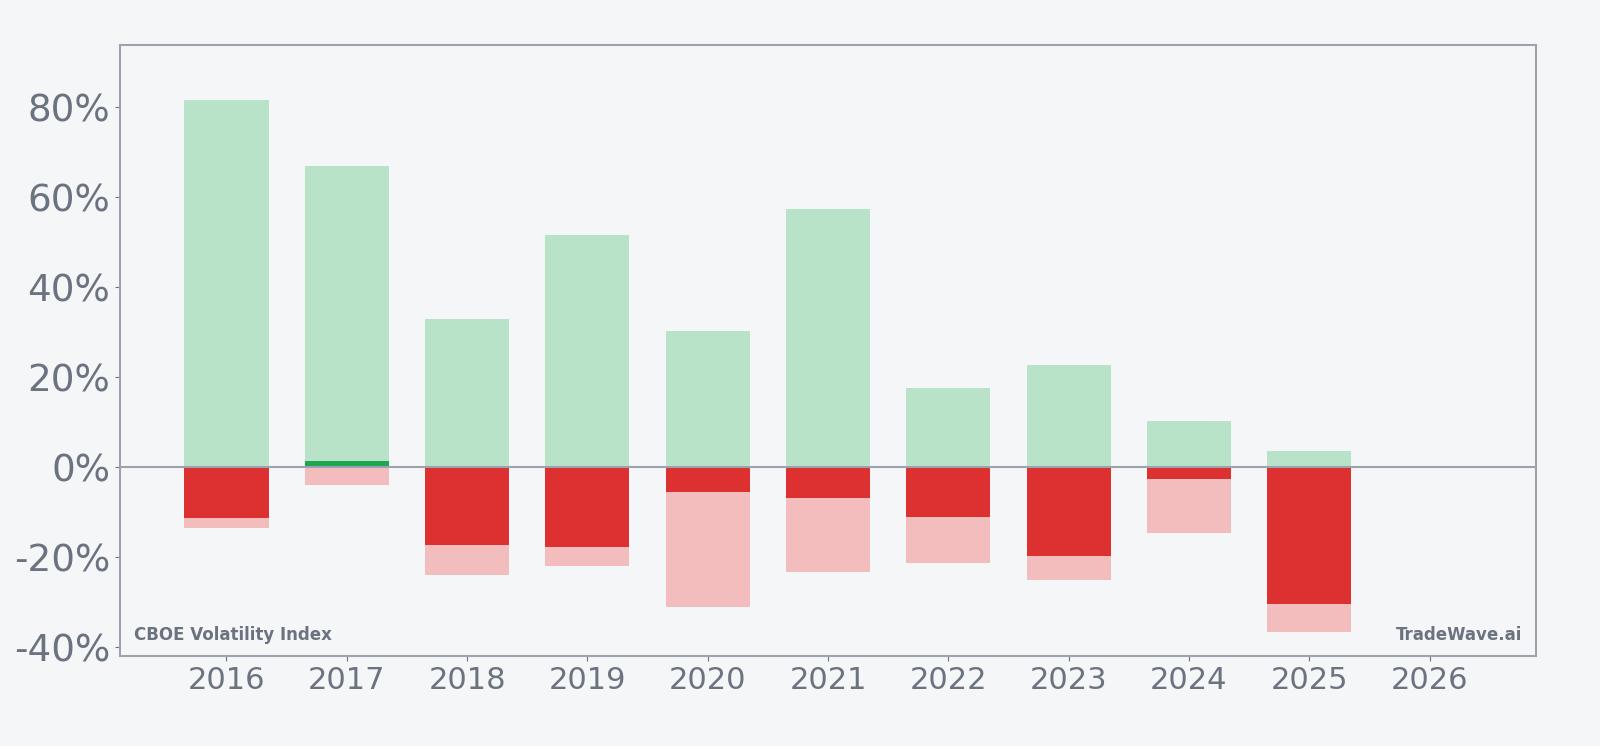
The bars with maximum favorable and adverse excursions underline how noisy the ride can be even in a strong short-volatility window. Years like 2020 and 2023 saw VIX swing more than 20% against shorts at some point before finishing with net declines of 5.66% and 19.85% respectively. Add it up: nine for ten with double-digit average gains for shorts is a rare level of consistency for any volatility pattern.
History does not guarantee future results; adverse excursions (MAE) can be large even in winning windows.
Why does CBOE Volatility Index (VIX) follow this seasonal pattern?
This May–July VIX seasonal trend may reflect a mix of earnings calendar gaps, lighter summer news flow, and institutional portfolio rebalancing. After the heavy first-quarter reporting season and key policy meetings, equity markets often settle into a quieter stretch where demand for options hedges fades. Analysts have also pointed to options expiration patterns and systematic volatility selling strategies that tend to rebuild exposure into early summer, putting structural pressure on implied volatility.
What is driving CBOE Volatility Index (VIX) today?
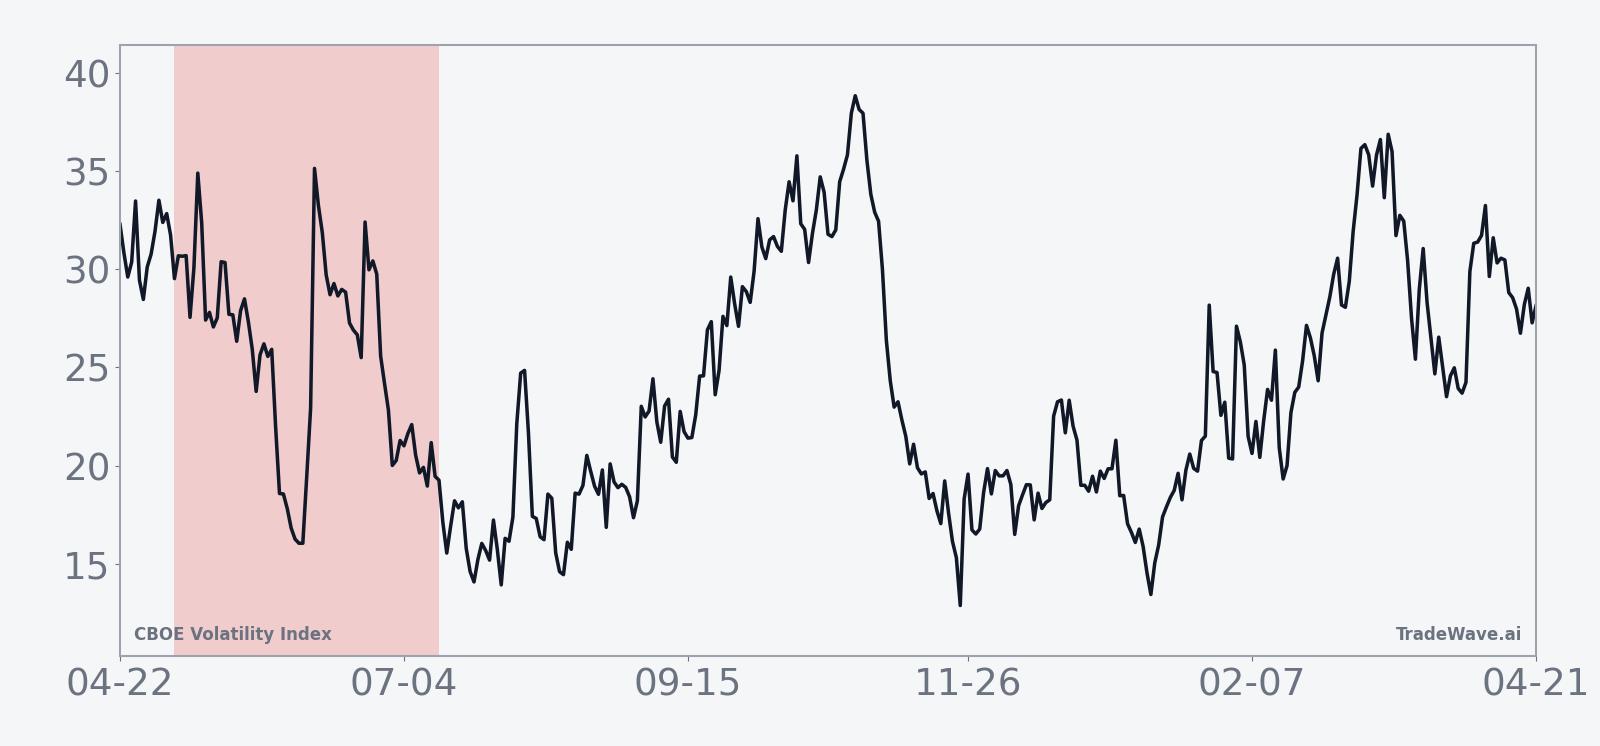
VIX slipped 7.37% on Friday to 19.49, pulling back from a March spike to 23.42 that followed a flare-up in Middle East tensions and leaving the index roughly mid-range between its 52-week high of 35.75 and low of 13.38.[1] That move keeps implied volatility elevated relative to the calm of 2024 but well below the panic levels seen when trade war headlines pushed VIX above 40 in Apr 2025.[1] In broad terms, VIX tends to compress when equities are well supported and expand sharply when risk-off episodes or abrupt drawdowns hit, and the current level suggests markets are pricing in event risk without outright fear.
The chart below situates the latest move in its recent multi-month context and overlays the upcoming seasonal projection.
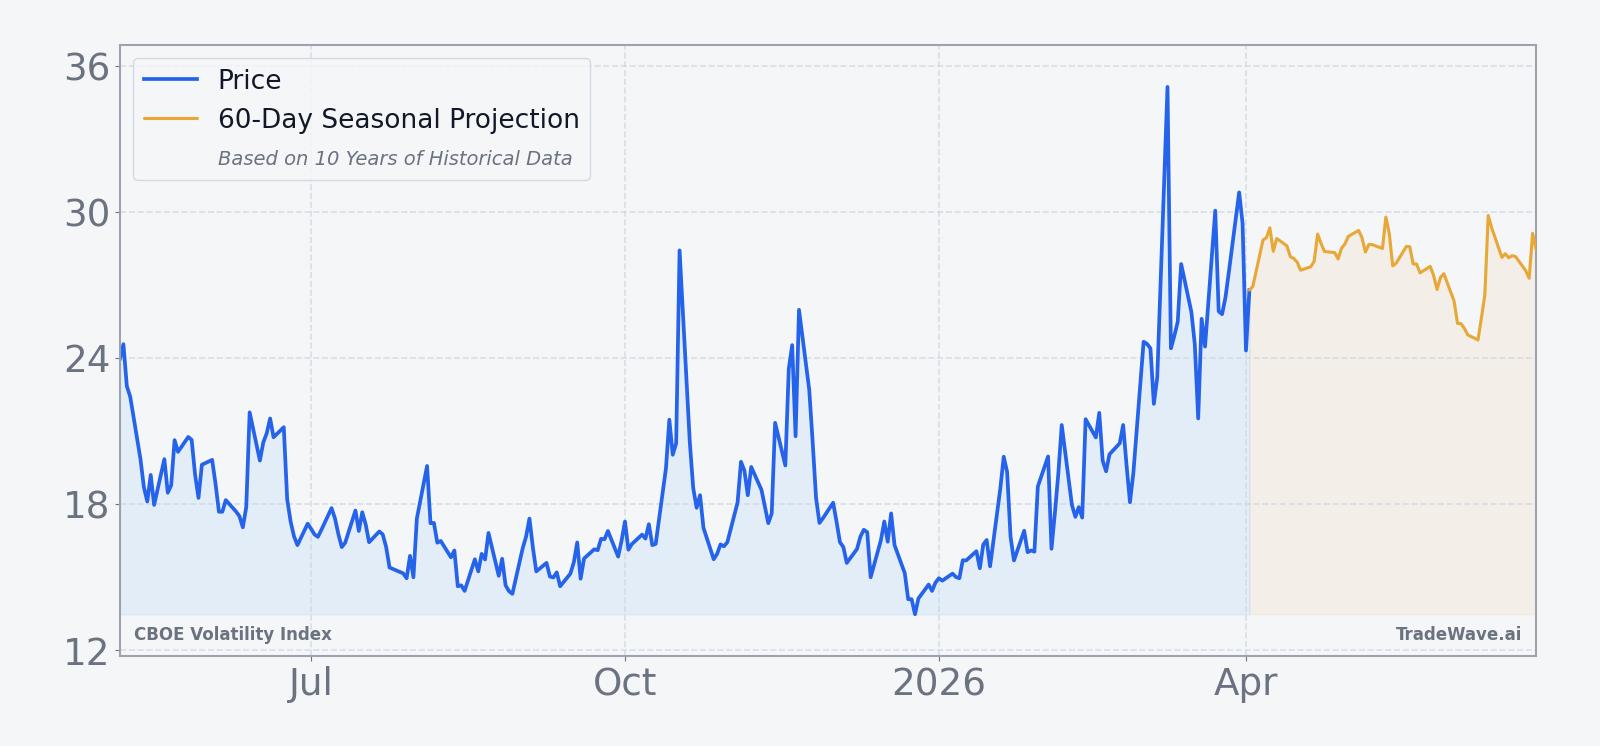
Macro drivers remain the wild card. Policy uncertainty in Washington and lingering tariff threats have kept volatility traders alert since mid-2025, when confusion around potential changes at the Federal Reserve briefly jolted VIX higher.[1] Geopolitical risk from both US-China trade tensions and Middle East conflicts has repeatedly produced short, sharp spikes in implied volatility that later faded as headlines cooled.[1] For equity investors, the key takeaway heading into May is that the calendar is about to flip into a stretch where those spikes have historically been sold rather than chased.
Sources
About this seasonal analysis
Seasonal pattern data is sourced from TradeWave.ai, which analyzes historical price behavior across annual calendar windows going back up to 30 years. Read the full data methodology or the book The 100-Year Pattern by Afshin Moshrefi (2026 edition). Past performance of seasonal patterns does not guarantee future results. This article is for informational purposes only and does not constitute investment advice.