Nasdaq 100 (NDX) Has Rallied in 15 of 15 Late-May Windows, Averaging 6.55% Gains
Nasdaq 100 is pressing fresh 52-week highs ahead of a 60-day late‑May seasonal window that has never posted a loss in the past 15 years, raising the stakes for tech-heavy portfolios.

What is the seasonal pattern for Nasdaq 100 (NDX)?
Nasdaq 100 has risen in 15 of 15 years during this late‑May 60‑day window, with an average gain of 6.55% in winning years.
- 15 for 15 in this window, with average gains of 6.55% across all winning years.
- The upcoming 60-day Nasdaq 100 trading window starts on May 22 and has a 100% Percent Profitable record with 15 winners and 0 losers.
- Average profit of 6.55% compares with a 156% cumulative return across the 15 historical windows.
- The pattern is long-biased, with a Trade Direction of “long,” a TradeWave Ratio of 1.79 and a Sharpe ratio of 1.53.
- Individual years have seen strong upside bursts, including a 16.34% gain in 2020, but some windows carried intraperiod drawdowns of more than 8% before finishing higher.
- Add it up: this late‑May seasonal pattern has delivered steady upside for NDX while still exposing traders to meaningful swings inside the window.
According to historical data from TradeWave.ai, this late‑May stretch has behaved very differently from an average two‑month span for the Nasdaq 100, and the next iteration is just weeks away.
How has Nasdaq 100 (NDX) traded in the late‑May seasonal window?
Nasdaq 100 has booked gains in every single late‑May 60‑day window for the past 15 years, averaging a 6.55% profit for long positions. The next window begins on May 22 and arrives with the index trading at 26,937, about 0.0% below its 52-week intraday high of 26,942.13.[1] For traders who care about historical seasonality, that combination of a clean win streak and a near-record starting point makes this year’s setup hard to ignore.
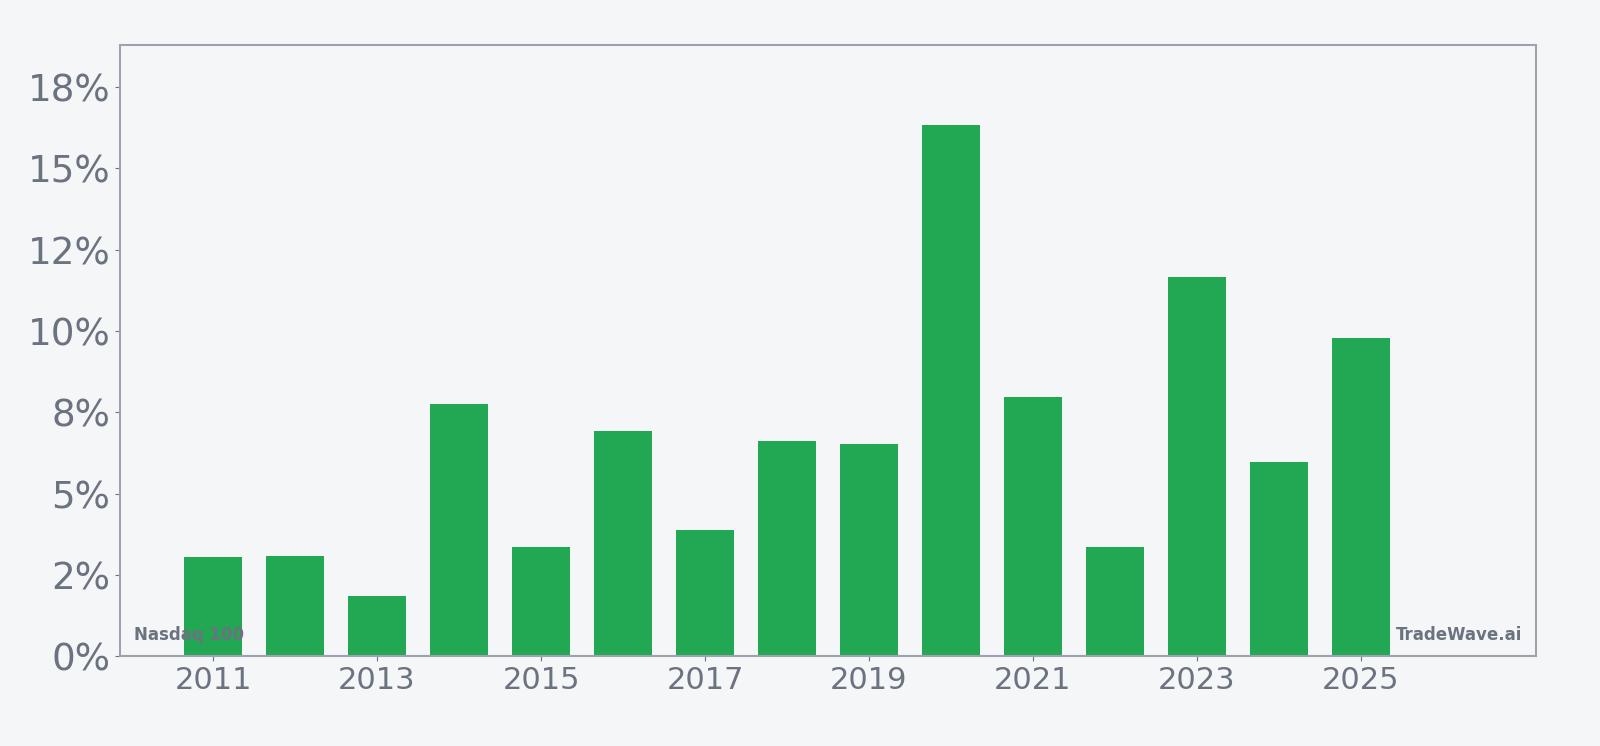
Across the full sample, the pattern is unambiguously long-biased. Percent Profitable sits at 100%, with 15 winners and 0 losers, and the 156% cumulative return across those windows reflects how consistently the index has trended higher in this slice of the calendar. Average gains of 6.55% per window line up closely with the 6.53% median, which tells you the distribution of outcomes has been tight rather than dominated by a single outlier year.
Individual years still show plenty of variation. The strongest recent example came in 2020, when NDX rallied 16.34% between late May and mid‑summer, with a maximum favorable move of 17.58% and only a 2.46% worst drawdown from entry. At the other end of the spectrum, 2017 delivered a modest 3.89% net gain, while 2019 and 2022 both saw the index dip more than 6% and 8% intraperiod before finishing higher, underscoring that even “always up” windows can feel rough in real time.
A second view that layers net returns with peak rallies and worst drawdowns shows how much the index has tended to move inside the window.
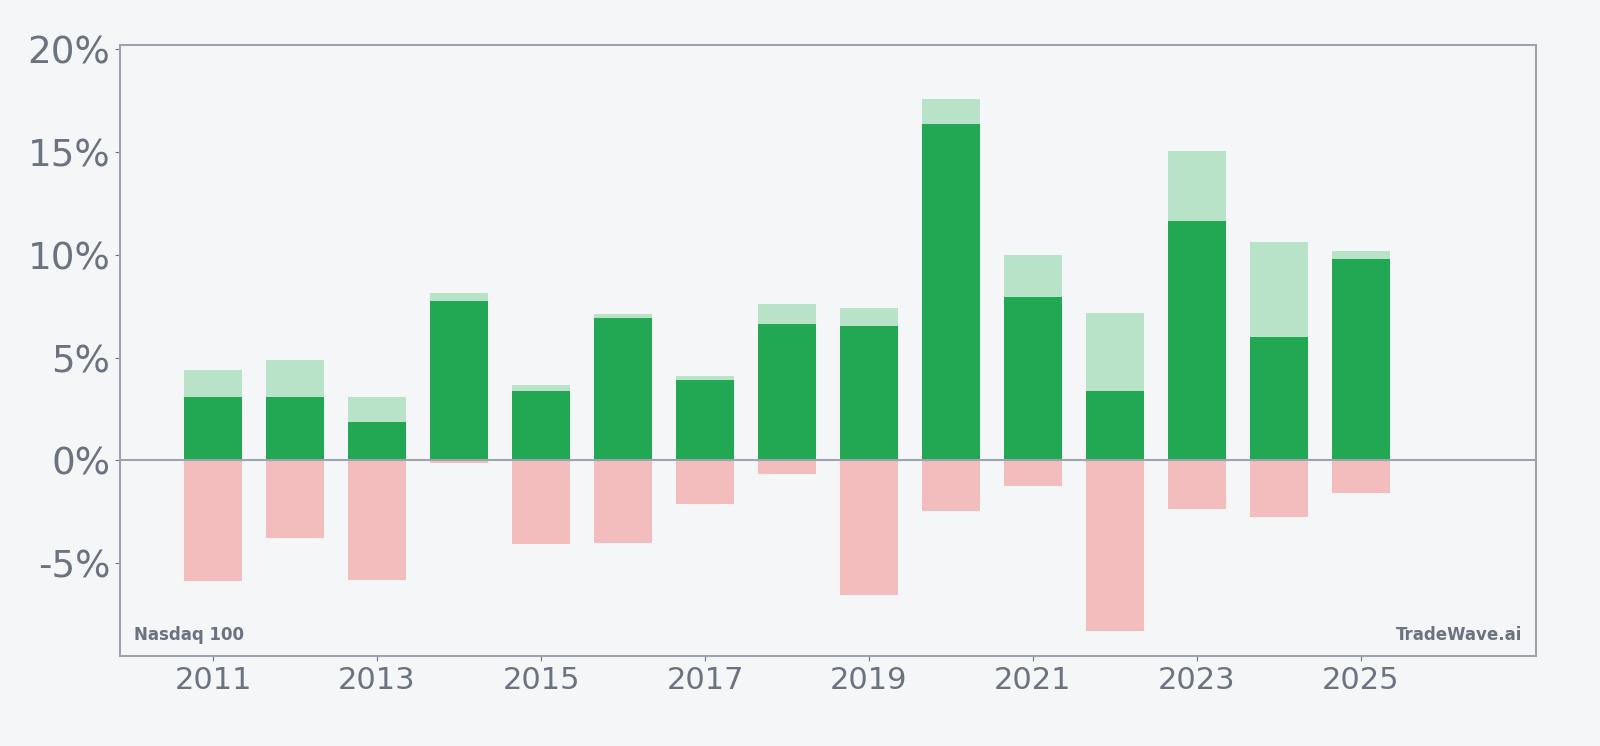
The stacked net / MFE / MAE profile shows a clear pattern: in most years, the best point‑to‑peak move inside the window has exceeded the final net gain, which is what you would expect from a trending but volatile tech index. Maximum adverse excursions have usually been contained to mid‑single digits, but 2019 and 2022 stand out with drawdowns of 6.52% and 8.29% before the trend reasserted itself. For traders, that history suggests the window has rewarded patience on the long side while still demanding tolerance for swings.
History does not guarantee future results; adverse excursions (MAE) can be large even in winning windows.
Why does Nasdaq 100 (NDX) follow this seasonal pattern?
One likely driver is the way the tech earnings calendar and guidance cycle cluster around late spring and early summer, which can reset expectations after first‑quarter results. Institutional portfolio rebalancing and index changes in this period may also favor growth and momentum allocations, especially when risk appetite is strong. The pattern may further reflect options expiration dynamics and systematic strategies that lean into tech leadership as liquidity improves into the middle of the year.
What is driving Nasdaq 100 (NDX) today?
Nasdaq 100 closed at 26,937.28 on Apr 23, up 1.73% on the day and extending a powerful run that has carried it to a fresh 52-week intraday high of 26,942.13.[1] The index has climbed 12.23% over the past month, trading well above its 50-day moving average of 24,846.56 and supported by heavy activity, with roughly 1.09 billion shares changing hands versus a 20-day average volume of about 1.20 billion.[1] That backdrop leaves NDX entering the late‑May seasonal window from a position of strength rather than from a washed‑out base.
The chart below situates the latest move against the past year of trading and overlays the upcoming 60‑day seasonal projection.
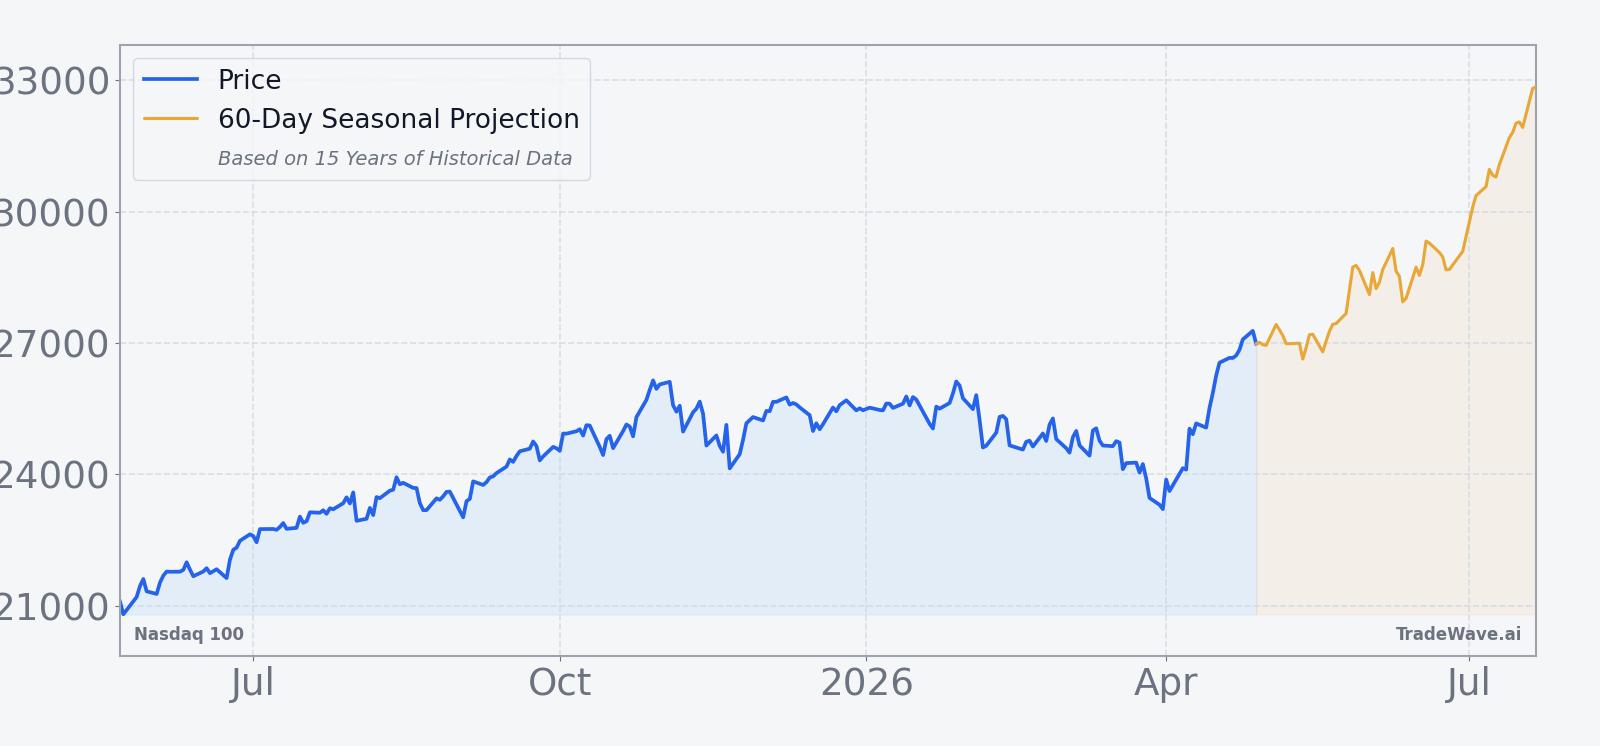
Macro headlines have been quieter than in prior years, but the index’s behavior since mid‑2025 offers useful context. In June 2025, NDX notched a record high close around 22,190 as easing geopolitical tensions and a truce between Israel and Iran helped unwind tariff‑driven risk aversion.[1] That episode showed how quickly the index can pivot from macro stress to record territory, a dynamic that remains relevant as traders weigh whether the current breakout can sustain into another historically strong seasonal stretch.
What should traders watch as this seasonal window approaches?
First, the starting point matters. With NDX already sitting at a 52-week high and more than 8,900 points above its 52-week low of 17,993.24, any pullback into the May 22 start date will tell you whether this year’s window begins from an overextended posture or after a short reset.[1] A shallow consolidation that holds above the 50-day moving average would be more in line with prior strong years than a sharp reversal that undercuts that trend line.
Second, watch how breadth inside the index behaves as the window opens. The historical NDX seasonal trend suggests gains have tended to accrue steadily rather than in a single spike, which usually requires more than just a handful of mega‑caps doing the heavy lifting. If leadership broadens beyond the very largest names during the first few weeks of the window, that would rhyme with the 2013, 2017 and 2020 patterns where rallies were both strong and durable.
Third, volatility inside the window will be as important as direction. Past late‑May stretches have seen maximum adverse moves of up to 8.29% even in years that finished higher, so traders may want to track how quickly any early‑window dips are bought versus allowed to run. A profile that features shallow, short‑lived pullbacks would look more like the smoother 2016 or 2021 paths, while deeper and more persistent drawdowns would echo 2019 or 2022 and could test conviction in the historical pattern.
Finally, macro and policy headlines can still override the calendar. In June 2025, tariff worries and Middle East tensions briefly knocked NDX off course before a diplomatic truce helped restore risk appetite and push the index to new highs.[1] As this year’s late‑May window approaches, traders will be watching for any similar macro shocks that could either amplify or blunt the usual seasonal tailwind.
Sources
About this seasonal analysis
Seasonal pattern data is sourced from TradeWave.ai, which analyzes historical price behavior across annual calendar windows going back up to 30 years. Read the full data methodology or the book The 100-Year Pattern by Afshin Moshrefi (2026 edition). Past performance of seasonal patterns does not guarantee future results. This article is for informational purposes only and does not constitute investment advice.