Nasdaq 100 (NDX) Has Fallen in All Six Midterm Spring Windows Since 2002
Nasdaq 100 is pushing higher again just as a 65-day midterm-year spring window opens that has delivered consistent downside in past cycles, raising the stakes for tech-heavy portfolios.

Key takeaways
- A 65-day seasonal window for Nasdaq 100 tied to midterm election years starts Mar 16 and has historically favored downside moves.
- Across the last 6 midterm election years since 2002, this window has produced losses for NDX in all 6 cases, aligning with a short trade direction.
- Average profit for the short setup in winning years is 6.62%, with cumulative returns of 45% and a Sharpe ratio of 0.94 over the sample.
- Maximum adverse excursions have reached as deep as 24.15% in a single year, showing that rallies against the short side can be sharp before weakness resumes.
- Today NDX closed at 24,709.21, up 1.35% on the day and about 5.6% below its 52-week high, entering this historically soft stretch from a position of strength.
- Unusual options activity flagged in late-summer trading last year points to active positioning in the index, which could amplify volatility if the seasonal pattern reasserts itself.[1]
According to historical data from TradeWave.ai, this midterm-year spring stretch has behaved very differently from a typical month for the Nasdaq 100. The next section walks through how that pattern has played out across the last six comparable election-cycle years.
Seasonal window
Nasdaq 100 has declined in all 6 midterm election years during this 65-day spring window since 2002, with an average short-side profit of 6.62%. The window begins Mar 16 and runs for roughly three months, opening with the index about 5.6% below its 52-week high of 26,182.10 and still near record territory after a 1.35% gain today. Unusual options activity highlighted in a broad market overview last August showed traders leaning into tech volatility, a backdrop that could matter if this pattern repeats in a crowded trade environment.[1]
The pattern is built on the last 6 midterm election years, a phase of the presidential cycle that often brings policy uncertainty, budget fights and shifting expectations for regulation. Grouping by this cycle matters because tech leadership has increasingly been tied to the policy calendar, from antitrust scrutiny to AI-related spending, and those crosscurrents tend to cluster in midterm years rather than in a typical calendar slice.
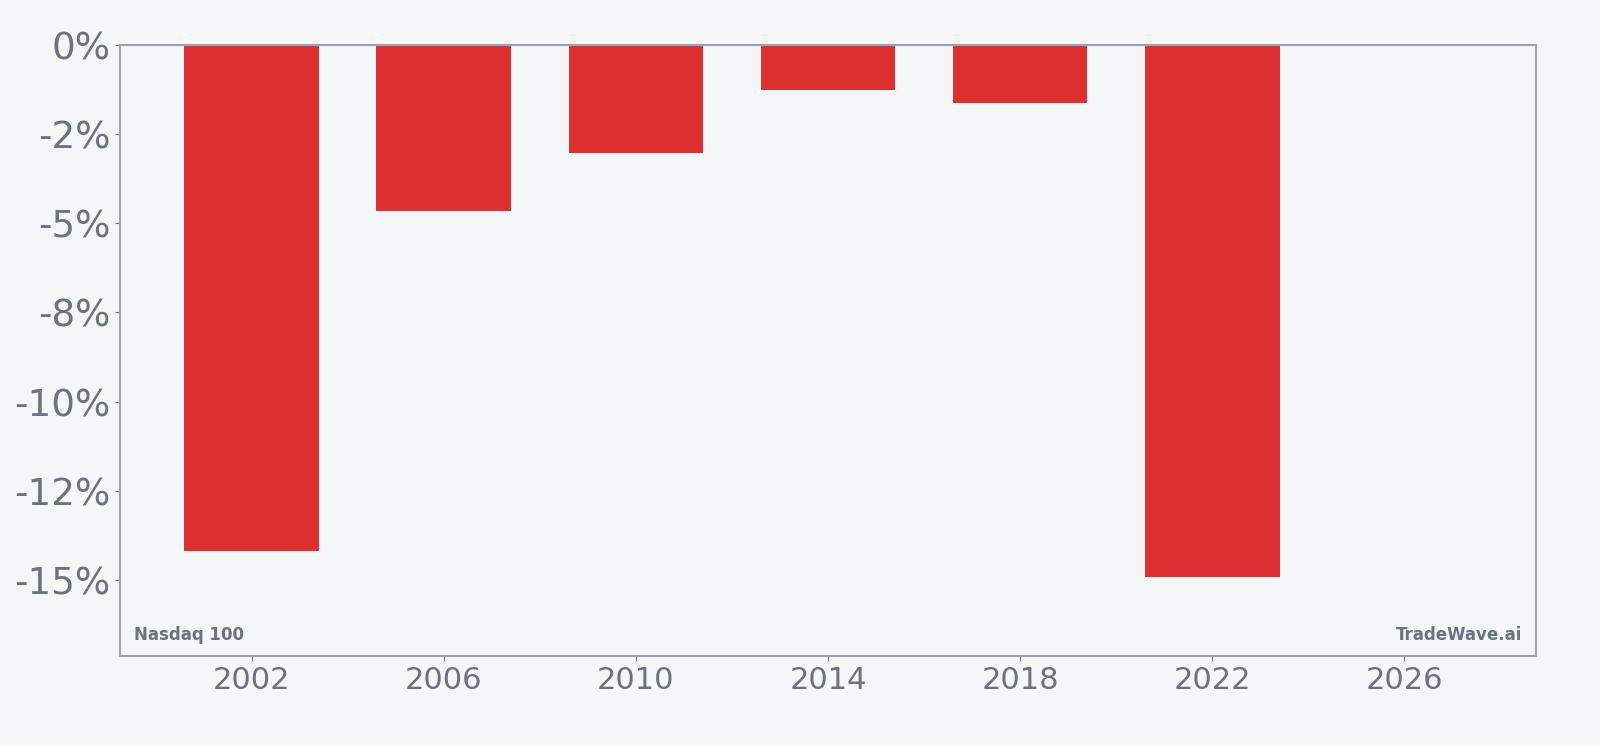
Historically, this window has been a clean short pattern. Percent Profitable is 100%, with 6 winners and 0 losers, and the cumulative return across those trades is 45%. Average profit of 6.62% for the short side means that in a typical midterm-year spring, NDX has finished the window meaningfully lower than where it started, even though the index has often been in a broader bull market across the cycle.
The per-year breakdown shows how that has played out. The strongest year for the short setup was 2022, when NDX fell 14.91% from entry to exit, with a maximum favorable move of 9.38% in the trade direction and a maximum adverse move of 16.23% against it. The weakest winning year was 2014, when the net decline was just 1.28% and the index briefly moved 1.5% against the short before rolling over.
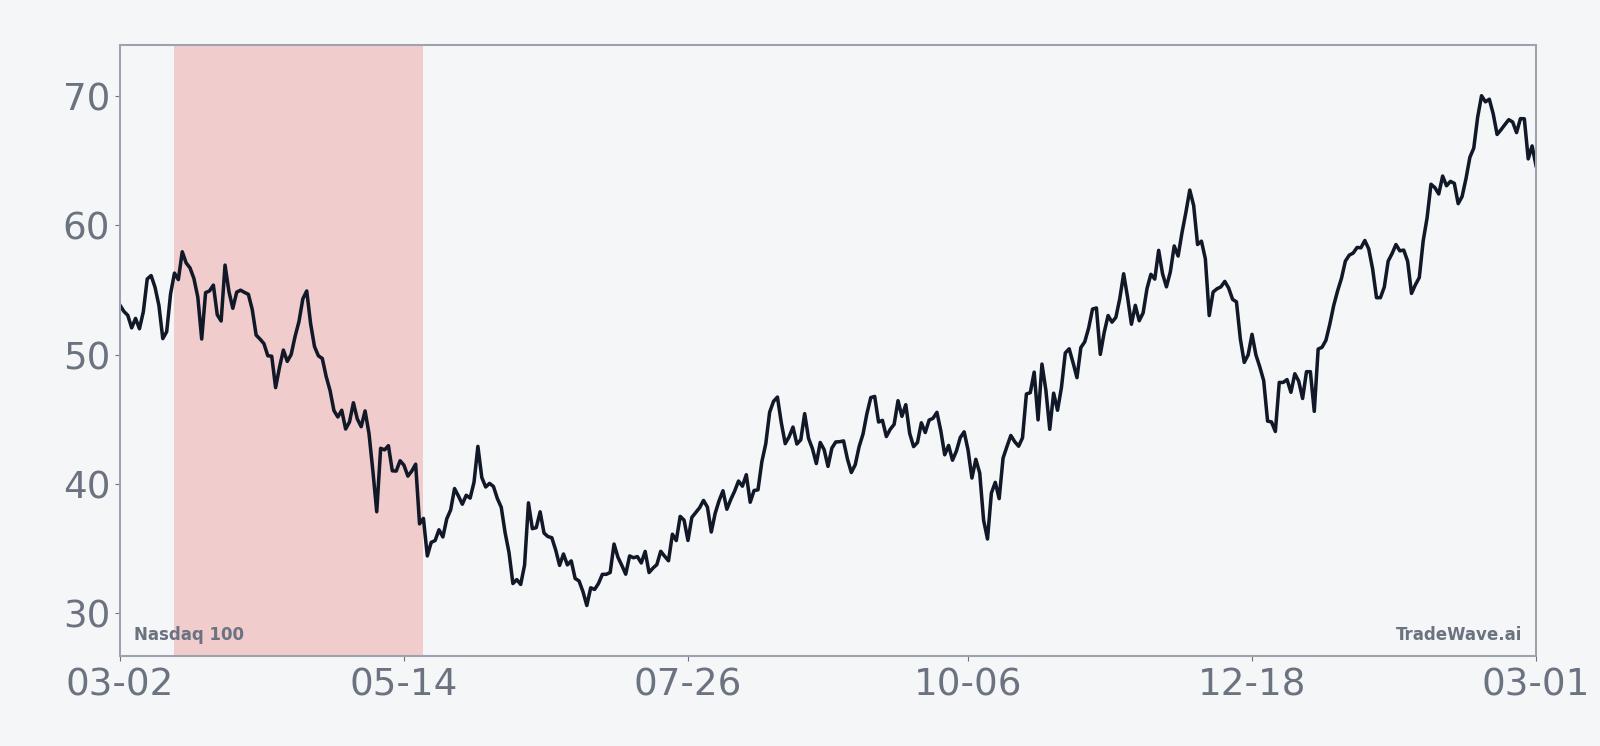
The historical seasonal trend line slopes lower through much of the window, with weakness often clustering after the first couple of weeks. The typical pattern shows NDX chopping early, then sliding more decisively into the back half of the period, which is consistent with policy and earnings headlines building as midyear approaches in midterm cycles.
A combined view of net returns and intraperiod swings shows how far NDX has tended to travel in both directions before the window closes.
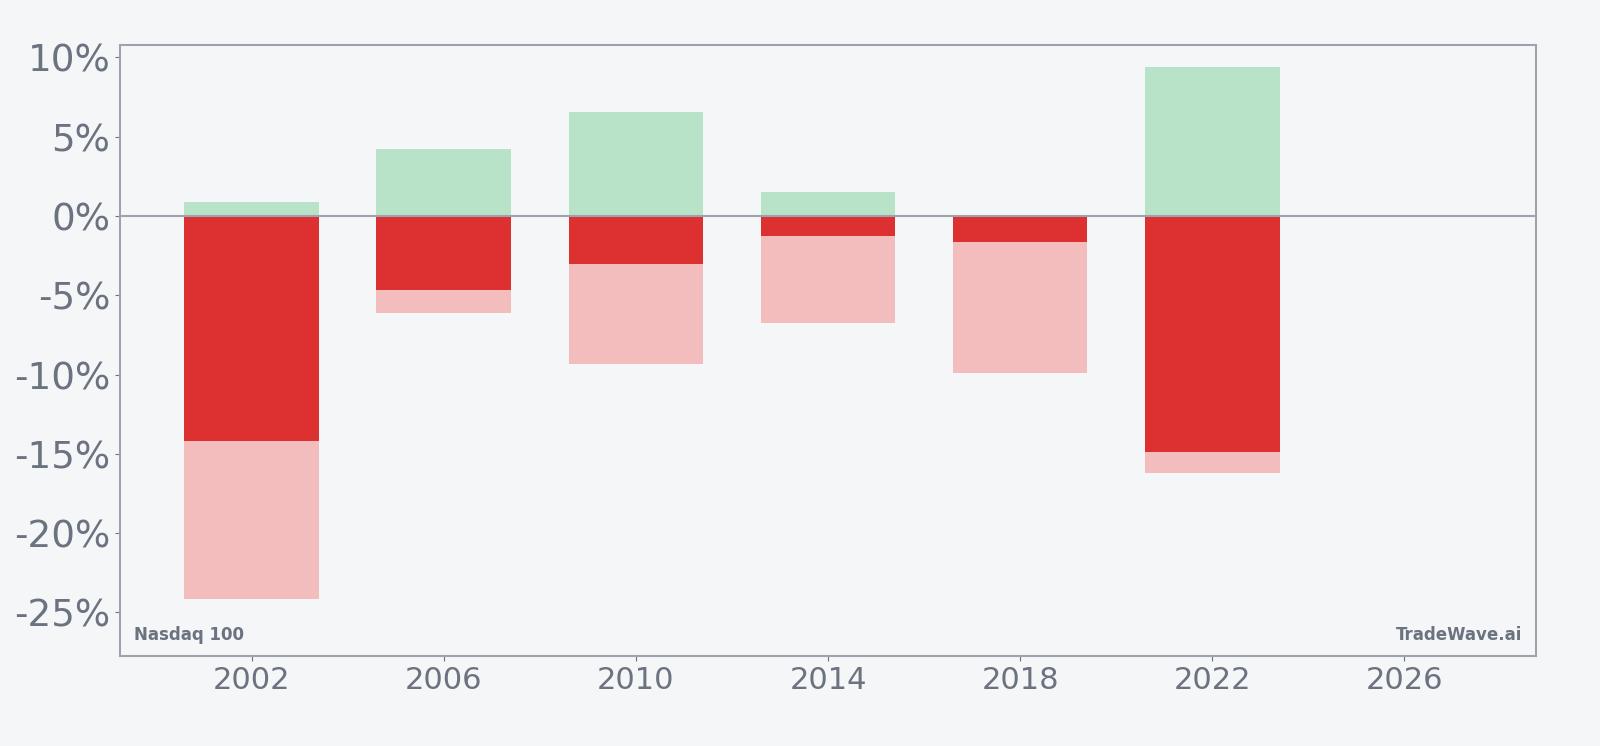
The bars with maximum favorable and adverse excursions underline the trade-off. In 2002, for example, the short setup ultimately profited 14.19%, but NDX first rallied enough to register a 0.88% move against the trade and then sank far enough to show a 24.15% adverse excursion from the index’s perspective. Across the sample, large favorable moves for shorts have often come with sizable countertrend rallies, which is why the TradeWave Ratio of 1.65 points to meaningful travel in the trade direction but not without noise.
History does not guarantee future results, and even in a window where every past instance has been profitable for the short setup, adverse excursions within the period have sometimes been large.
Price and near-term drivers
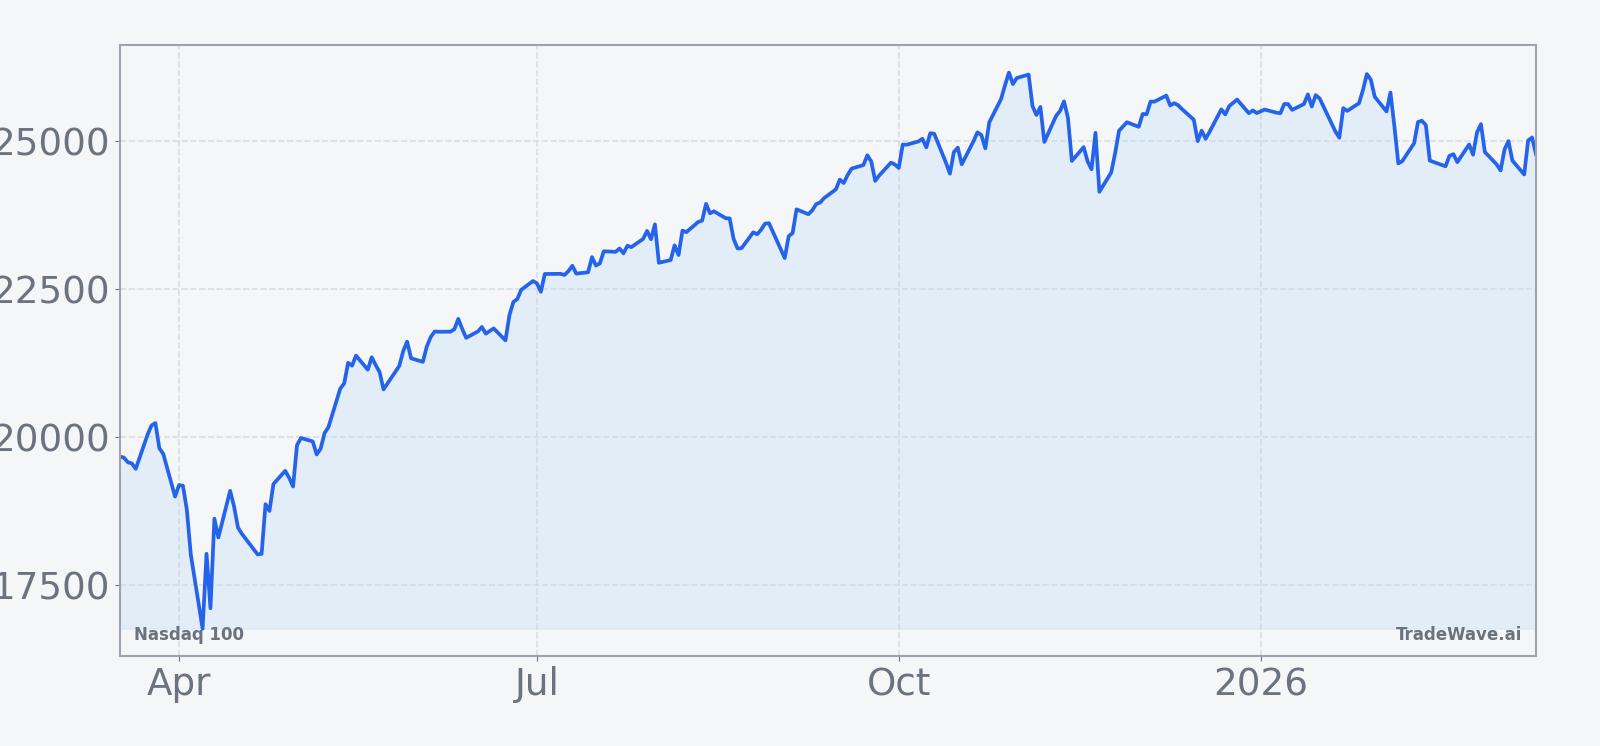
Nasdaq 100 closed Monday at 24,709.21, up 328.48 points or 1.35% on the day, with intraday trading confined to a relatively tight band between 24,614.61 and 24,721.66. The index sits about 5.6% below its 52-week high of 26,182.10 and well above its 52-week low of 16,542.20, underscoring how strong the broader uptrend has been heading into this historically weak midterm-year stretch.
Volume over the last 20 sessions has averaged roughly 5.98 billion shares across the index’s constituents, a reminder that liquidity remains deep even as leadership has narrowed. The 50-day simple moving average stands at 25,228.63, slightly above today’s close, so NDX is entering the window just under a key trend gauge rather than in a deeply oversold state. That positioning matters because prior midterm-year windows have often started from elevated levels, leaving room for mean reversion without necessarily breaking the longer-term bull trend.
In June 2025, NDX notched a record high close as easing geopolitical tensions and a truce between Israel and Iran helped unwind tariff-driven selling, showing how quickly macro headlines can swing sentiment in this index.[2] Later that year, a rare technical pattern that had appeared only six times since 1975 was flagged as a precursor to further highs, reinforcing the idea that structural demand for large-cap tech remains powerful even when short-term seasonality turns negative.[2] Against that backdrop, unusual options activity cited in an August 2025 market overview suggested traders were already using derivatives to express views on tech volatility rather than simply buying and holding the index.[1]
Nasdaq 100 remains a central driver of global risk appetite, and its current strength keeps the broader market leaning bullish into this midterm-year spring. Even so, the seasonal record for this specific window has repeatedly shown downside risk for the index, with several years featuring double-digit declines from entry to exit. Because NDX is so heavily weighted toward mega-cap tech, any repeat of that pattern would likely ripple through growth stocks, AI beneficiaries and high-duration assets more broadly.
The chart below situates the latest move in its recent multi-month context.
Macro and policy backdrop
The current phase of the presidential election cycle is the midterm election year, a period that has historically delivered a two-playbook pattern for US equities. Early in the year, markets often wrestle with fiscal debates, regulatory pushes and shifting expectations for the next presidential race, which can weigh on risk assets even when the economy is expanding. Later in the cycle, especially as the calendar transitions into the year before the presidential election, equities have tended to find a stronger footing as policy paths become clearer and liquidity conditions stabilize.
For Nasdaq 100, that means this 65-day spring window sits in the choppier part of the midterm year, before any potential tailwind from the historically strong midterm-to-pre-election regime kicks in. Tech and communication services names are particularly sensitive to regulatory rhetoric around antitrust, data privacy and AI, as well as to any shifts in tax policy that affect buybacks and capital spending. Even without fresh headlines today, the memory of tariff scares and geopolitical shocks in 2025 is still close enough that traders are quick to hedge when volatility windows like this one open.[2]
Looking ahead, the policy calendar is dense. Budget negotiations, central bank communication on the path of rates and early positioning for the 2028 presidential race will all intersect with this window. If history is a guide, that mix has often produced air pockets in NDX rather than smooth climbs, especially when valuations are rich and positioning is crowded.
What to watch in this window
For the next 65 trading days, the key test is whether NDX respects or defies its midterm-year script. On the price side, watch how the index behaves around the 25,228.63 level, which marks the 50-day moving average. Sustained trading below that line would be more consistent with prior midterm-year springs, while a decisive break back above it and toward the 26,182.10 high would signal that the current cycle is overpowering the historical pattern.
Macro-wise, monitor the cadence of policy headlines and central bank commentary. Sharp intraday swings around budget talks, regulatory announcements or rate expectations would fit the historical profile of a window where maximum adverse excursions have been sizable even in ultimately profitable short years. If volatility clusters around those events, it would echo the way past midterm springs have traded.
Options flow is the other key tell. The unusual options activity flagged in August 2025 showed that traders were already using derivatives to lean into Nasdaq volatility rather than simply riding the trend.[1] If this window sees a renewed build-up in put buying, skew or short-dated hedges, it would suggest that institutional players are again bracing for a pattern-consistent pullback. On the other hand, a fade in that activity, combined with steady demand for upside calls, would argue that the market is willing to look through the seasonal record.
Finally, track how any weakness is distributed under the hood. In prior midterm-year springs, the heaviest pressure has often fallen on the most extended growth names, even when the broader index held up. If this window brings rotation out of mega-cap tech into more defensive or value-oriented sectors, it would align with the historical tendency for NDX to struggle in this slice of the calendar, even as the longer election cycle remains supportive into the following year.
Sources
- [1] Seeking Alpha, "Stock market news today: Nasdaq slides 1% as chip stocks weigh" (Aug 29, 2025).
- [2] Reuters, "Nasdaq 100 notches first record high close since February" (Jun 24, 2025).