CBOE Volatility Index (VIX) Has Dropped in Every Early-May 73-Day Window, Averaging 14.58% Short Profits
CBOE Volatility Index is heading into a 73-day early‑May seasonal window that has consistently seen volatility compress, even as VIX trades far below its 52-week high.

What is the seasonal pattern for CBOE Volatility Index (VIX)?
CBOE Volatility Index has fallen in 10 of 10 years during this early‑May 73‑day window, with an average 14.58% gain for short positions in winning years.
- 10 for 10 in this window, with short VIX trades averaging 14.58% profit across winning years.
- Seasonal window runs from May 2 for 73 trading days and has historically favored lower VIX levels.
- Percent Profitable is 100%, with 10 winners and 0 losers for the short-volatility setup.
- Annualized return across the window is 14.39%, with a Sharpe ratio of 1.97 for end‑of‑window outcomes.
- TradeWave Ratio of 2.88 signals that VIX typically travels meaningfully in the trade direction within the window.
- Intraperiod swings have been large, with both sharp volatility spikes and deep drawdowns before VIX usually settles lower by the end.
According to historical data from TradeWave.ai, this upcoming stretch has behaved very differently from an average summer for volatility. TradeWave.ai’s multi‑year seasonal work flags the early‑May window as one of the most consistently VIX‑negative periods on the calendar.
Seasonal window
CBOE Volatility Index has dropped in every single early‑May 73‑day window for the past decade, rewarding short‑volatility positions 10 years in a row. Today VIX sits at 17.48, down 2.6% on the session and about 50.5% below its 52‑week high of 35.30.[1] That combination of a historically bearish VIX seasonal trend and a still‑elevated level versus last year’s floor gives equity traders a clear volatility line to watch as May approaches.
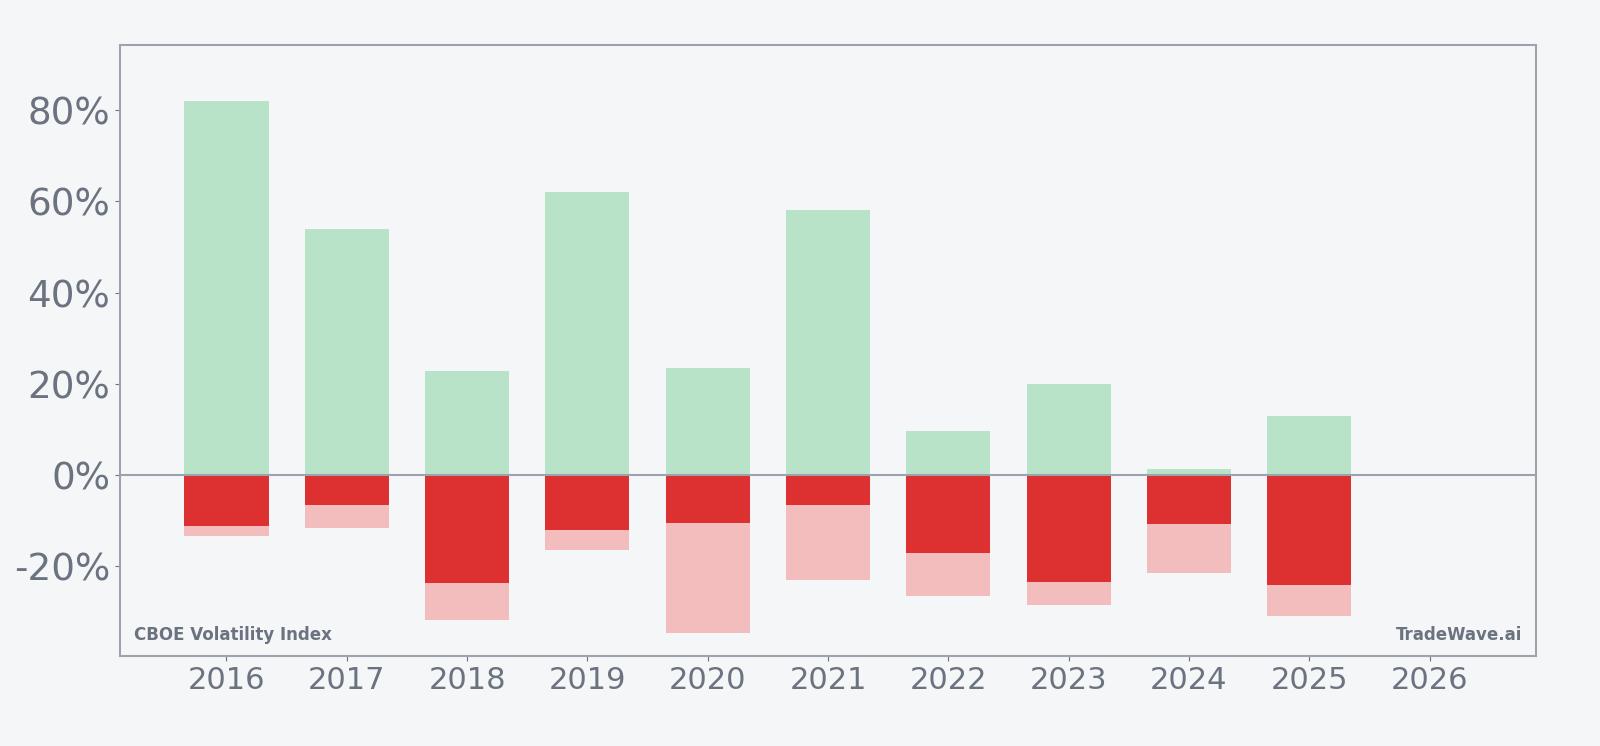
Stacked net, best‑case, and worst‑case moves by year show how far VIX has tended to swing before finishing lower.
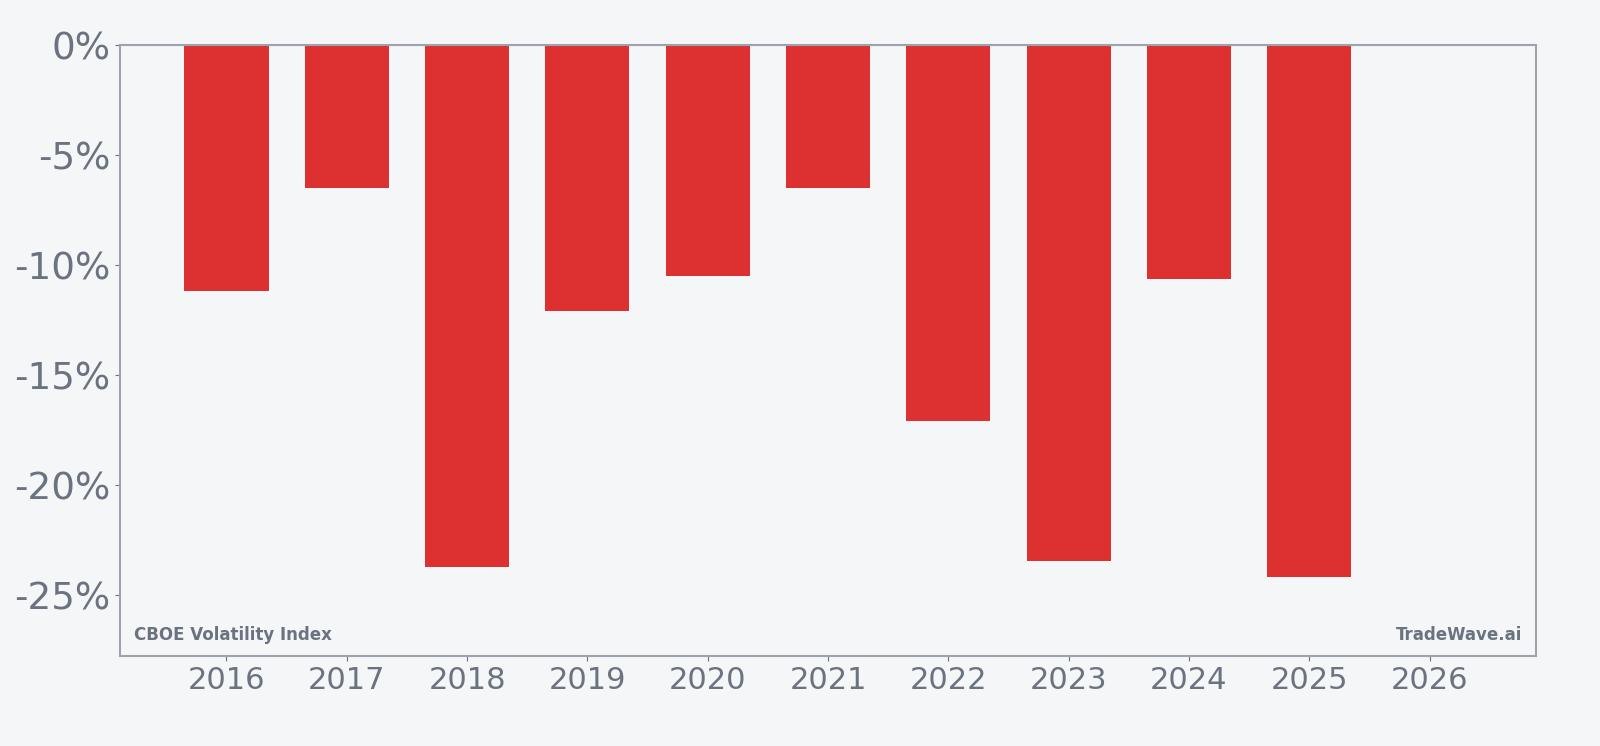
Historically this window has been a clean short‑volatility regime. The trade direction is explicitly short, and every one of the past 10 years finished the 73‑day stretch with VIX lower than where it started, producing a 100% win rate for that stance. Average profit across those winning years is 14.58%, with a median move of 11.62%, so the typical outcome has been a double‑digit slide in implied volatility rather than a marginal drift.
The per‑year breakdown shows that even the “milder” years delivered meaningful downside in VIX. The smallest net decline in the sample was 6.50% in 2021, while the largest drops, such as 24.16% in 2025 and 23.73% in 2018, underline how aggressively volatility has tended to compress once this window gets going. Add it up and the cumulative return for the short‑VIX pattern across the decade is 283%, with an annualized return of 14.39% and a Sharpe ratio of 1.97, which is unusually strong for a volatility index.
The intraperiod swings are where this seasonal pattern gets more nuanced. Maximum favorable excursions, which track the best point‑to‑peak move in the trade direction, have been large in several years: 82.02% in 2016, 62.14% in 2019, and 58.00% in 2021. Those numbers show that when VIX starts to break lower in this window, it can do so in powerful bursts that reward staying with the trend.
Maximum adverse excursions, the worst drawdowns from entry, have also been significant. In 2020 VIX moved 34.56% against the short before ultimately finishing the window down 10.51%, and in 2025 the worst intraperiod move was a 30.78% spike higher even though the final result was a 24.16% decline. That mix of big positive and negative swings is exactly what the TradeWave Ratio of 2.88 is flagging: VIX tends to travel a long way in both directions before settling lower by the end of the window.
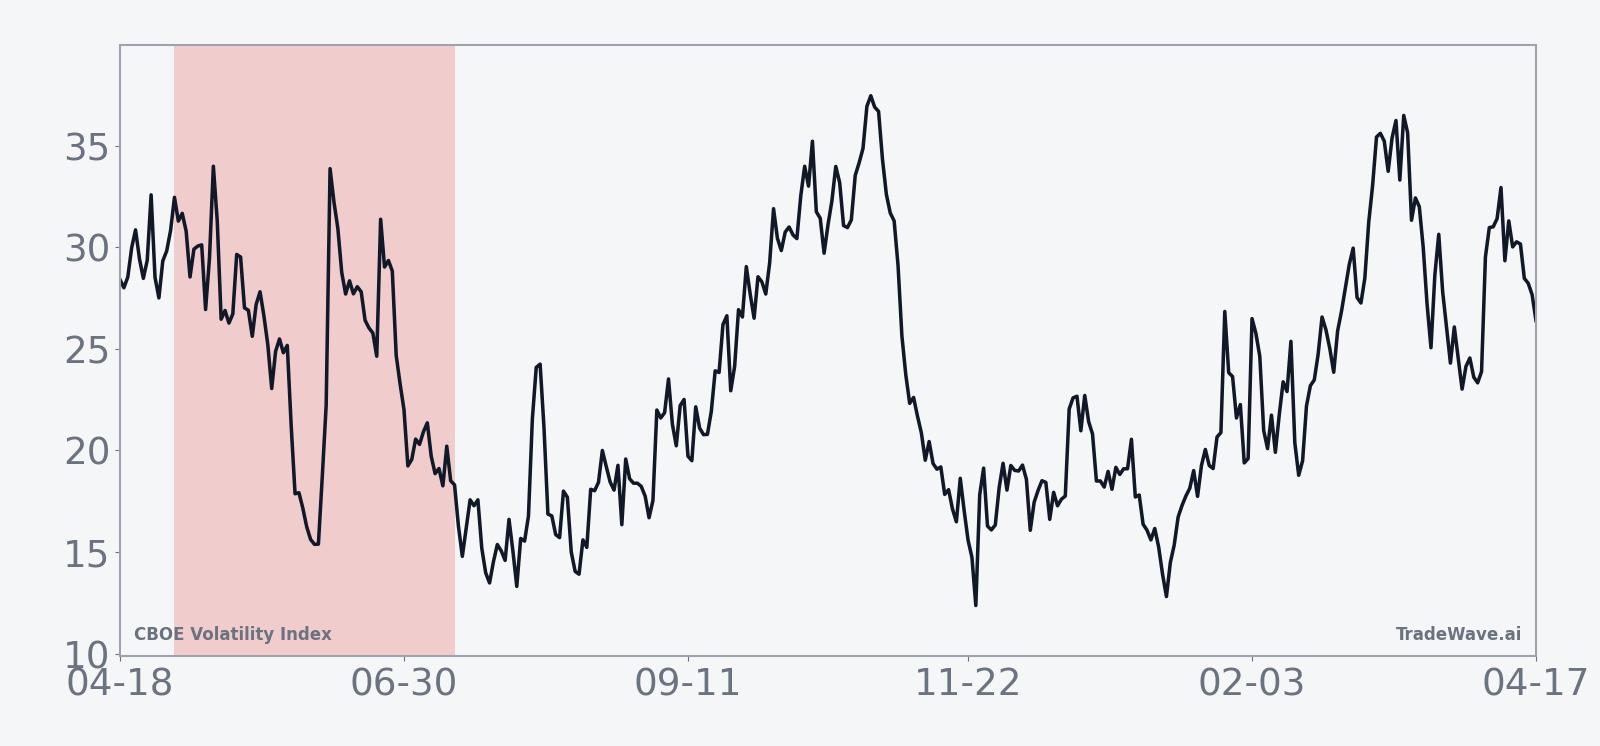
The trend chart suggests that the typical seasonal path is not a straight line. On average, VIX has tended to stay choppy early in the window, with volatility spikes often clustering in the first few weeks, before a more persistent grind lower into the back half. The cumulative return profile slopes steadily in favor of the short side, but the bars with maximum favorable and adverse moves make clear that timing and risk management have mattered as much as direction.
Looking at individual years reinforces that message. In 2018, for example, VIX delivered a 22.79% maximum favorable move for shorts but also a 31.68% worst drawdown from entry, a reminder that even “good” seasonal years for this pattern have included sharp volatility scares. In contrast, 2024 saw a relatively modest 1.36% best move and a 21.53% worst drawdown, yet still ended with a 10.63% decline in VIX, showing how the index can grind lower even when intraperiod spikes dominate the headlines.
Ten for ten is a rare record for any seasonal pattern, let alone for a volatility index that usually defies tidy rules. The key takeaway is simple: over the past decade, this early‑May 73‑day stretch has consistently rewarded traders positioned for lower VIX by the end of the window, while demanding a strong stomach for large interim swings.
Why does CBOE Volatility Index (VIX) follow this seasonal pattern?
One likely driver is the way equity markets transition from first‑quarter macro and policy shocks into a quieter summer period, which often brings calmer price action and lower implied volatility. Analysts have pointed to institutional portfolio rebalancing after the first half, along with the spacing of major earnings seasons and options expirations, as factors that can drain demand for downside protection into June and July. This pattern may also reflect how geopolitical and policy headlines tend to cluster earlier in the year, leaving this window as a catch‑down phase where VIX gives back prior spikes as risk appetite rebuilds.
History does not guarantee future results; adverse excursions can be large even in winning windows, and VIX has repeatedly spiked sharply before ultimately finishing this seasonal stretch lower.
What is driving CBOE Volatility Index (VIX) today?
CBOE Volatility Index slipped 2.6% to 17.48 on Monday, extending a pullback that has left it about 50.5% below its 52‑week high of 35.30 and roughly 30.6% above its 52‑week low of 13.38.[1] That level keeps VIX in a mid‑teens band that traders often associate with a “normal” risk environment, rather than the panic readings seen during major macro shocks. In calm equity markets, implied volatility typically compresses as demand for protection fades, but the index’s distance from last year’s lows suggests there is still some residual hedging in the system.
The chart below situates the latest move in its recent multi‑month context, alongside a 60‑day seasonal projection.
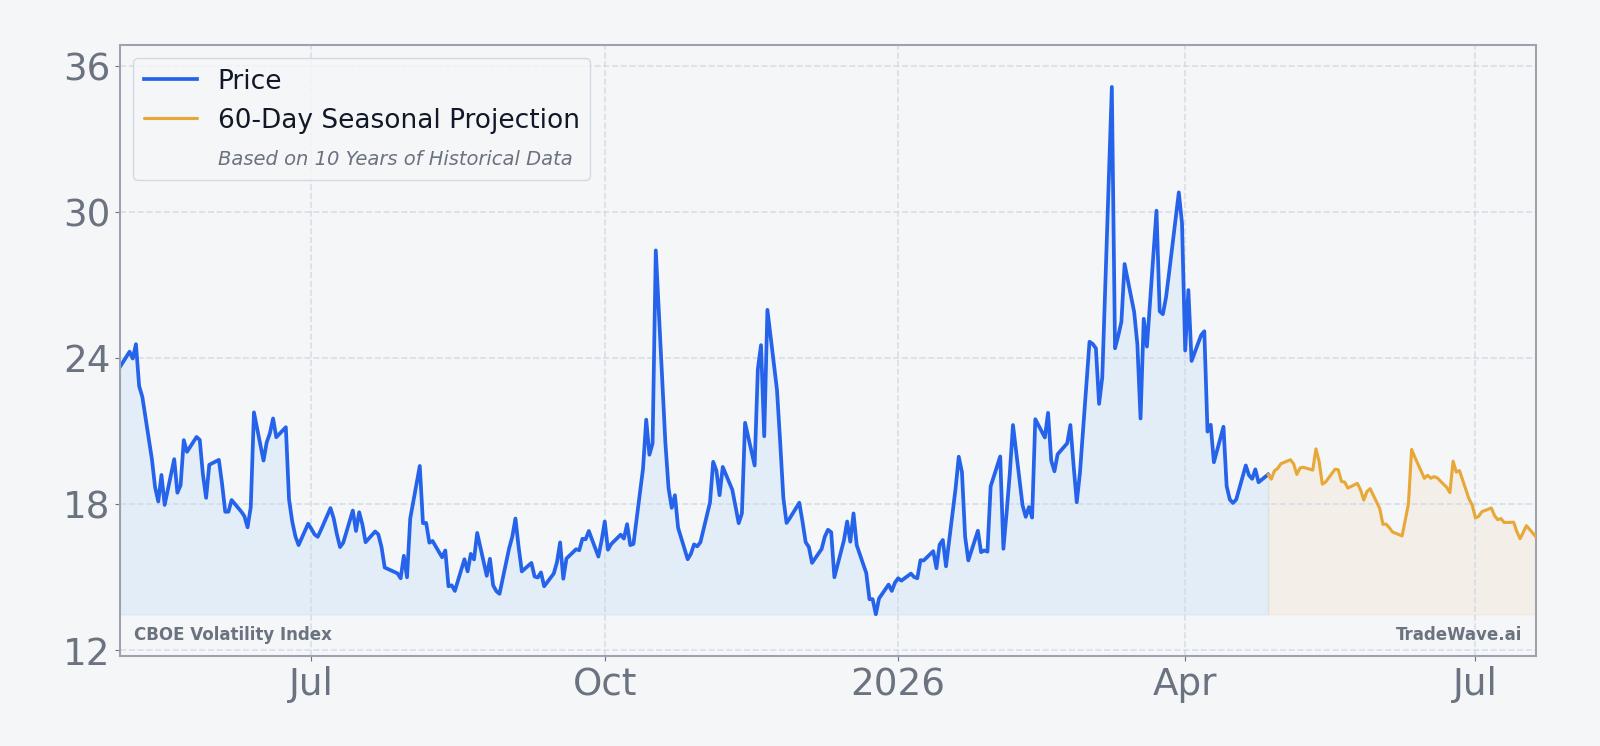
Macro shocks have repeatedly reset the volatility backdrop over the past two years, from trade tensions to geopolitical flare‑ups. In 2025, trade‑war headlines and tariff threats pushed VIX above 40 for the first time since 2020, driving a surge in hedging and speculative activity in volatility products.[2] Those episodes showed how quickly the index can jump from a mid‑teens base to crisis territory when policy risk or geopolitical stress hits, even if the longer‑term seasonal tendency points toward lower readings into the summer.
During that 2025 trade‑war spike, some investors leaned into VIX options strategies that tried to monetize the swings rather than simply hedge them.[2] In that environment, traders used VIX put options to position for volatility to mean‑revert lower after extreme moves, effectively betting that spikes would fade once the immediate shock passed.[2] That playbook lines up with the historical early‑May seasonal pattern, where VIX has often started the window elevated after a prior scare and then bled lower over the following two to three months.
Looking ahead to this year’s window, the key question for volatility desks is whether macro risk will cooperate with the calendar. The historical pattern does not require a perfectly calm backdrop; several of the strongest seasonal years for short VIX came after sizable spikes early in the window. What has mattered in the past decade is that, by the end of the 73‑day stretch, those spikes have usually been fully retraced or more, leaving VIX meaningfully lower than where it began.
What should traders watch in this VIX seasonal window?
Three things will matter most as the May 2 window opens. First, watch where VIX is trading relative to its 52‑week band: a move back toward the low‑teens floor would signal that the usual seasonal compression is already well advanced, while a rebound toward the low‑20s would leave more room for the historical short‑volatility pattern to play out.[1] Second, monitor macro headlines around trade policy and geopolitical risk, which have been the main catalysts for the biggest intraperiod spikes in prior years.[2] Finally, keep an eye on how quickly any volatility shock is retraced; in past cycles, the seasonal window has often turned sharp early spikes into opportunities for VIX to grind lower into late June and July.
If options traders again lean into strategies that sell volatility after large jumps, as they did during the 2025 trade‑war episode, the follow‑through in VIX options volume and positioning will be an important tell.[2] Persistent demand for VIX puts and structured trades that benefit from volatility decay would echo the historical pattern of spikes fading within this window, while a shift toward sustained call buying and elevated hedging would signal that macro risk is overwhelming the usual seasonal pull. Either way, the next 73 trading days are set up as a key test of whether one of the cleanest VIX seasonal trends on the calendar can extend its 10‑year streak.
Sources
About this seasonal analysis
Seasonal pattern data is sourced from TradeWave.ai, which analyzes historical price behavior across annual calendar windows going back up to 30 years. Read the full data methodology or the book The 100-Year Pattern by Afshin Moshrefi (2026 edition). Past performance of seasonal patterns does not guarantee future results. This article is for informational purposes only and does not constitute investment advice.