Nasdaq 100 (NDX) Heads Into 60-Day Late-May Run With 100% Win Rate Over 15 Years
Nasdaq 100 is pressing above its 52-week high as it heads into a 60-day late‑May seasonal window that has never posted a loss in the past 15 years, raising the stakes for tech‑heavy index traders.

What is the seasonal pattern for Nasdaq 100 (NDX)?
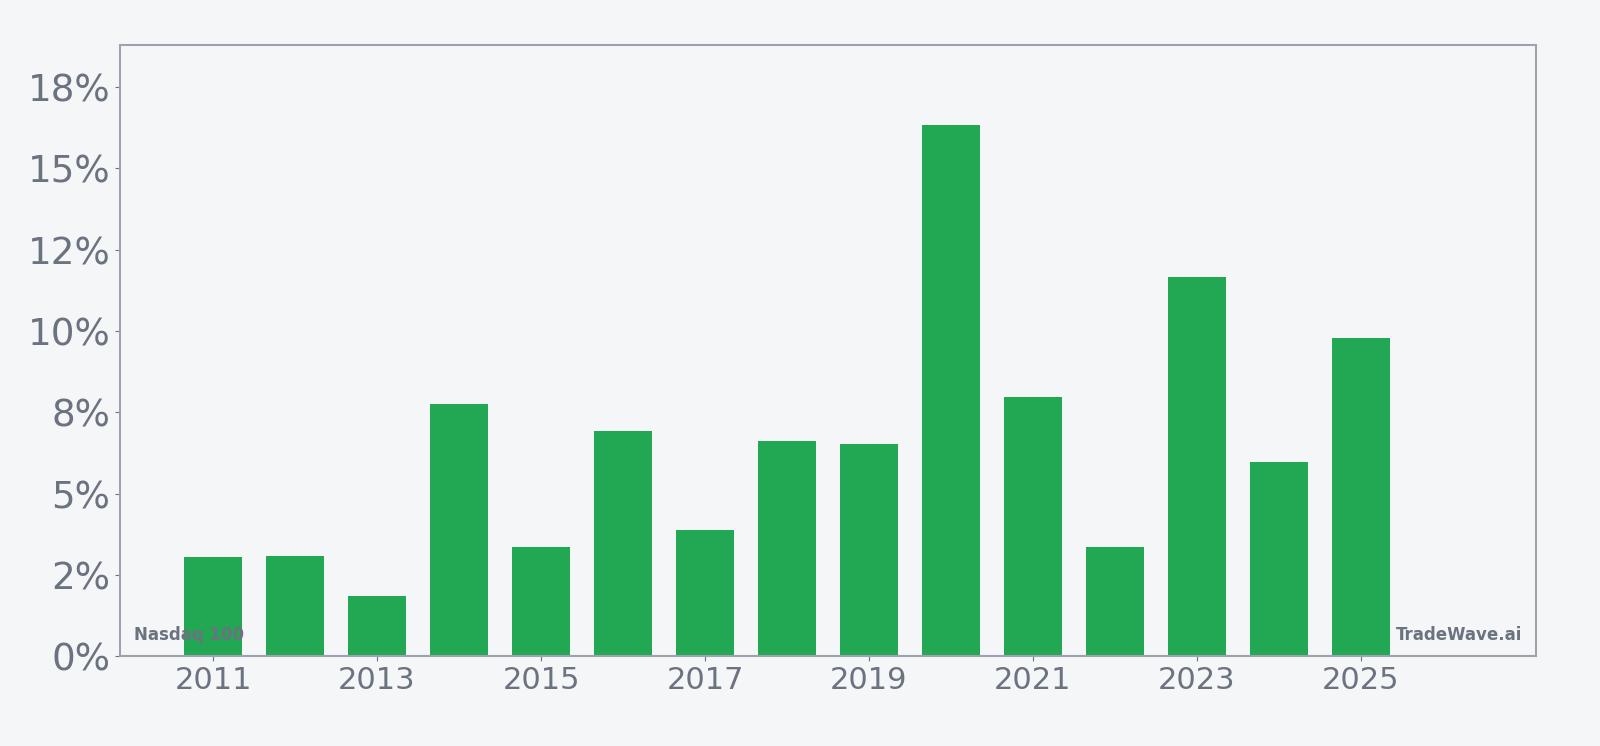
Nasdaq 100 has risen in 15 of 15 years during this late‑May 60‑day window, with an average gain of 6.55% in winning years.
- 15 for 15 in this window, with Nasdaq 100 averaging 6.55% gains in winning years across the past 15 cycles.
- The upcoming pattern runs from May 22, 2026 and spans 60 trading days, forming a historically bullish Nasdaq 100 seasonal trend into mid‑summer.
- Percent Profitable is 100%, with 15 winners and 0 losers over the lookback period.
- Trade Direction is long, supported by a TradeWave Ratio of 1.79 and a Sharpe ratio of 1.53 for this specific Nasdaq 100 trading window.
- Individual years have seen strong upside bursts, including a 16.34% gain in 2020, but some windows still experienced intraperiod drawdowns before finishing higher.
- Add it up: the cumulative return across these 15 late‑May windows is 156%, underscoring how consistently this slice of the calendar has favored Nasdaq 100 bulls.
According to historical data from TradeWave.ai, this late‑May stretch has behaved very differently from an average month on the Nasdaq 100 calendar, and the next iteration is about to open again.
How strong is the late‑May seasonal window for Nasdaq 100 (NDX)?
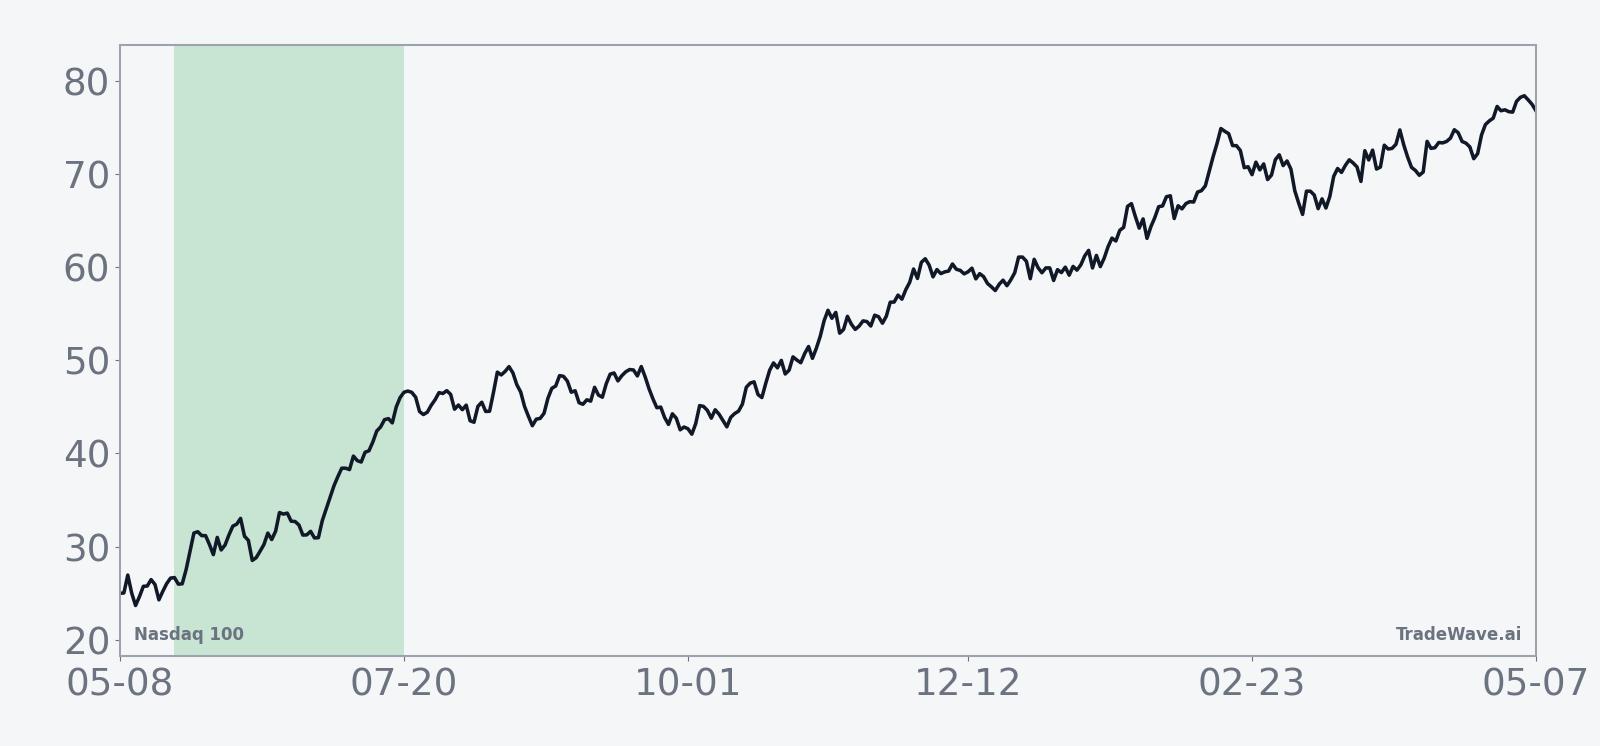
Nasdaq 100 has booked gains in every single late‑May 60‑day window for the past 15 years, averaging 6.55% per cycle for long positions. The index last closed at 28,015.06, up 1.31% on the day and sitting about 2.1% above its 52‑week high of 27,315.23, a rare spot where price is already in breakout territory as a historically bullish window approaches.
Historically, this Nasdaq 100 trading window has been a clean long setup. Percent Profitable sits at 100%, with 15 winners and 0 losers, and the average gain of 6.55% lines up closely with the 6.53% median, which suggests the wins are not just a couple of outliers. The cumulative return across all 15 windows is 156%, and the annualized return for this slice of the calendar is 6.49%, which is notable given that it covers only 60 trading days each year.
The per‑year breakdown shows how this late‑May seasonal pattern has played out in different market regimes. In 2020, during the post‑pandemic rebound, the window delivered a 16.34% net gain with a maximum favorable move of 17.58% from entry before any giveback. In contrast, 2017 was a quieter year, with a 3.89% net return and a 4.09% peak run‑up, still positive but more muted than the standout cycles.
Intraperiod swings have been very real even in winning years. The worst drawdown inside the window came in 2022, when the maximum adverse move reached 8.29% below the entry level before the index recovered to finish the period up 3.37%. Several other years, including 2016 and 2019, saw adverse excursions of more than 4% and 6% respectively, reminding traders that this bullish seasonal tendency has not been a straight line.
The trend statistics back up the directional bias. Trend Long is 81 and Trend Long1 is 89, while both short‑side trend measures are zero, which means that in most years the path inside the window has leaned upward rather than chopping sideways. The Sharpe ratio of 1.53 for this specific seasonal slice points to a favorable risk‑adjusted profile based on end‑of‑window outcomes, even after accounting for those mid‑window dips.
Year‑by‑year net returns and intraperiod swings round out the picture of how much upside and downside this window has historically packed in.
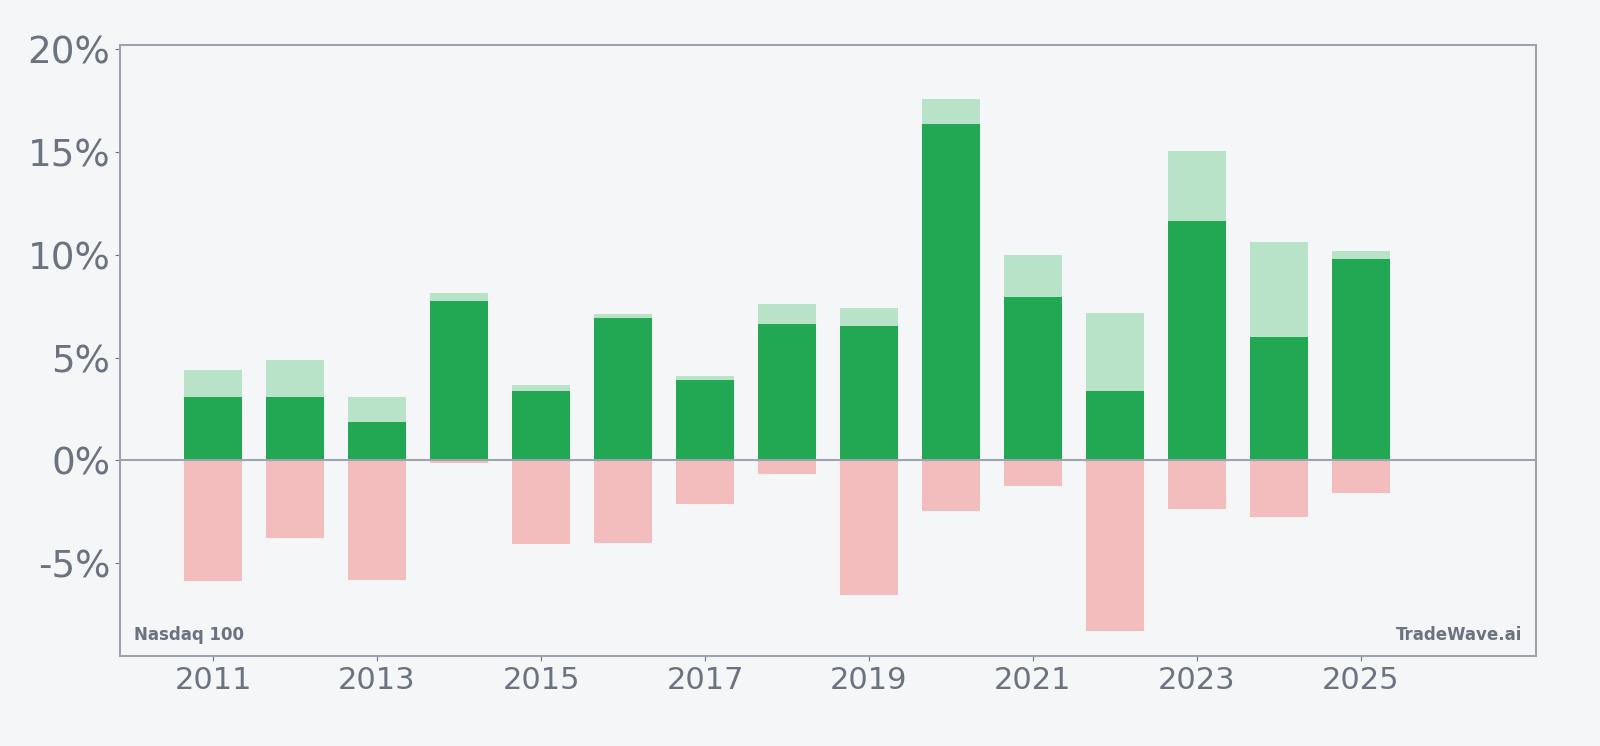
The stacked view of net results, peak run‑ups and worst drawdowns highlights a key feature of this Nasdaq 100 seasonal pattern: upside persistence with meaningful volatility. Many years show maximum favorable moves in the 7% to 10% range, while maximum adverse moves often sit between 2% and 6%, and occasionally deeper. For traders, that combination has historically rewarded patience in the direction of the trend but punished tight stops during mid‑window shakeouts.
History does not guarantee future results; adverse excursions can be large even in winning windows, and past seasonal strength does not ensure similar outcomes in 2026.
Why does Nasdaq 100 (NDX) follow this seasonal pattern?
This late‑May Nasdaq 100 seasonal pattern may reflect a cluster of tech earnings revisions, index rebalancing and institutional portfolio repositioning that often follow the first‑quarter reporting season. Analysts have pointed to recurring flows into growth and technology names as investors reset risk for the summer after digesting early‑year macro data. Options expiration cycles and systematic strategies tied to volatility and momentum can amplify those flows, turning a modest calendar bias into a more visible NDX seasonal trend.
What is driving Nasdaq 100 (NDX) today?
Nasdaq 100 closed at 28,015.06, up 363.24 points or 1.31% on the session, extending a powerful run that has lifted the index about 47.7% above its 52‑week low of 19,011.98 and roughly 2.1% above its 52‑week high of 27,315.23. One‑month performance has been especially aggressive, with a 17.76% gain over the past 30 days as mega‑cap tech leadership has pulled the benchmark sharply higher. Trading volume of roughly 1.37 billion shares topped the 20‑day average of about 1.21 billion, signaling that buyers are leaning into the breakout rather than fading it.
The chart below situates the latest surge against the past year of trading and overlays the upcoming 60‑day seasonal projection.
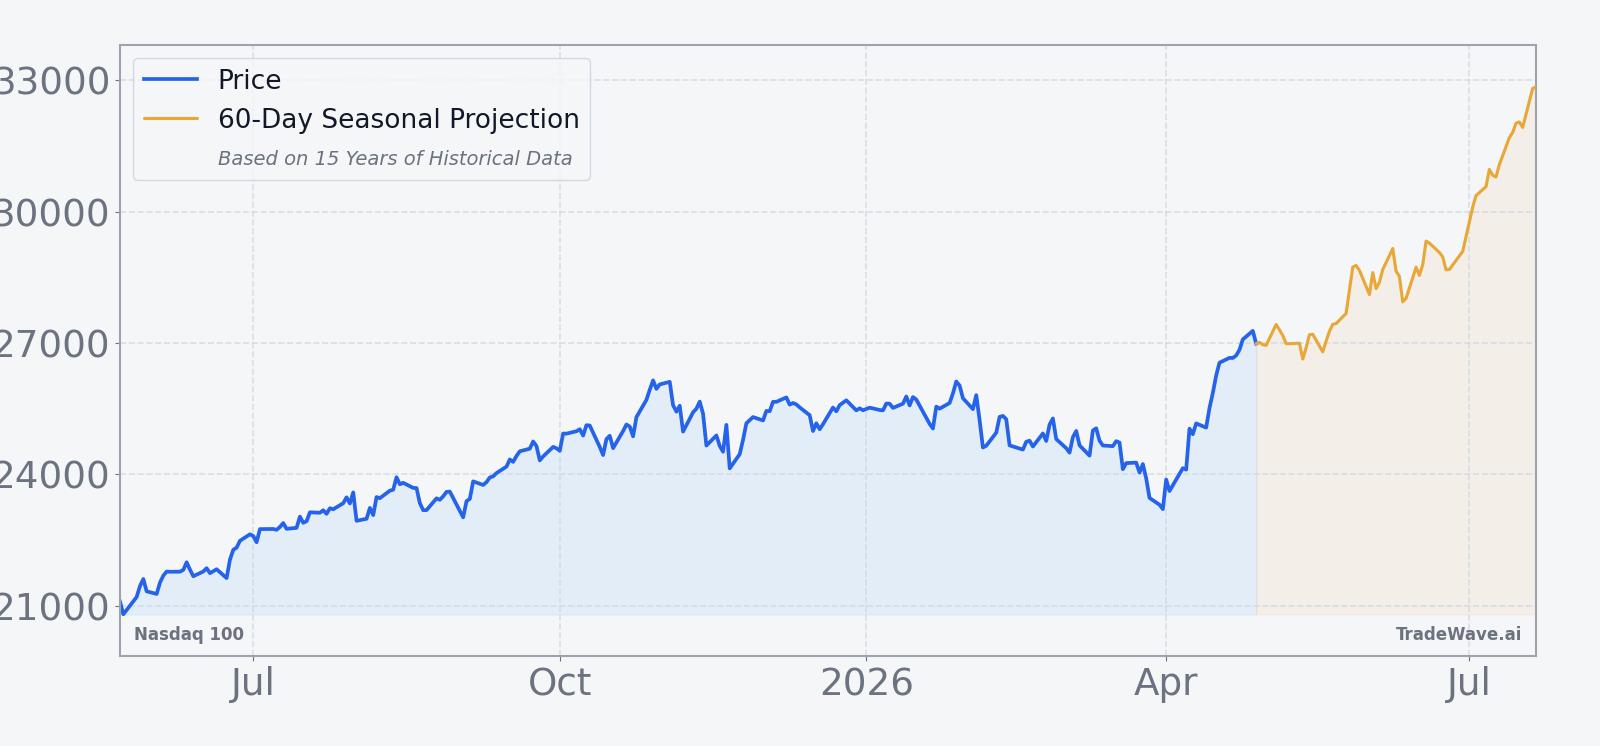
Macro commentary has focused on a rare bullish pattern in the Nasdaq 100 that, in prior decades, often preceded further highs, reinforcing the sense that the index is in a powerful momentum phase.[1] That backdrop, combined with strong breadth inside the tech complex and heavy participation from mega‑cap constituents, has kept dip‑buyers active even as valuations stretch. For traders watching stock pattern analysis and sector seasonal outlooks, the alignment between a breakout tape and a historically strong Nasdaq 100 trading window is hard to ignore.
Sources
About this seasonal analysis
Seasonal pattern data is sourced from TradeWave.ai, which analyzes historical price behavior across annual calendar windows going back up to 30 years. Read the full data methodology or the book The 100-Year Pattern by Afshin Moshrefi (2026 edition). Past performance of seasonal patterns does not guarantee future results. This article is for informational purposes only and does not constitute investment advice.