10-for-10 Midterm Run: Abbott Laboratories (ABT) Averages 20% Gains Over 279-Day Window
Abbott Laboratories is stepping into a historically powerful 279-day midterm-election-year seasonal window just as the stock trades higher year to date and volatility around policy and tariffs lingers.
Price as of Jul 15, 2026: $89.27 (last close).

What is the seasonal pattern for Abbott Laboratories (ABT)?
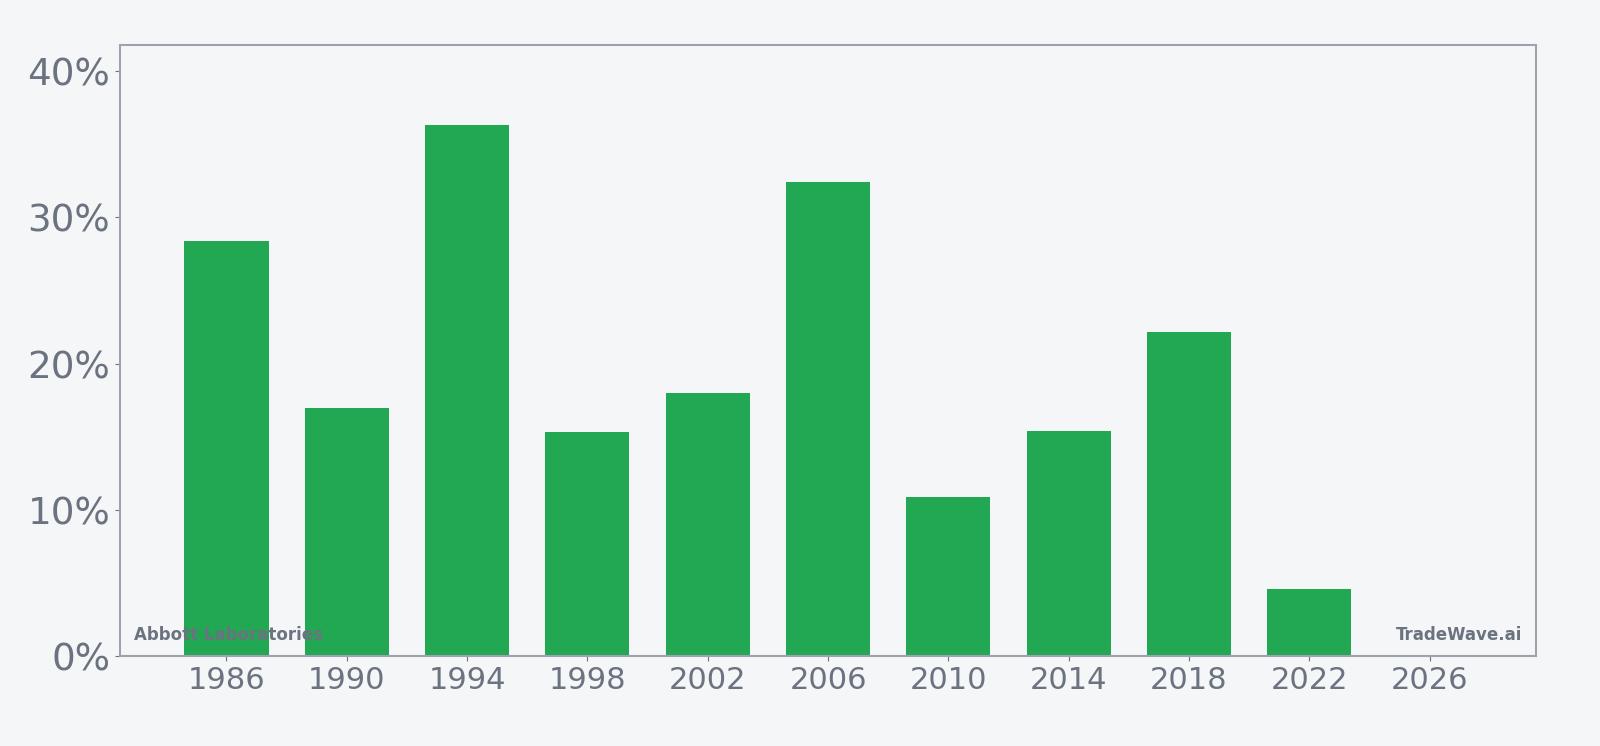
Abbott Laboratories has risen in 10 of 10 midterm-election-year windows starting Jul 16 and lasting 279 trading days, with an average gain of 20.05% in winning years.
- 10 for 10 in this window, with winning years averaging 20.05% gains across the last 10 midterm election years.
- Seasonal window starts Jul 16 and runs 279 trading days, spanning the back half of the midterm year into the pre-election year.
- Percent Profitable is 100%, with 10 winners and 0 losers in the historical sample.
- Annualized return of 19.69% and a Sharpe ratio of 1.73 point to a strong risk-adjusted profile for this long setup.
- The TradeWave Ratio of 2.04 indicates that price has typically traveled meaningfully in the trade direction within the window, even before final outcomes.
- Intraperiod drawdowns have still appeared in some years, so the path has not been a straight line even in a perfect win record.
According to historical data from TradeWave.ai, this midterm-election-year stretch for Abbott Laboratories has behaved very differently from an average calendar period. The next section looks at how that pattern has played out across prior cycles and what it implies for the current window.
How has Abbott Laboratories (ABT) traded in this midterm-year seasonal window?
Abbott Laboratories has posted gains in every one of the last 10 midterm-election-year windows that start on Jul 16 and run for 279 trading days, averaging a 20.05% profit for long positions. The stock finished the prior session at 89.27, up 0.35% on the day and roughly 17% higher year to date, setting up this historically strong ABT seasonal trend against an already constructive tape.
The presidential election cycle matters here because this window is defined specifically by midterm election years, when policy uncertainty, tariff debates and healthcare regulation often sit front and center. Grouping only those years together filters out noise from other parts of the four-year cycle and shows how Abbott has tended to behave when Washington is in this particular phase of the policy calendar.
Across the 10 historical midterm-year samples, the average annualized return in this Abbott Laboratories trading window is 19.69%, with a median profit of 17.5%. That combination of a perfect win record and double-digit median gains is unusual for a single stock pattern analysis, especially over a long 279-day stretch rather than a short earnings or month-specific trade.
The per-year breakdown shows how consistent the upside has been. The strongest year in the sample was 1994, when the stock gained 36.33% between the Jul 16 start and the end of the 279-day window. The softest outcome was 2022, which still delivered a 4.59% net gain despite a tougher macro backdrop for medtech and broader market volatility.
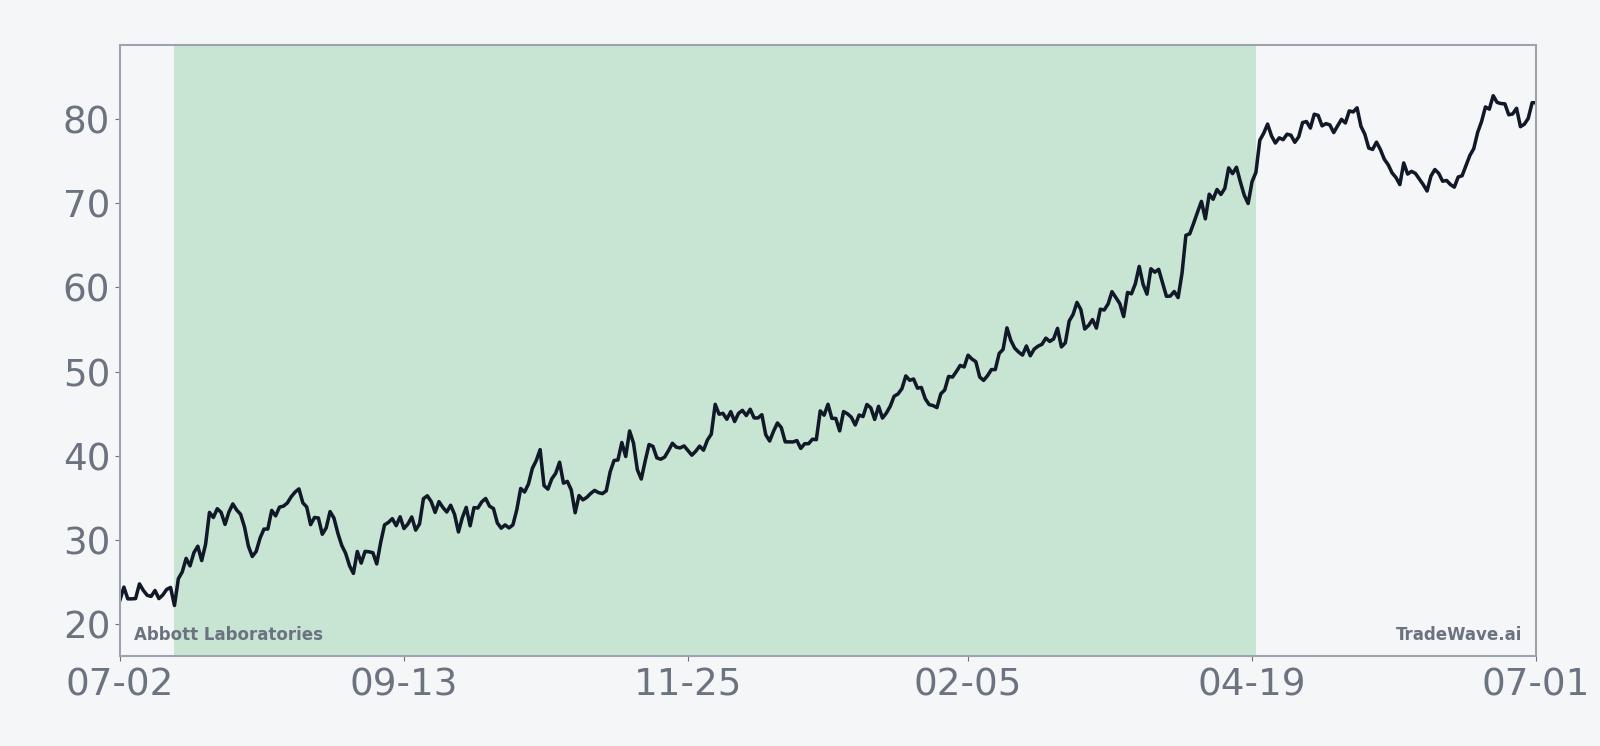
The historical seasonal average curve slopes higher through most of the window, with gains tending to build as the calendar moves from the back half of the midterm year into the pre-election year. The profile is not a straight line, but it shows more steady upward drift than choppy reversals, which aligns with the long-only trade direction.
Year-by-year bars that include both peak rallies and worst drawdowns help clarify how much room ABT has historically given traders inside this window.
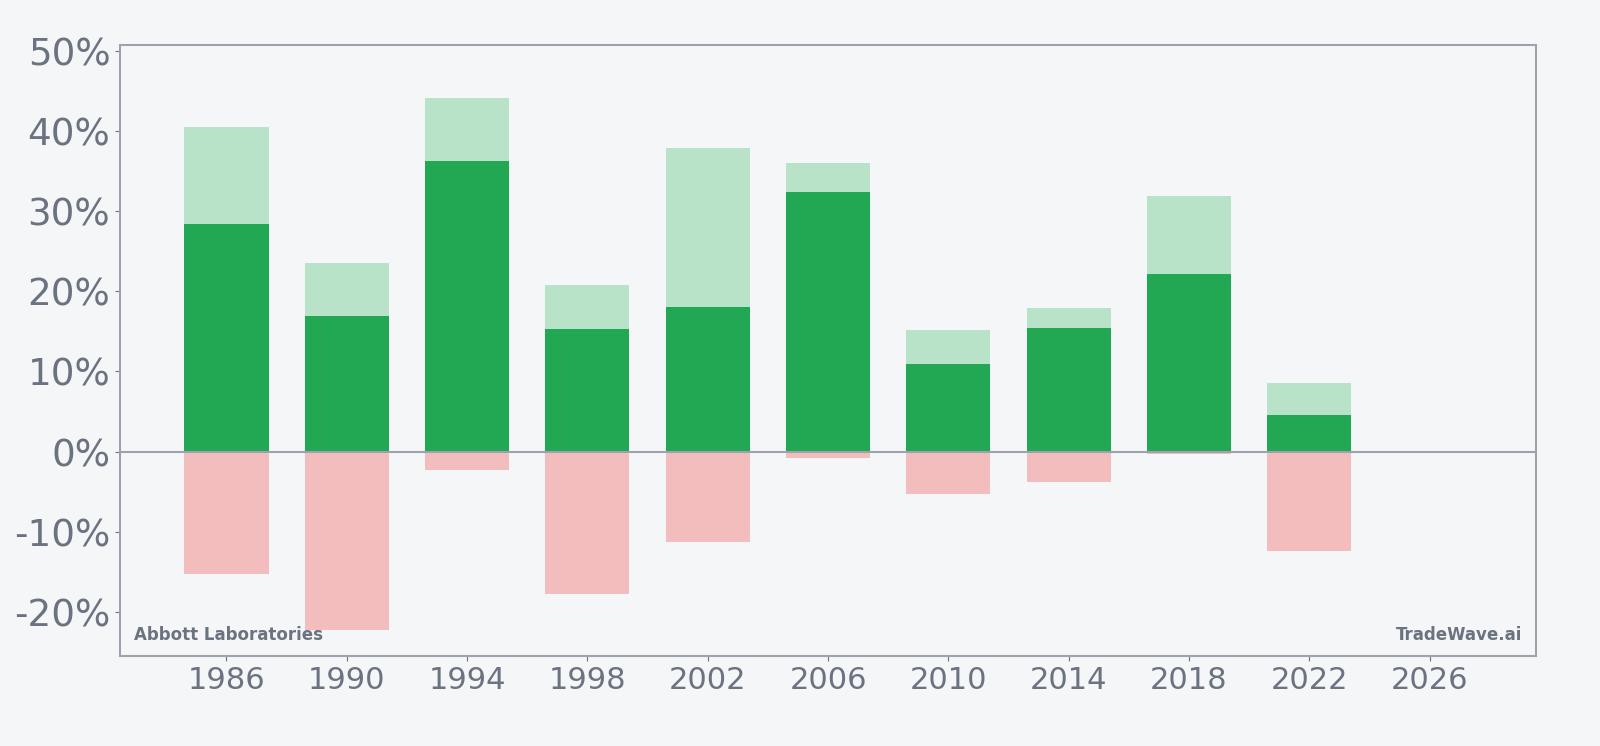
The combined net, maximum favorable move and maximum adverse move bars show that upside swings have often been sizable, with peak rallies such as 44.16% in 1994 and 40.47% in 1986, while drawdowns have varied from shallow pullbacks of less than 1% in 2006 and 2018 to deeper dips of more than 20% in 1990. In other words, even in a window that has never finished negative in this sample, traders have had to sit through meaningful volatility at times before the gains stuck.
The TradeWave Ratio of 2.04 reinforces that point by summarizing how far price has typically traveled in the trade direction within the window, independent of the final close. A Sharpe ratio of 1.73, based on end-of-window outcomes, suggests that the reward has historically more than compensated for the volatility in this specific slice of the calendar.
Add it up: 10 for 10 with average gains around 20% and a long-only profile makes this one of the cleaner bullish seasonal windows on the Abbott Laboratories calendar, especially when framed against the midterm-to-pre-election transition.
Why does Abbott Laboratories (ABT) follow this seasonal pattern?
One likely driver is the way Abbott’s earnings calendar and capital spending plans line up with the policy cycle, with midterm-year back halves often featuring clearer visibility on tariffs, reimbursement and regulation. Analysts have also pointed to institutional portfolio repositioning into defensive healthcare names as midterm uncertainty fades and the pre-election year begins, which can favor large medtech stocks. This pattern may also reflect sector rotation as investors shift from early-cycle growth themes toward steadier cash-flow stories heading into the next presidential race.
History does not guarantee future results; adverse excursions can still be large within this window even when final outcomes have been positive in every prior year.
What is driving Abbott Laboratories (ABT) today?
Abbott Laboratories shares closed at 89.27 in the prior session, up 0.31 points or 0.35%, leaving the stock about 17% higher so far in 2026. That move came on volume of roughly 16.4 million shares, above the recent 20-day average of about 13.5 million, as investors continued to weigh medtech demand against lingering tariff and margin questions.
In July 2025, Abbott reported adjusted second-quarter earnings per share of $1.26, slightly ahead of expectations, but its forecast for the following quarter came in below Wall Street’s profit estimates, and the stock sold off in premarket trading as investors reset growth assumptions.[1][2][3] Later that year, on Oct 15, 2025, the company posted higher quarterly revenue driven by strong medical device demand, even as weakness in diagnostics and nutrition and a modest revenue miss kept sentiment cautious.[4]
Tariffs have been another slow-burn macro driver. In July 2025, Abbott said U.S. tariffs were expected to start impacting results in the third quarter, with annual costs projected at a few hundred million dollars, and outlined plans to build a new Georgia manufacturing facility by 2028 to blunt that impact.[6] That backdrop helps explain why investors have been sensitive to guidance and margin commentary, even as the stock’s 2026 year-to-date performance has turned positive.
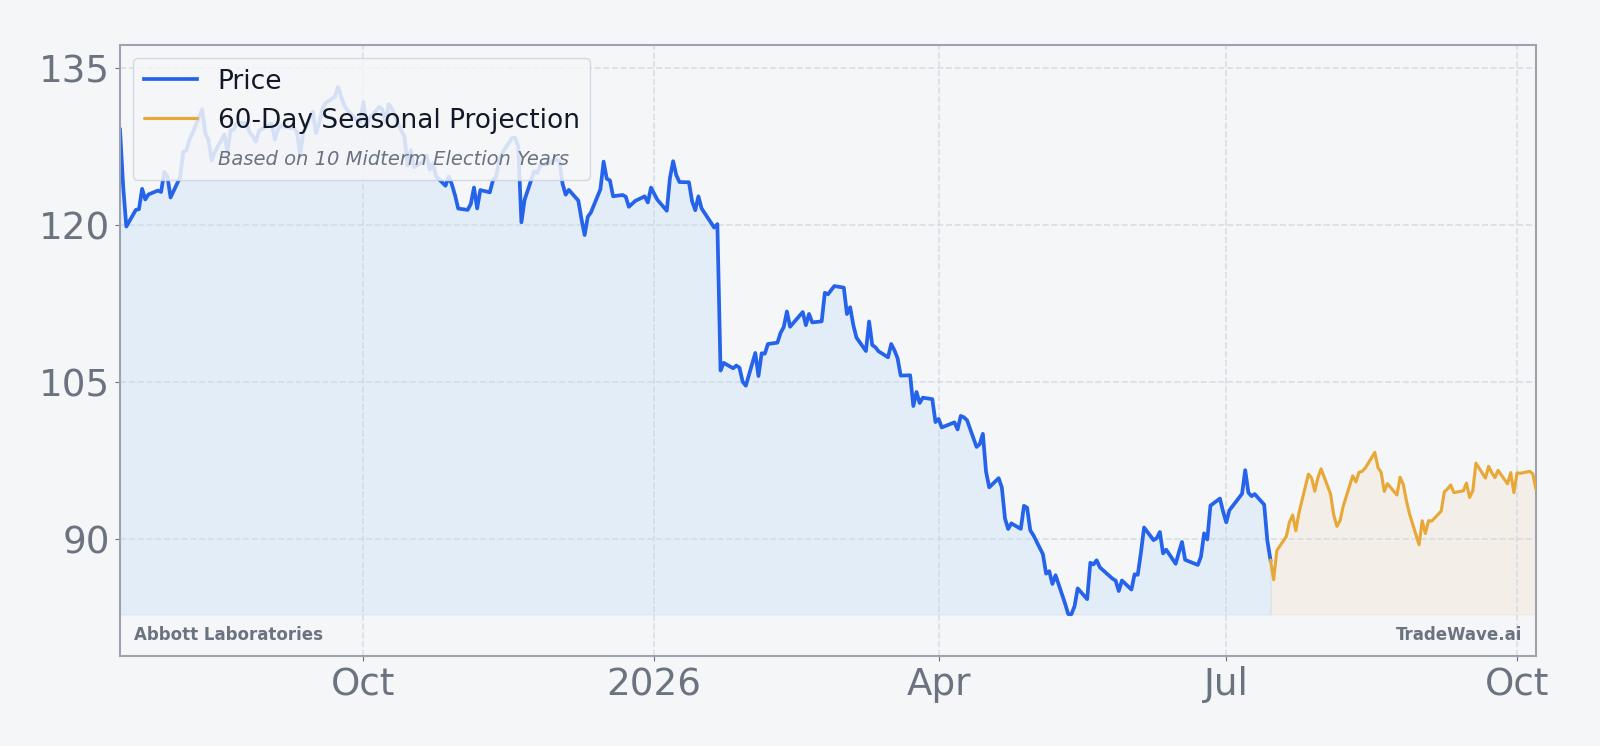
The chart below situates the latest move in its recent multi-month context and overlays a short-term seasonal projection.
What should traders watch in this Abbott Laboratories seasonal window?
For this 279-day midterm-year window, the first thing to watch is whether ABT respects the historical tendency for steady upside rather than sharp trend breaks. Sustained trading above the 50-day moving average, which currently sits near 87.93, would be one sign that the stock is tracking closer to the historical seasonal pattern than to a one-off macro shock.
Second, earnings and guidance updates will be key checkpoints against the historical seasonality. The past cycle showed how even a small guidance miss could trigger outsized price reactions, so any upcoming commentary on device demand, diagnostics recovery and tariff pass-through will matter for how this window plays out relative to prior midterm years.[1][2][3][4][6]
Third, traders should monitor intraperiod volatility against the historical maximum adverse moves. If drawdowns begin to resemble the deeper historical MAE episodes, such as the more than 20% dip seen in 1990, that would signal a bumpier ride inside an otherwise bullish seasonal regime and could test conviction in the ABT seasonal pattern.
Finally, because this window bridges the midterm election year into the year before the presidential election, any shifts in the policy calendar around healthcare regulation, tariffs or reimbursement could either reinforce or challenge the historical pattern. A backdrop of stabilizing policy and solid medtech demand would rhyme with prior winning years, while renewed tariff shocks or regulatory surprises could be the kind of catalysts that produce the rare outlier against an otherwise perfect seasonal record.
Sources
- Reuters, "Abbott beats quarterly profit estimates on medical devices demand - Reuters", Jul 17, 2025.
- Reuters, "Abbott beats profit estimates on medical devices demand, shares fall on forecast - Reuters", Jul 17, 2025.
- Reuters, "Abbott beats estimates on medical devices demand as forecast hits shares - Reuters", Jul 17, 2025.
- Reuters, "Abbott revenue misses as diagnostics, nutrition weakness clouds medical devices lift - Reuters", Oct 15, 2025.
- Reuters, "Abbott profit forecast falls short, ramps up US investing amid tariff pressure - Reuters", Jul 17, 2025.
About this seasonal analysis
Seasonal pattern data is sourced from TradeWave.ai, which analyzes historical price behavior across annual calendar windows going back up to 30 years. Read the full data methodology or the book The 100-Year Pattern by Afshin Moshrefi (2026 edition). Past performance of seasonal patterns does not guarantee future results. This article is for informational purposes only and does not constitute investment advice.