Fewer Disasters Leave Copart (CPRT) Revenue Soft as Midterm-Year Weakness Looms
Copart is approaching a mid-August seasonal window that has often rewarded short sellers even as the stock trades near its 52-week low and fundamentals hinge on salvage supply and pricing power.
Price as of Jul 15, 2026: $27.28 (last close).

What is the seasonal pattern for Copart (CPRT)?
Copart has delivered profitable short-side trades in 6 of the last 7 midterm-year autumn windows during this 50-day stretch, with an average 9.02% gain in winning years.
- 6 wins and 1 loss in this window, with winning years averaging 9.02% gains for the short side.
- The 50-day Copart trading window begins Aug 15 and clusters in the last 7 midterm election years.
- Percent Profitable is 86%, with 6 winners and 1 loser across the historical sample.
- Including all years, Avg Profit - All is 7%, showing the pattern has stayed positive even after the lone losing stretch.
- Maximum adverse excursions have reached as deep as -32.0% in a single year, underscoring sizable intraperiod risk for shorts.
- The TradeWave Ratio of 1.49 and Sharpe ratio of 1.05 point to a historically efficient short window relative to its volatility.
According to historical data from TradeWave.ai, this mid-August stretch has behaved very differently from an average month on the Copart calendar. The next section walks through how that election-cycle pattern has played out and what it could mean for traders watching CPRT into late summer.
How has Copart (CPRT) traded in the mid-August midterm-year window?
Copart has produced profitable short trades in 6 of the last 7 midterm election years during the 50 trading days starting Aug 15, with winning years averaging 9.02% gains for bears. Shares finished Thursday at 27.28, down 0.9% on the day and sitting right on their 52-week low of 27.23 while still up about 1.7% year to date.
Grouping the data by the presidential election cycle matters here because this pattern only shows up in midterm years, when policy uncertainty, rate debates and regulatory noise often hit cyclicals and niche industrials differently than in election or pre-election years. For Copart, the last 7 midterm-year versions of this late-summer window have lined up with a consistent tendency for the stock to drift lower, even when the broader market was setting up for the historically stronger pre-election year that follows.
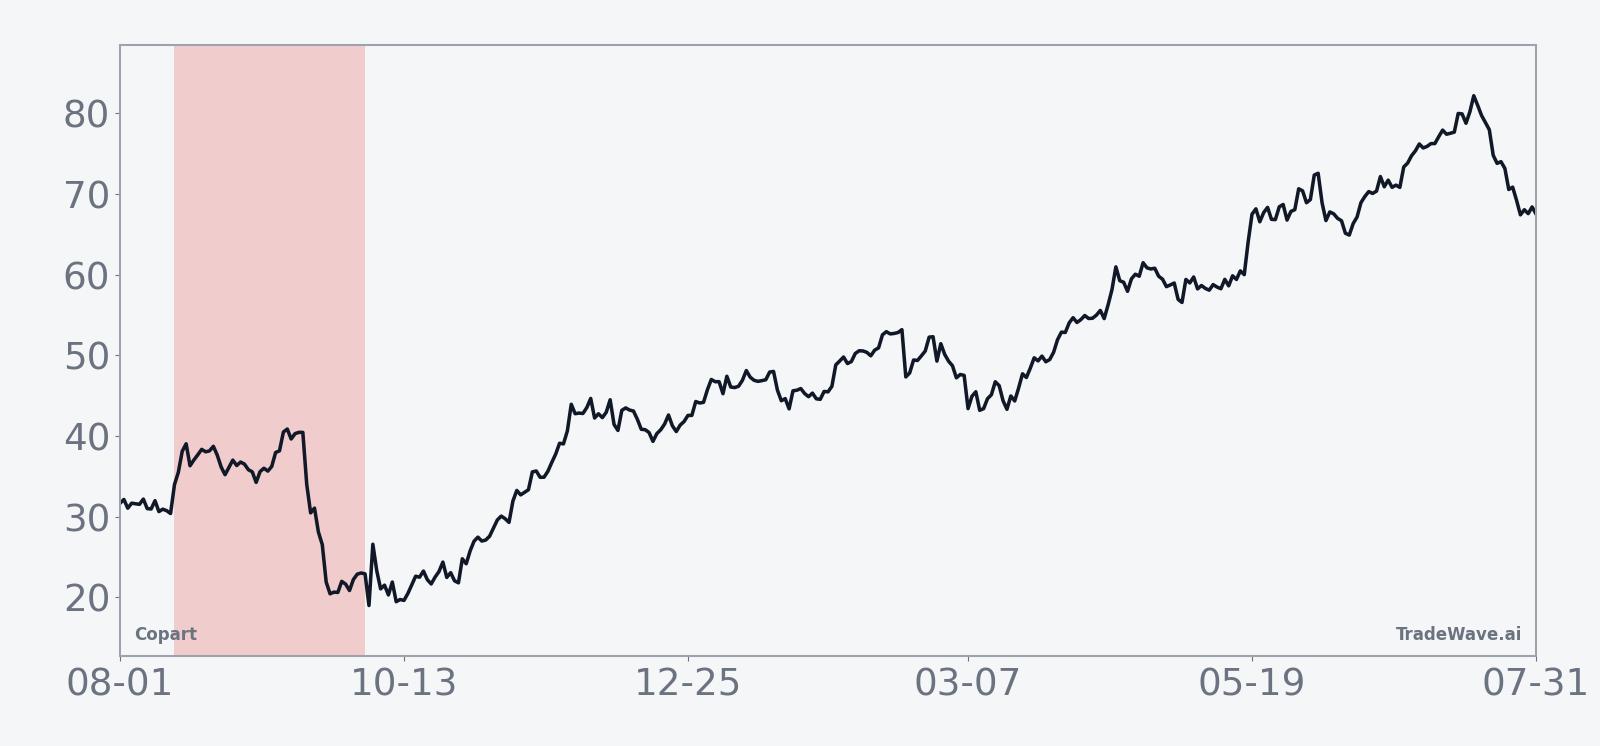
The trade direction for this setup is short, so negative returns are favorable outcomes. Across the seven midterm-year samples, Percent Profitable is 86%, with 6 winners and just 1 losing year, and the all-years average outcome is a 7% gain for the short side. Avg Profit of 9.02% reflects only the winning years, while Avg Profit - All at 7% includes every year in the sample, including the one losing stretch.
The per-year table shows how wide the swings can be inside the window. In 2022, a short entered around 32.85 and exited near 27.41 for a net return of -16.56% on the stock, which was a strong win for the short pattern, but the worst intraperiod drawdown from entry, or maximum adverse excursion, still reached -20.43% before the trade finished in the money. At the other extreme, 1998 delivered a net return of -8.0% for shorts but saw a maximum adverse excursion of -32.0%, meaning the stock rallied sharply against the position before rolling over.
On the favorable side, maximum favorable excursions, the best point-to-peak moves in the trade direction, have ranged from 0.94% in 2022 to 25.68% in 2002, showing that some years offered only modest follow-through while others saw deep, sustained slides. The TradeWave Ratio (TWR) of 1.49 captures how far price typically travels in the trade direction within the window, independent of the final close, and the Sharpe ratio of 1.05 indicates that, based on end-of-window outcomes, the risk-adjusted profile has been solid for a short pattern.
The historical seasonal trend chart suggests that weakness often builds gradually rather than in a single air pocket. Returns tend to deteriorate through the middle of the window, with some years showing late countertrend bounces that still leave shorts ahead by the close. That choppy path matters for risk management because it lines up with the large adverse excursions seen in several cycles.
The cumulative return view across all seven midterm-year windows adds up to a 61% gain for the short side, or an annualized return of 7.07% for this specific slice of the calendar. Add it up: a pattern that has been right 6 times out of 7, with a positive all-years average and a clear tendency for downside pressure, is unusual for a single stock window tied to the election cycle.
Year-by-year bars with intraperiod swings show how often shorts have worked and how deep the countertrend rallies have run.
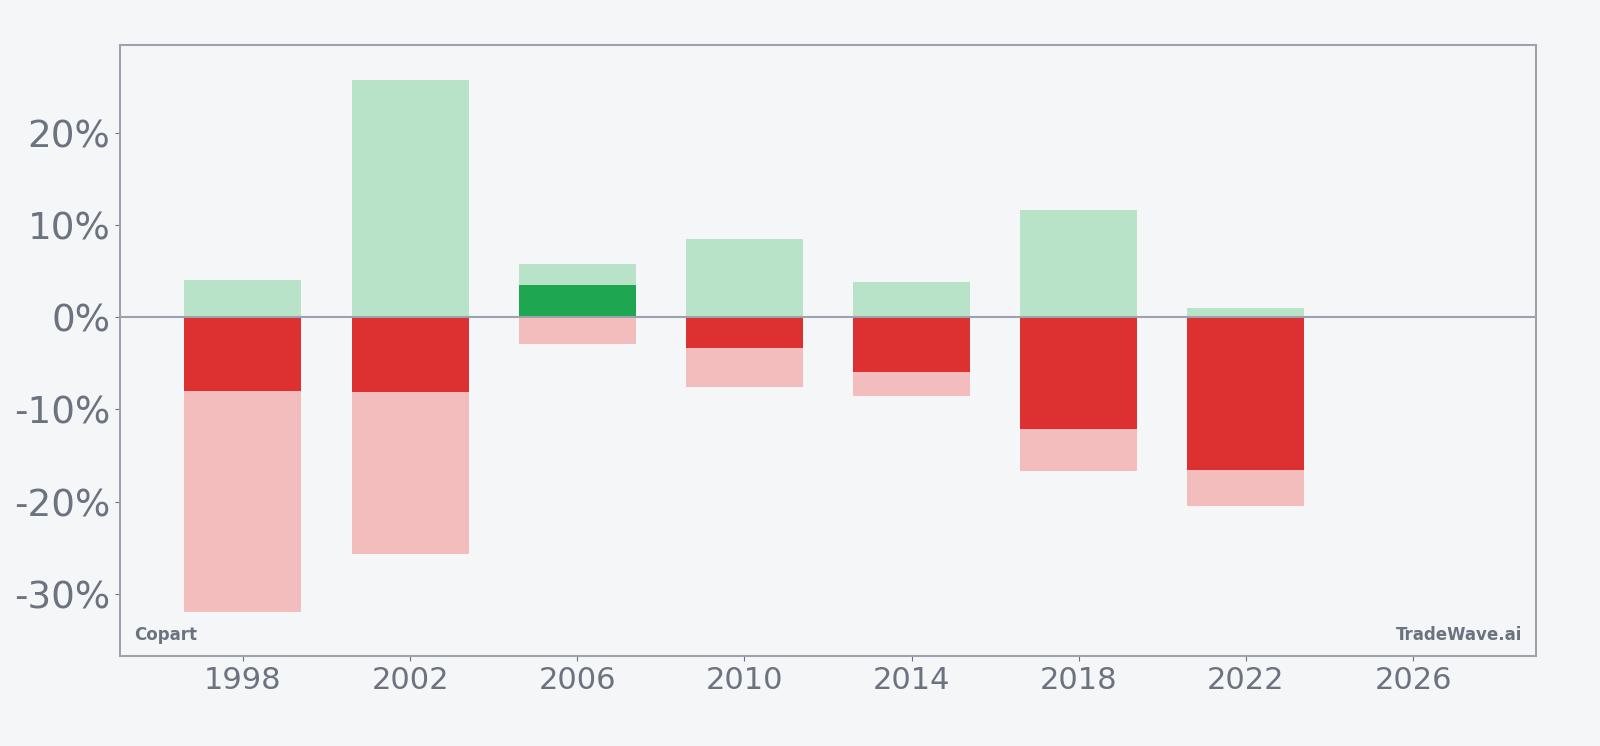
History does not guarantee future results; adverse excursions can be large even in winning windows, and shorts have repeatedly faced double-digit rallies before the pattern paid off.
Why does Copart (CPRT) follow this seasonal pattern?
One likely driver is the way insurers and fleet owners adjust salvage flows and pricing expectations around late summer in midterm election years, when policy and rate uncertainty can affect claim behavior and used-vehicle demand. Analysts have pointed to Copart’s sensitivity to total loss frequency, catastrophic events and international expansion, all of which can ebb and flow with macro and regulatory headlines that tend to cluster in this phase of the cycle.[1] The pattern may also reflect institutional portfolio repositioning ahead of the historically stronger pre-election year, with some investors trimming winners or higher-multiple industrials like Copart into the autumn.
What is driving Copart (CPRT) today?
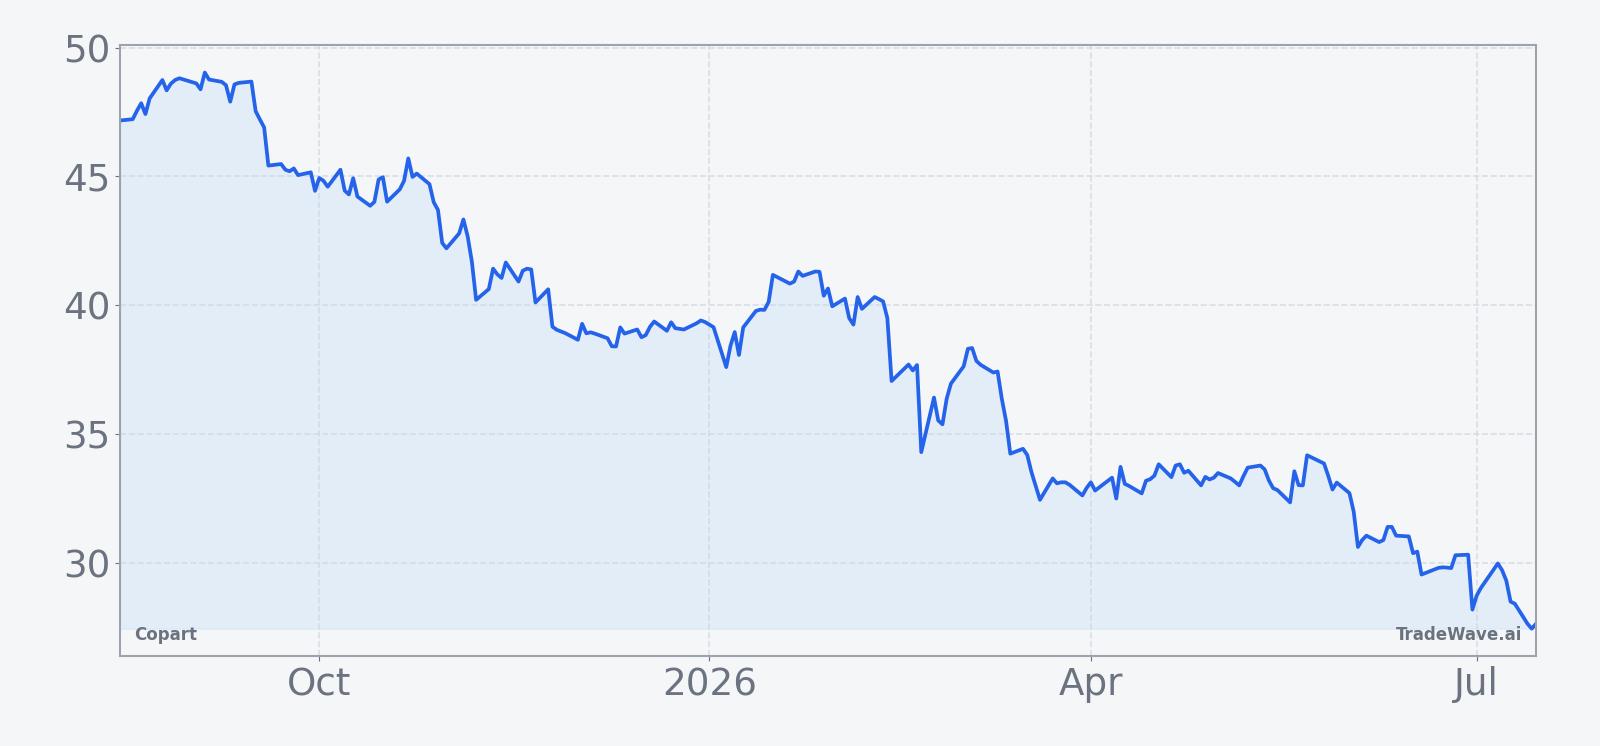
Copart closed Thursday at 27.28, down 0.24 on the session, a 0.9% decline that leaves the stock essentially flat on the year with a 1.7% gain and parked right at its 52-week low of 27.23. That puts CPRT almost 45.6% below its 52-week high of 50.11, a sharp reset that has already taken a lot of air out of the long-term uptrend.
Fundamentally, the story is a tug-of-war between softer headline growth and strong unit economics. In Q1 of fiscal 2026, Copart reported revenue growth of just 0.7%, citing fewer catastrophic events and some consumer insurance pullbacks that reduced the flow of high-value salvage vehicles through its auctions.[1] At the same time, average selling prices for salvage vehicles climbed 8% year over year in that quarter, and the company highlighted rising total loss frequency of 22.6% for the first nine months of 2025 as a key support for inventory supply and margins.[1]
Copart’s VB3 online platform is another quiet driver. The company has been leaning into digital auction efficiencies and higher average selling prices, which have helped keep gross and net margins elevated even as top-line growth cooled.[1] International expansion, including initiatives like “Blue Car” and “Purple Wave,” delivered 18% year-over-year revenue growth in Q3 of fiscal 2025, giving the business a second engine that is less tied to U.S. catastrophe cycles.[1]
Macro conditions around insurance and catastrophic events remain a swing factor. Fewer big storms or disasters can weigh on near-term revenue because there are simply fewer total-loss vehicles to process, but the rising structural trend in total loss frequency supports a steady pipeline of inventory over time.[1] That backdrop helps explain why Copart can trade near its 52-week low even as its underlying salvage marketplace remains profitable and strategically important to insurers.
The chart below situates the latest move against the past year’s slide and a 60-day seasonal projection.
What should traders watch as Copart (CPRT) approaches this window?
First, the calendar. The 50-day Copart seasonal window keyed to midterm election years begins on Aug 15, so any sharp rallies into that date would increase the room for the historical short pattern to work, while a continued grind at 52-week lows would blunt the potential downside. Traders will be watching whether CPRT can reclaim and hold levels above its 50-day moving average around 31.08 before the window opens, or whether it remains pinned near the recent floor.
Second, the policy and insurance backdrop. Any shift in expectations around catastrophic events, insurance pricing or claim behavior could alter the flow of salvage vehicles and investor sentiment toward Copart’s business model.[1] Headlines about storm seasons, regulatory changes in auto insurance, or updates on international expansion initiatives like “Blue Car” and “Purple Wave” could all act as catalysts inside the window.
Third, behavior inside the window itself. If the stock starts the period with a bounce and then rolls over into a steady drift lower, that would rhyme with the historical pattern of profitable short outcomes in 6 of 7 midterm-year cycles. A clean break higher that holds through the full 50 days, by contrast, would look more like the lone losing year in the sample and would signal that this particular midterm-year stretch is diverging from the usual Copart seasonal trend.
Finally, volatility. The history of double-digit maximum adverse excursions, including years where shorts sat through 20% to 30% rallies before finishing ahead, means traders will need to respect intraperiod swings even if the end-of-window statistics look attractive. How CPRT trades around news on salvage pricing, total loss frequency and international growth will help confirm whether this midterm-year window is repeating the script or writing a new one.[1]
Sources
About this seasonal analysis
Seasonal pattern data is sourced from TradeWave.ai, which analyzes historical price behavior across annual calendar windows going back up to 30 years. Read the full data methodology or the book The 100-Year Pattern by Afshin Moshrefi (2026 edition). Past performance of seasonal patterns does not guarantee future results. This article is for informational purposes only and does not constitute investment advice.