Copart (CPRT) Nears 52-Week Low as 6-of-7 Midterm Summer Slide Window Opens July 20
Copart is nearing a historically weak midterm-year seasonal window just as shares hover near their 52-week low and fundamentals stay supported by strong salvage demand.
Price as of Jun 30, 2026: $28.19 (last close).

What is the seasonal pattern for Copart (CPRT)?
Copart has fallen in 6 of the last 7 midterm-year windows starting around Jul 20 and lasting 76 calendar days, with an average gain of 10.03% in winning years.
- 6-for-7 record in this window, with Copart moving in the short direction 86% of the time across the last 7 midterm election years.
- The upcoming 76-day Copart trading window begins Jul 20 and historically aligns with a bearish CPRT seasonal trend for short setups.
- Percent Profitable is 86%, with 6 winners and 1 loser for the short trade direction in this specific Copart seasonal pattern.
- Average profit in winning years is 10.03%, while Avg Profit - All, which includes the lone losing year, is still a solid 8%.
- Maximum adverse excursions have reached as deep as roughly 30% in some years, so intraperiod drawdowns can be sharp even when the short pattern ultimately works.
- The Copart seasonal window sits in the midterm election year, a phase where policy uncertainty and sector rotation often amplify volatility in individual stocks.
According to historical data from TradeWave.ai, this midterm-year stretch has behaved very differently from an average quarter for Copart. The next section walks through how that election-cycle pattern has played out in prior years and what it means for the upcoming window.
How has Copart (CPRT) traded in this midterm-year seasonal window?
Copart has fallen in 6 of the last 7 midterm election years during the 76-day window that starts around Jul 20, making this one of the stock’s most consistently bearish seasonal stretches. Shares finished the prior session at 28.19, up 0.3% on the day and only about 0.4% above their 52-week low of 28.08, leaving the stock pinned near the bottom of its one-year range while this pattern approaches.
Grouping the data by the presidential election cycle matters here because midterm years often feature tighter fiscal policy debates, regulatory noise and shifting risk appetite that can hit individual stocks differently than in pre-election or election years. For Copart, the last 7 midterm election years show a distinct pattern in this late-summer window that has favored downside for short positions even as the broader business has grown over time.
This seasonal window begins on Jul 20 and spans 76 calendar days. Historically, during this period, Copart has shown a strong downside tendency for traders positioned short, with the pattern classified as “Trade Direction: short” in the seasonal framework.
The Percent Profitable metric for this Copart trading window is 86%, with 6 winners and 1 loser for the short setup. In other words, in 6 of the last 7 midterm election years, a short position initiated at the start of this window and held through the full 76 days would have finished in the green.
Average profit in the winning years is 10.03%, which reflects only those 6 successful short trades. When every year in the sample is included, the Avg Profit - All comes in at 8%, showing that the single losing year did not erase the broader seasonal edge.
The per-year table shows how this has played out in individual cycles. The strongest year for the short pattern was 2002, when the net return for the window was -13.92% as Copart’s price trended lower from entry to exit. The weakest year for shorts was 2006, which posted a 6.51% net gain for the stock, meaning that particular window delivered a loss for traders leaning into the seasonal short.
Intraperiod swings have been meaningful. Maximum favorable moves, or the best point-to-peak excursions in the trade direction, have reached as much as 17.72% in 2002, showing that when the short pattern works it can move quickly. Maximum adverse moves, the worst drawdowns from entry during the window, have been as deep as -32.0% in 1998, a reminder that even ultimately profitable short windows can involve painful squeezes along the way.
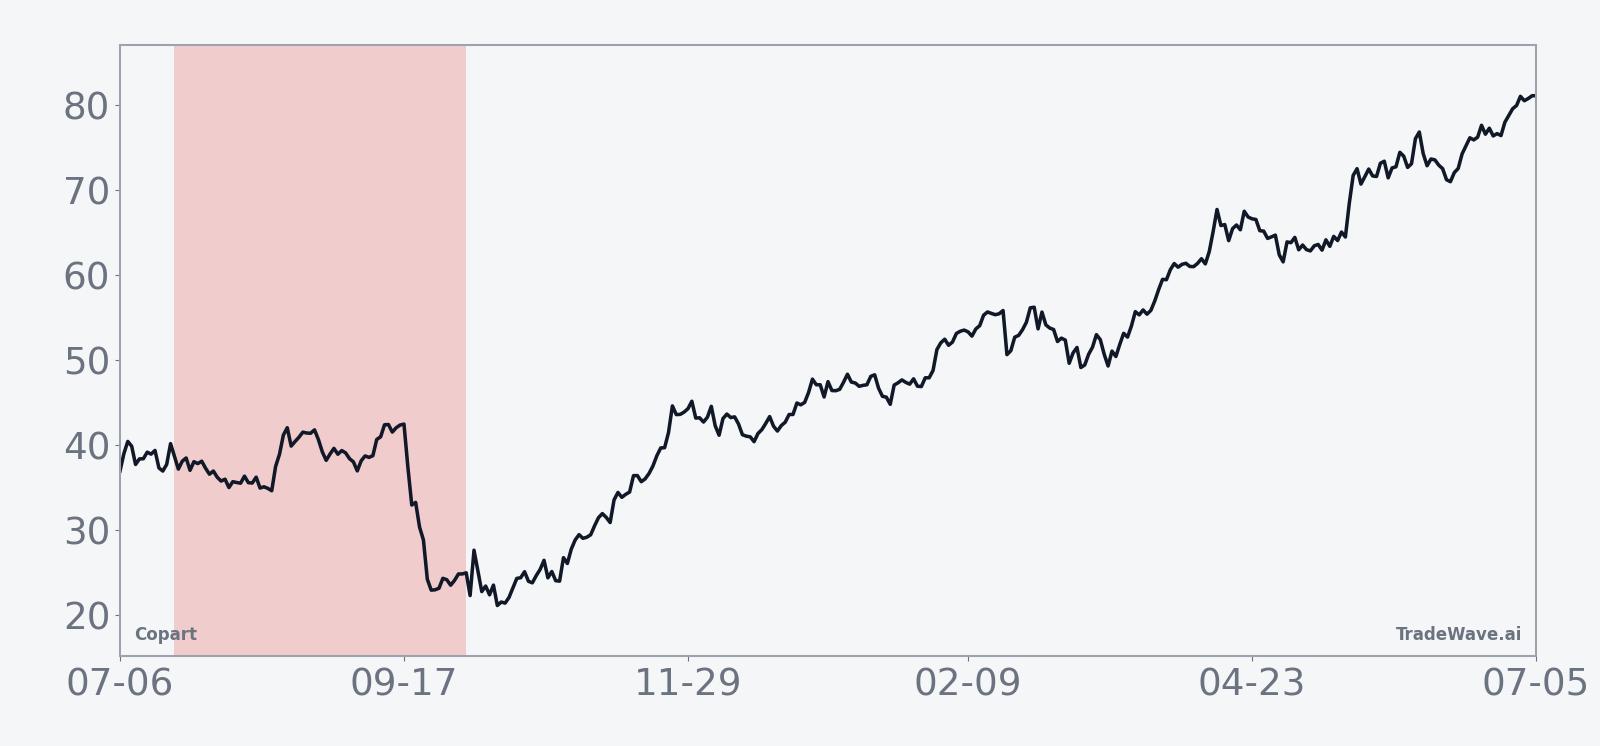
The historical seasonal trend chart for this Copart trading window shows that most of the downside for shorts has tended to build gradually rather than in a single air pocket. The average path slopes in favor of the short over the full 76 days, with some early choppiness followed by more persistent weakness into the back half of the window.
The cumulative return profile across the last 7 midterm election years adds up to a 65% gain for the short strategy over the full sample. That cumulative curve is relatively steady rather than dominated by one outlier year, which suggests the Copart seasonal trend here has been durable across different macro backdrops.
TradeWave Ratio (TWR) for this pattern is 1.54, which means the stock has typically traveled a meaningful distance in the trade direction within the window, independent of where it closed. The Sharpe ratio of 1.04 indicates that, based on end-of-window outcomes, the risk-adjusted return for this short pattern has been solid rather than explosive.
Put together, the record is clear: this midterm-year Copart trading window has historically favored shorts, with 6 winners out of 7, double-digit average gains in winning years and sizable intraperiod swings that reward patience but punish poor risk control.
Year-by-year bars with maximum favorable and adverse moves show how often shorts have worked and how deep the squeezes have run.
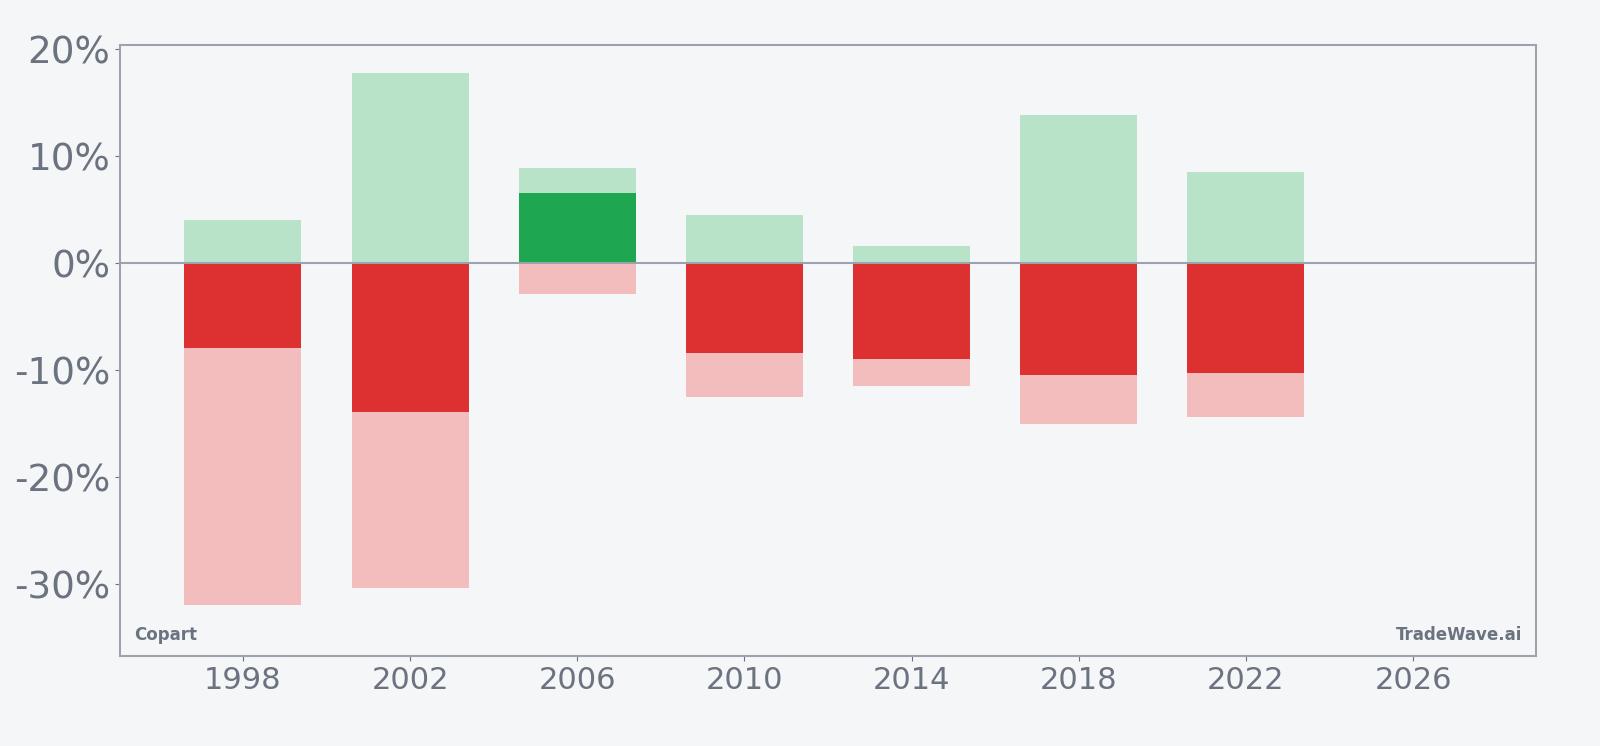
History does not guarantee future results; adverse excursions (MAE) can be large even in winning windows.
Why does Copart (CPRT) follow this seasonal pattern?
One likely driver is the way midterm election years concentrate policy debates around insurance regulation, auto safety standards and capital spending, which can affect sentiment toward automotive salvage and online auction stocks. Analysts have also pointed to institutional portfolio repositioning in the back half of midterm years, as managers rebalance exposure ahead of the historically stronger pre-election year, which can pressure winners like Copart. This pattern may also reflect how insurers adjust claim practices and total-loss thresholds around that time of year, influencing salvage volumes and expectations for Copart’s margins.
What is driving Copart (CPRT) today?
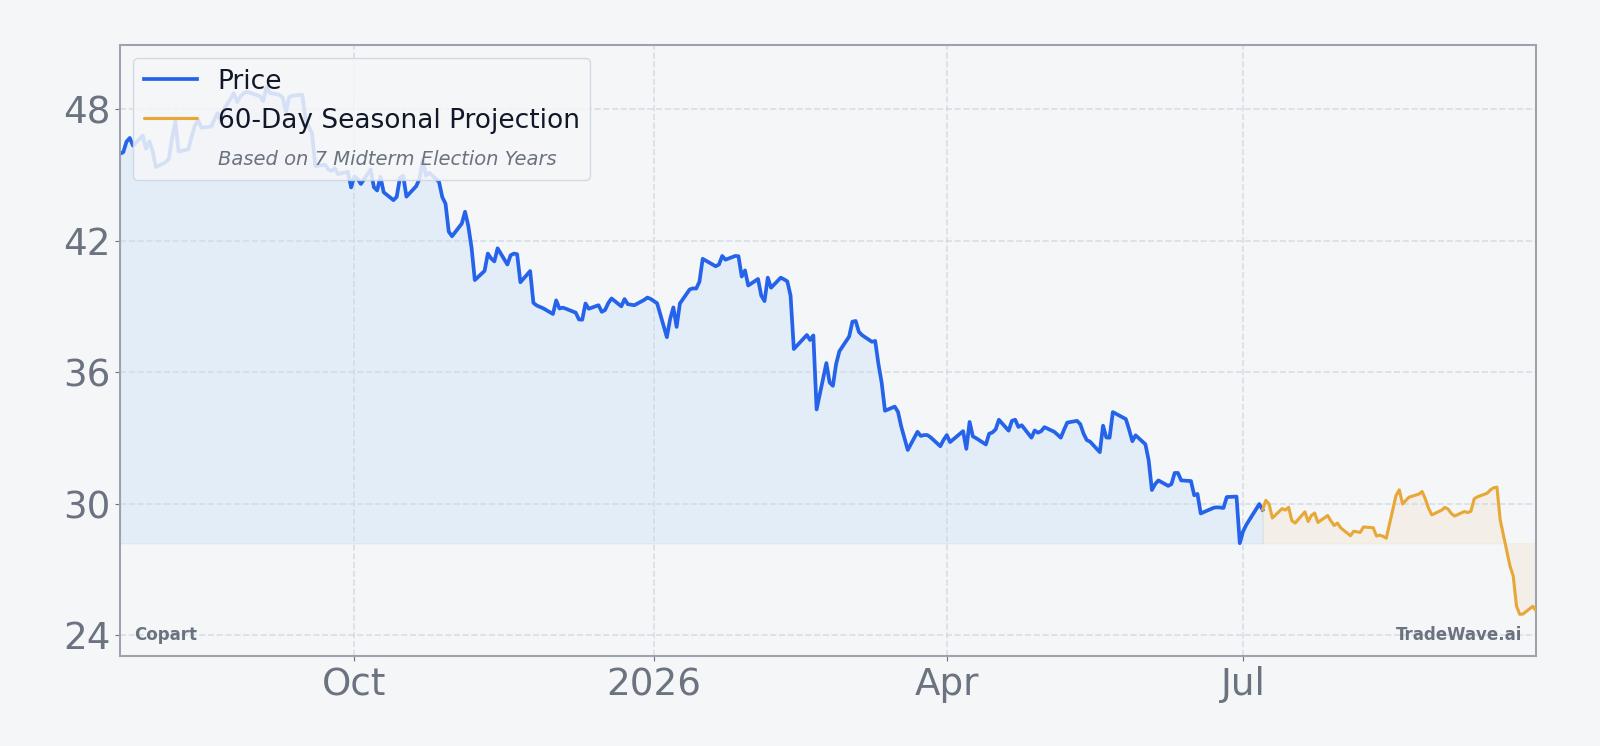
Copart closed the prior session at 28.19, up 0.3% on the day, leaving the stock roughly 1.7% higher year to date but sitting just above its 52-week low and far below the 50-day moving average of 32.19. The one-month return is -14.25%, a sharp pullback that has dragged the price to within about 0.4% of the 52-week low and well off the 52-week high of 50.11, where the stock now trades about 43.7% below that peak.
Fundamentally, Copart continues to benefit from a supportive salvage backdrop. Rising total-loss frequency of 22.6% for the first nine months of 2025 has kept a steady flow of damaged vehicles into the company’s online auctions, which helps underpin volumes and pricing even when broader auto demand is uneven.[1]
The company’s VB3 online platform is another structural tailwind. By pushing more of the salvage auction process into a streamlined digital workflow, Copart has been able to drive operational efficiencies and support strong gross and net margins, helped further by higher average selling prices for salvage vehicles.[1]
On the earnings front, Q1 FY26 revenue grew a modest 0.7%, held back by fewer catastrophic weather events and some pullback from consumer insurers, even as average selling prices for salvage vehicles climbed 8% year over year in that quarter.[1] That mix of slower top-line growth but firm pricing and margins helps explain why the stock has corrected from its highs while still attracting long-term interest.
Valuation expectations have also reset. A Forbes analysis from Jan 12, 2026 cited a consensus price target of 24.2 for Copart, a level that now sits well below the current share price and reflects an earlier, lower price regime rather than today’s trading range.[1] With the stock already under pressure and a historically weak seasonal window approaching, traders are weighing whether the recent slide has front-loaded some of the typical midterm-year downside or if volatility could persist into late summer.
The chart below situates the latest move in its recent multi-month context alongside a 60-day seasonal projection.
What should traders watch in this Copart (CPRT) seasonal window?
First, the calendar. The 76-day Copart trading window tied to the midterm election year opens on Jul 20, so price behavior in the first couple of weeks around that date will show whether the historical short bias is reasserting or being challenged.
Second, levels. With shares hovering just above the 52-week low near 28.08 and well below the 50-day moving average around 32.19, traders will be watching whether any bounce stalls under that moving average or if a decisive break back into the low 30s starts to contradict the usual midterm-year pattern.
Third, fundamentals and policy. Any fresh data on total-loss frequency, insurer behavior or regulatory shifts around auto claims could alter expectations for Copart’s salvage inventory pipeline and margins, either reinforcing the cautious seasonal backdrop or offsetting it with stronger demand signals.[1]
Finally, behavior inside the window will matter as much as the end result. If the stock continues to show sharp intraperiod swings, with rallies that fade and renewed pressure into weakness, that would be consistent with the historical pattern of sizable maximum favorable and adverse excursions for shorts. A clean, low-volatility grind higher through the window, by contrast, would mark a clear break from the last seven midterm election years and signal that Copart’s current cycle is rewriting its usual seasonal script.
Sources
About this seasonal analysis
Seasonal pattern data is sourced from TradeWave.ai, which analyzes historical price behavior across annual calendar windows going back up to 30 years. Read the full data methodology or the book The 100-Year Pattern by Afshin Moshrefi (2026 edition). Past performance of seasonal patterns does not guarantee future results. This article is for informational purposes only and does not constitute investment advice.