Record Nasdaq Closes Push Nasdaq 100 (NDX) Toward a 266-Day Midterm Rally Window
Nasdaq 100 is hovering just below its 52-week high as it approaches a 266-day midterm-election seasonal window that has never produced a loss in the last nine cycles.
Price as of Jun 29, 2026: $29,774.75 (last close).

What is the seasonal pattern for Nasdaq 100 (NDX)?
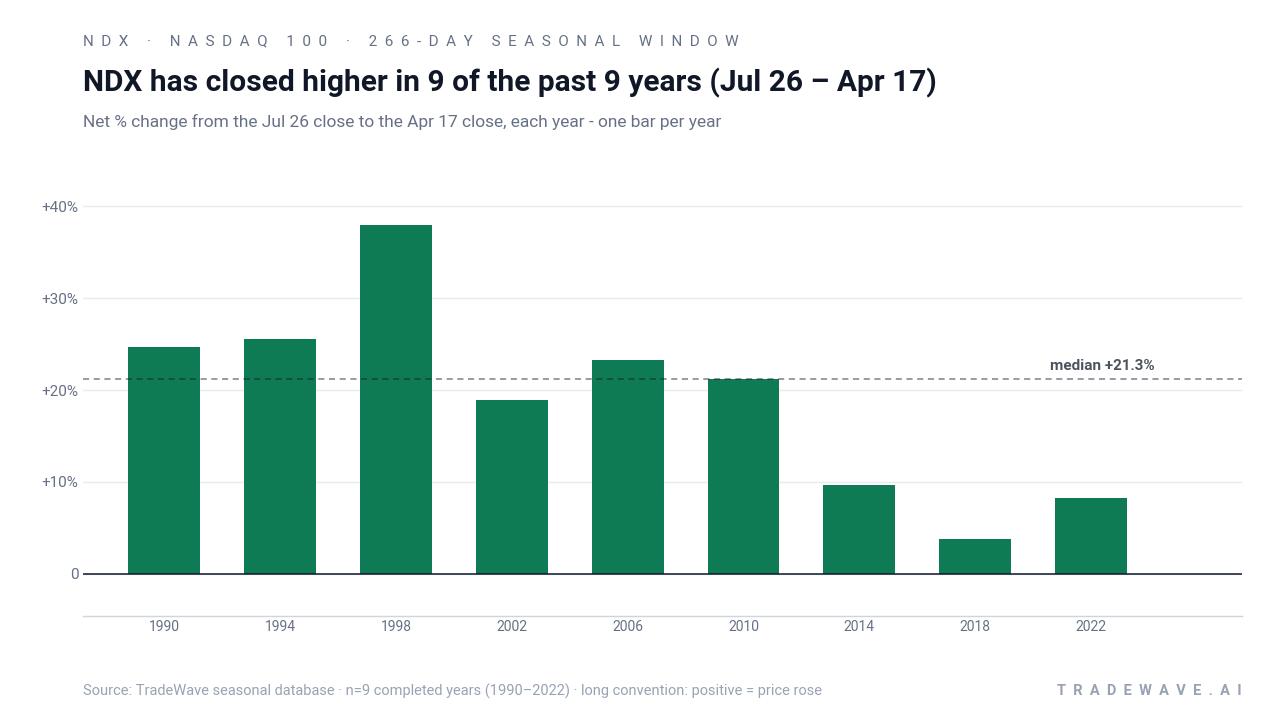
Nasdaq 100 has risen in 9 of 9 midterm-election-year windows starting around Jul 26, with an average gain of 19.28% in winning years.
Key takeaways
- 9 for 9 in this window, with Nasdaq 100 posting gains every time and averaging 19.28% in winning years.
- The upcoming midterm-year window begins Jul 26, 2026 and runs for 266 calendar days, spanning the late midterm phase into the pre-election year.
- Percent Profitable is 100%, with 9 winners and 0 losers across the last nine midterm-election cycles.
- Average winner gains of 19.28% stack into a 373% cumulative return across the sample, with an annualized return of 18.86%.
- Intraperiod swings have been large, with some years seeing adverse moves of more than 20% even though they finished higher.
- The pattern is long-biased, with a TradeWave Ratio of 1.44 and a Sharpe ratio of 1.55, pointing to historically strong risk-adjusted returns in this specific Nasdaq 100 trading window.
According to historical data from TradeWave.ai, this midterm-election stretch has behaved very differently from an average year for the Nasdaq 100, and the next iteration is about to open.
How strong is the upcoming seasonal window for Nasdaq 100 (NDX)?
Nasdaq 100 has rallied in all 9 midterm-election-year windows that start around Jul 26 and run for 266 calendar days, averaging gains of 19.28% with no losing years. The index finished the prior session at 29,774.75, up 2.25% on the day and sitting about 3.2% below its 52-week high of 30,762.20. That combination of a powerful historical seasonality and a benchmark already near record territory gives this summer’s setup unusual weight for tech-heavy portfolios.
Because this pattern is grouped by the presidential election cycle, it only looks at midterm-election years, not every calendar year. That matters in 2026, which is itself a midterm election year, since policy uncertainty, regulatory noise and shifting expectations for the 2028 race often cluster in this part of the cycle and can amplify moves in growth and technology benchmarks like the Nasdaq 100.
This seasonal window begins on Jul 26, 2026 and spans 266 calendar days, carrying the Nasdaq 100 from the late midterm-election phase into the heart of the year before the presidential election. Historically, during this period, the index has shown a strong upside tendency for long exposure. Percent Profitable sits at 100%, with 9 winners and 0 losers, so every midterm-year sample in this NDX seasonal trend finished higher over the window.
Average profit in winning years is 19.28%, while the median outcome is slightly higher at 21.26%, which tells you the gains have not been driven by a single outlier. Add it up and the cumulative return across the nine-sample history is 373%, which annualizes to 18.86% for this specific Nasdaq 100 trading window. For a long-only pattern, that is an unusually consistent profile.
The per-year table shows how that strength has played out. The strongest year in the sample was 1998, when the Nasdaq 100 gained 37.94% over the window, with a maximum favorable move of 57.83% from entry before giving some of it back by the close. The softest outcome was 2018, which still finished up 3.78% but saw a maximum adverse move of 20.34% along the way, a reminder that even “all green” windows can feel rough in real time.
MFE/MAE, defined as the best and worst intraperiod excursions from the entry, underline that point. In 1990 the index ultimately gained 24.73%, but at one stage it was down 28.46% from the starting level before recovering. In 2022, the window finished with an 8.28% gain, yet the worst drawdown from entry was 13.62%, while the best run-up reached 13.52%. Large maximum adverse excursions have been part of the pattern even in years that ended comfortably higher.
The historical seasonal average trend line for this window slopes higher in a relatively steady fashion rather than spiking in a single month. Gains tend to build through the back half of the midterm year and continue into the early part of the year before the presidential election, which has often been a supportive backdrop for risk assets. The typical path looks more like a staircase than a roller coaster, even though individual years have seen sharp swings around that average.
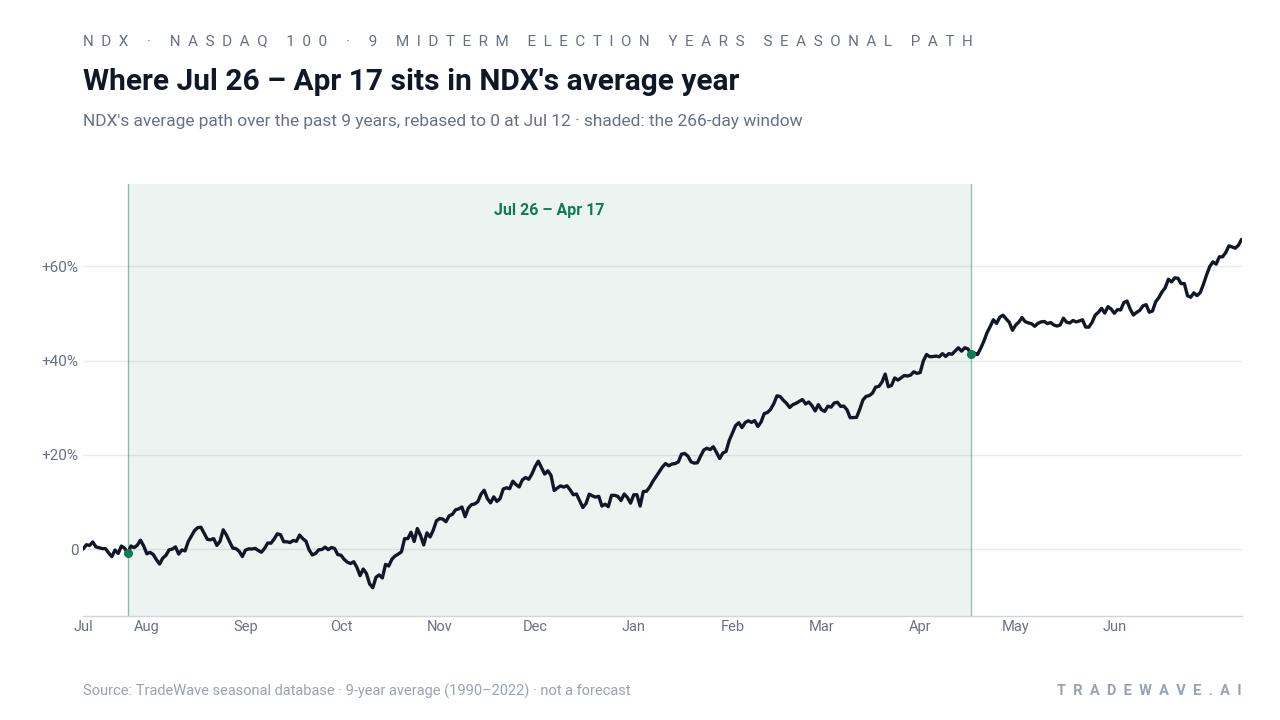
Year-by-year net returns and intraperiod swings show how often the index has rallied and how deep the drawdowns have run inside the window.
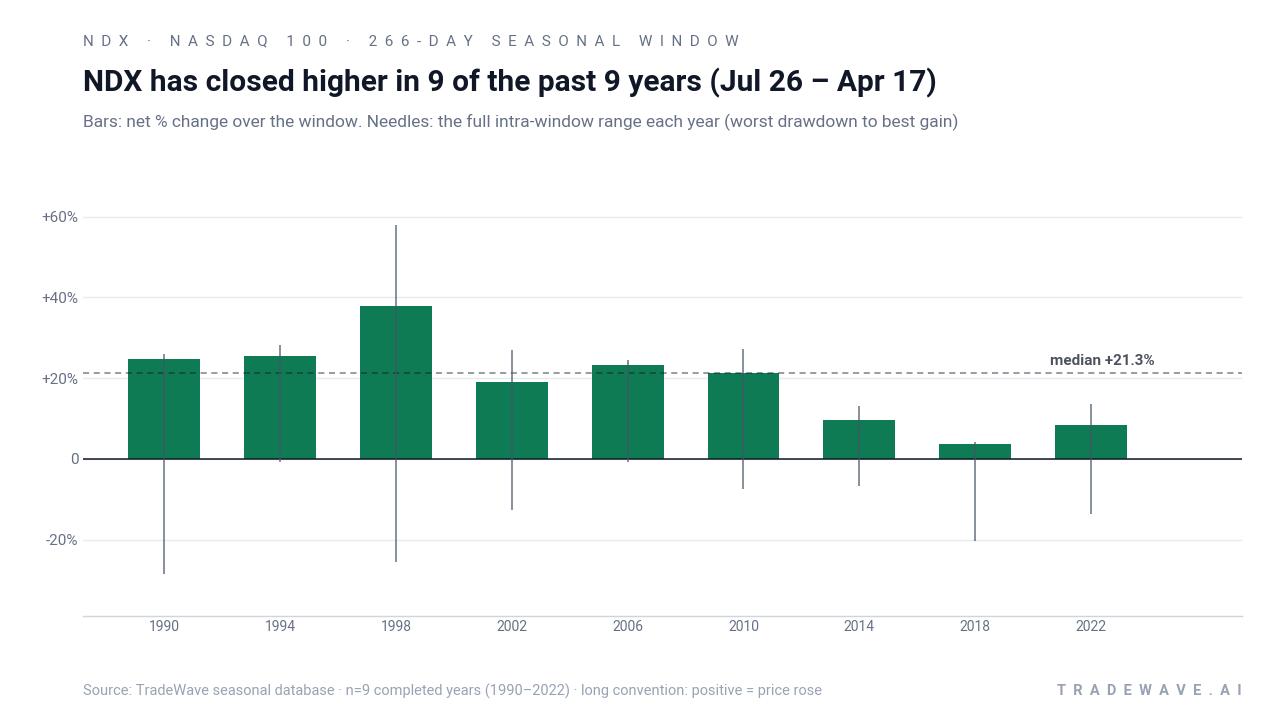
The stacked net, maximum favorable and maximum adverse bars make the trade-off clear. In most years, the best intraperiod rally has been meaningfully larger than the final net gain, while the worst drawdown has often been in the low double digits or more. For long investors, that has meant enduring sizable swings to capture the full seasonal payoff.
History does not guarantee future results; adverse excursions can be large even in winning windows, and past seasonal strength does not ensure similar outcomes in 2026–2027.
Why does Nasdaq 100 (NDX) follow this seasonal pattern?
This midterm-to-pre-election pattern may reflect a mix of earnings calendar clustering, policy clarity and institutional positioning. One likely driver is that many large-cap tech and growth companies in the Nasdaq 100 report key quarters and update guidance during this stretch, giving investors more confidence to add risk after early-year volatility. Analysts have also pointed to the way fiscal and regulatory agendas tend to settle after the midterm vote, which can reduce headline risk for growth stocks and encourage portfolio managers to rotate back into technology ahead of the presidential election year.
What is driving Nasdaq 100 (NDX) today?
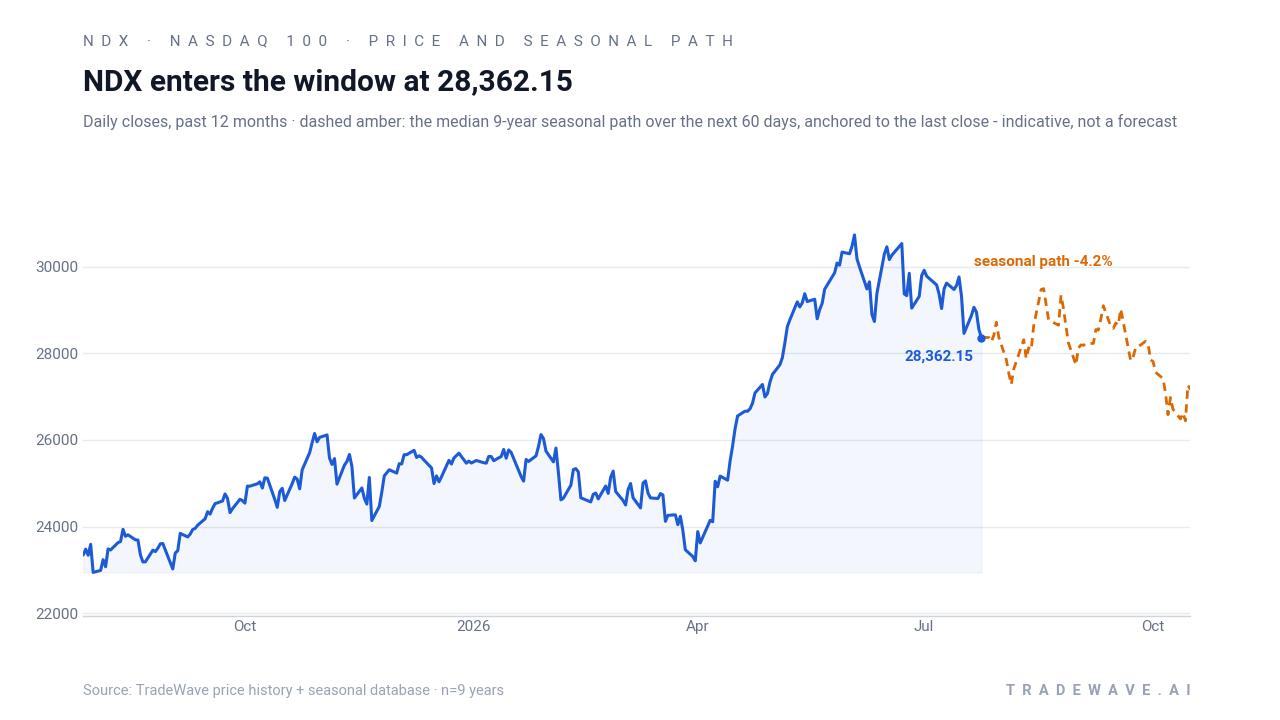
The Nasdaq 100 closed the prior session at 29,774.75, up 656.51 points or 2.25%, after trading between 28,991.52 and 29,792.63 on heavy volume of about 1.6 billion shares. That puts the index roughly 3.2% below its 52-week high of 30,762.20 and well above its 50-day moving average of 28,949.83, underscoring how strong the recent uptrend has been. Market coverage has highlighted repeated record closes for major U.S. benchmarks in recent months, with the Nasdaq 100 acting as a barometer for technology and growth leadership as mega-cap names continue to dominate index performance.[1]
The chart below situates the latest move in its recent multi-month context alongside a short-term seasonal projection.
How does the election cycle shape the Nasdaq 100 seasonal outlook?
Pattern phase and calendar phase are aligned here: the TradeWave window is built from the last nine midterm election years, and 2026 is itself a midterm election year. Historically, midterms have been “two-playbook” years for U.S. equities, with choppier behavior early in the year and stronger performance from late Q3 into the following summer as policy uncertainty fades and investors look ahead to the pre-election year. For a tech-heavy benchmark like the Nasdaq 100, that has often meant that volatility around regulation, antitrust and tax debates in the first half gives way to a more constructive backdrop once the midterm results are known and the policy calendar shifts toward growth and innovation themes.[1]
In this context, the upcoming 266-day window starting Jul 26 sits squarely in the historically stronger half of the midterm year and extends into the year before the presidential election, which has often been one of the more supportive phases for risk assets. The fact that the Nasdaq 100 is already near record levels does not negate the pattern, but it does raise the stakes: if the index were to struggle through a window that has been 9-for-9 historically, that would be a notable break from the usual election-cycle script.
What should traders watch as this seasonal window approaches?
First, the calendar. The key date is Jul 26, when the 266-day midterm-year window formally opens and the historical NDX seasonal trend suggests a long-biased regime that runs deep into 2027. Traders will be watching whether the index can hold above its 50-day moving average and challenge the 52-week high near 30,762.20 as that date approaches, or whether profit-taking emerges into strength.
Second, the macro and policy tape. Midterm years often bring regulatory headlines for large-cap tech, and 2026 has already featured debate over index rules and market structure that could influence how quickly new heavyweights enter the Nasdaq 100.[1] Any shift in antitrust enforcement, digital regulation or tax policy could either reinforce or cut against the historical pattern, especially if it changes earnings expectations for the index’s biggest constituents.
Third, behavior inside the window itself. In prior cycles, even winning years have seen double-digit drawdowns before finishing higher, so traders will be watching how the index reacts to 10% to 20% pullbacks if they occur. A familiar script would see sharp but contained setbacks followed by renewed buying that keeps the longer seasonal path intact. A break from that script, with deep drawdowns that fail to recover or a sustained inability to make new highs, would be an early sign that this midterm-to-pre-election window is diverging from its historical playbook.
Finally, sector leadership within the Nasdaq 100 will matter. The index is heavily tilted toward mega-cap technology and growth names, and prior midterm-year windows have often rewarded investors who stayed aligned with that leadership rather than rotating away too early.[1] If breadth within the index narrows sharply or leadership shifts toward more defensive groups during a window that has historically favored risk-on behavior, that would be another signal that the pattern may be weakening.
Sources
About this seasonal analysis
Seasonal pattern data is sourced from TradeWave.ai, which analyzes historical price behavior across annual calendar windows going back up to 30 years. Read the full data methodology or the book The 100-Year Pattern by Afshin Moshrefi (2026 edition). Past performance of seasonal patterns does not guarantee future results. This article is for informational purposes only and does not constitute investment advice.