This 51-Day Midterm Window Has Delivered 100% Winners for DTE Energy (DTE)
DTE Energy is approaching a 51-day midterm-year seasonal window that has never produced a loss in the last 10 cycles, just as the stock trades near a 52-week high and investors focus on data center-driven power demand.
Price as of Jun 30, 2026: $152.37 (last close).

What is the seasonal pattern for DTE Energy (DTE)?
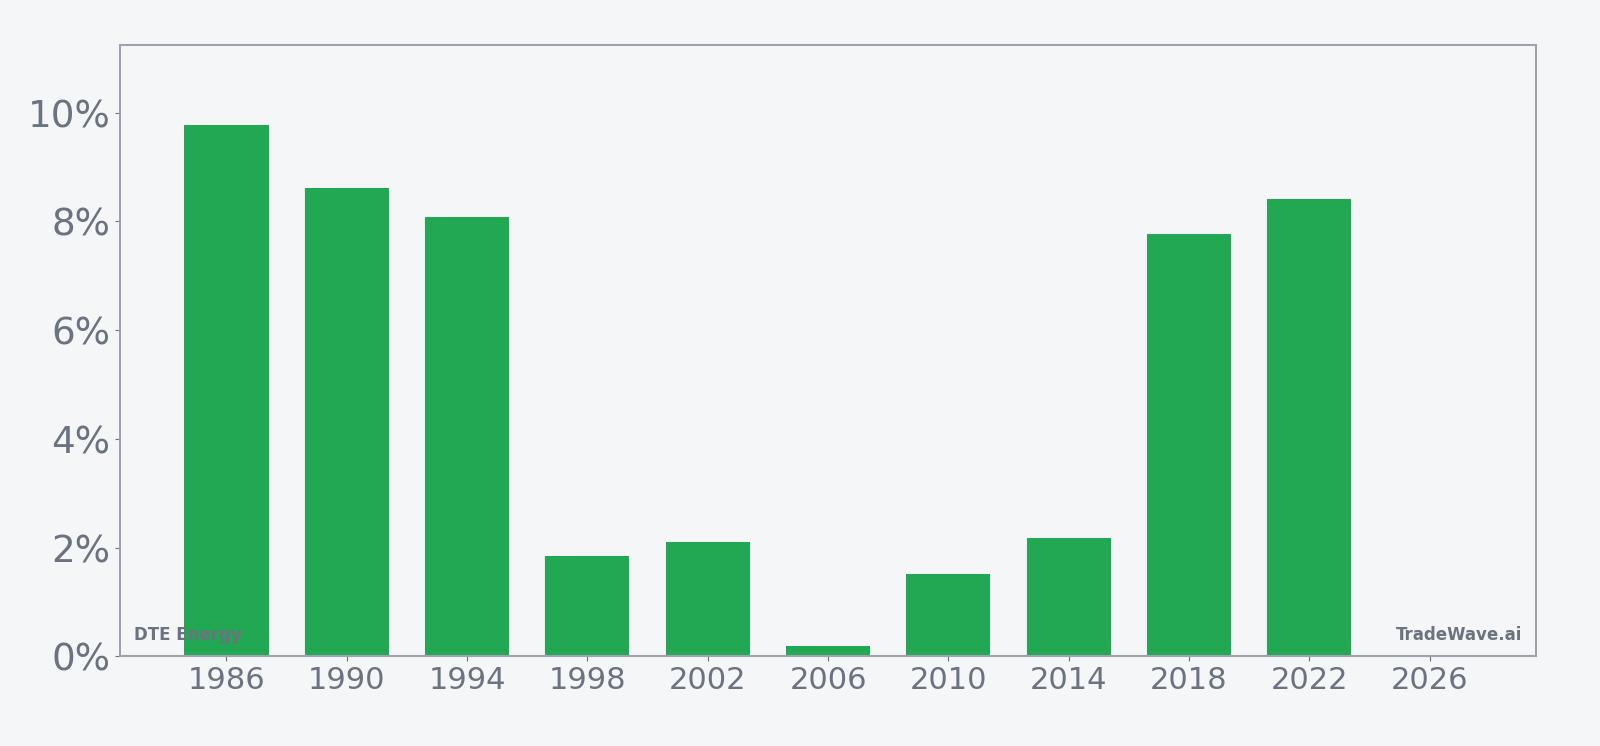
DTE Energy has risen in 10 of 10 midterm-year summer windows starting around Jul 2, with an average gain of 5.05% in winning years.
- 10 for 10 in this 51-day midterm-year window, with average gains of 5.05% in winning years.
- Percent Profitable is 100%, with 10 winners and 0 losers across the last 10 midterm election years.
- The upcoming window begins Jul 2 and runs for 51 calendar days, covering much of the late-summer trading period.
- Trade Direction is long, with a TradeWave Ratio of 1.74 and a Sharpe ratio of 1.2, pointing to historically favorable risk-adjusted returns.
- Individual years have seen sizable swings inside the window, including adverse moves over 20% in weaker tapes, even when the final result was positive.
- Add it up: a 62% cumulative return across these ten midterm-year windows, all of them profitable for long exposure.
According to historical data from TradeWave.ai, this midterm-year stretch has behaved very differently from an average summer for DTE Energy, and the next iteration starts this week.
How has DTE Energy (DTE) traded in this midterm-year summer window?
DTE Energy has rallied in every single one of the last 10 midterm election years during the 51 calendar days starting around Jul 2, averaging a 5.05% gain for long positions. Shares finished Tuesday at $152.37, down 1.1% on the day and about 1.7% below their 52-week high of $155.06, after a strong 10.72% run over the past month.
Because this pattern is grouped by the presidential election cycle, it only looks at midterm election years, which tend to feature a different policy and rate backdrop than election years or the year before an election. For utilities like DTE, midterm years often coincide with regulatory reviews, infrastructure planning and rate-case positioning that can shape investor expectations over the summer.
The raw win–loss record is striking. Across the last 10 midterm election years in this specific 51-day window, DTE Energy has posted 10 winners and 0 losers, for a Percent Profitable reading of 100%. Average gains in those winning years come in at 5.05%, with a median outcome of 4.97%, and the cumulative return across all ten windows totals 62% for long exposure.
Trade direction for this setup is explicitly long, and the risk-adjusted profile has been solid rather than explosive. The Sharpe ratio of 1.2 indicates that, based on end-of-window outcomes, returns have been meaningfully positive relative to volatility. The TradeWave Ratio of 1.74 suggests that price has typically traveled a fair distance in the trade direction inside the window, even before considering where it ultimately closed.
Individual years show a range of outcomes that matter for traders thinking about path, not just destination. The strongest net return in the sample came in 1986, when DTE gained 9.78% during the window, with a best intraperiod run-up of 11.28% from the entry price. More recently, 2022 delivered an 8.41% net gain with a 10.13% peak move in the trade direction, while even the softer years such as 2006 and 2010 still finished slightly positive at 0.2% and 1.52% respectively.
Drawdowns inside the window have been very real, even in years that finished green. The most extreme example is 2002, when the stock ultimately gained 2.1% but suffered a worst intraperiod drawdown of 23.05% from the entry level before recovering. Other years, such as 1998 and 2014, saw adverse excursions of 4.13% and 5.39% respectively, reminding traders that a positive seasonal bias has not meant a smooth ride.
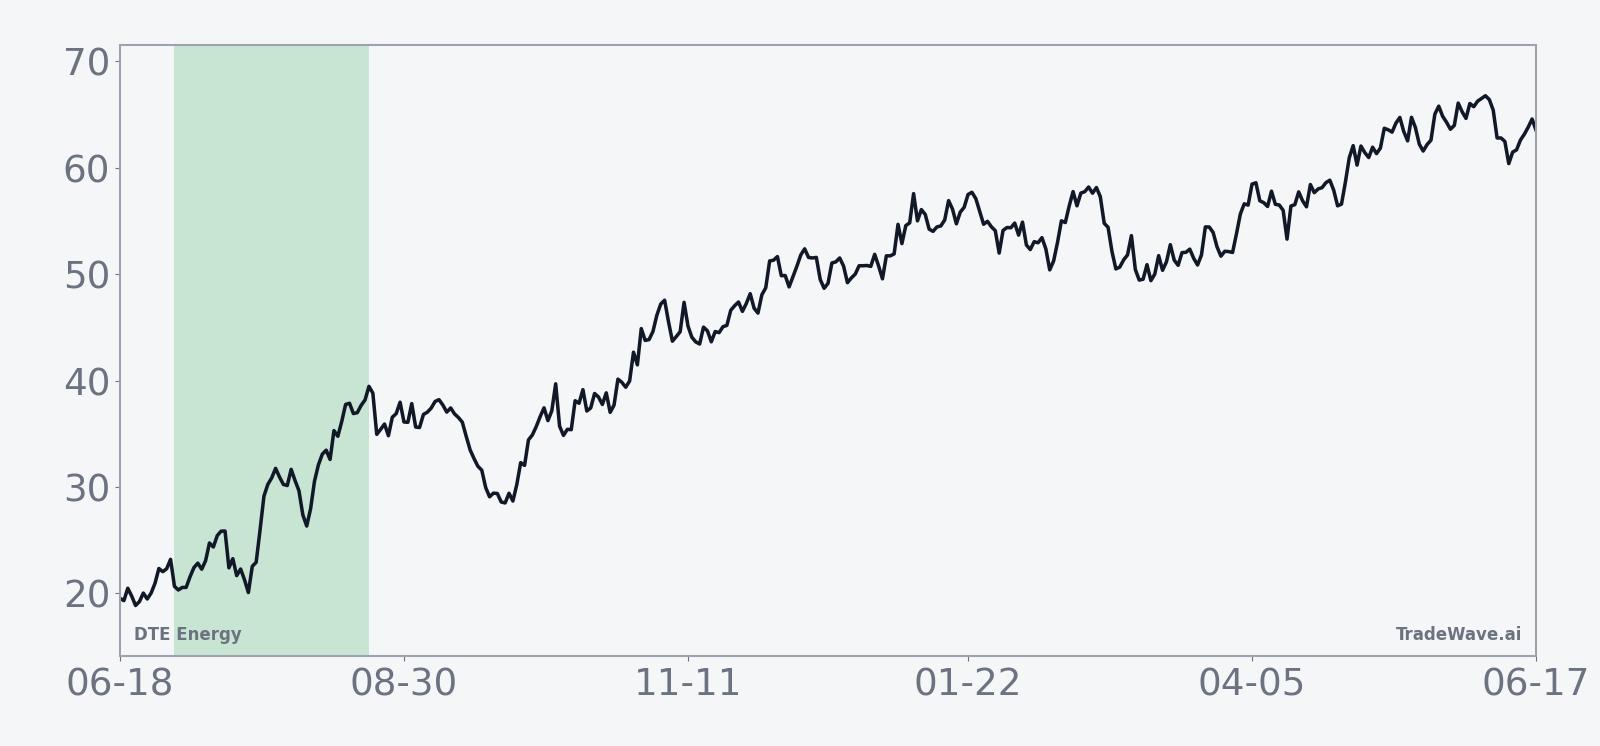
The historical seasonal trend line for this window tilts steadily higher rather than spiking in a single burst. In many of the past midterm years, gains have tended to accrue gradually across the 51 days, with a modest acceleration in the back half of the window rather than a front-loaded pop.
A closer look at yearly net returns alongside best and worst intraperiod swings shows how upside and downside have coexisted inside this bullish pattern.
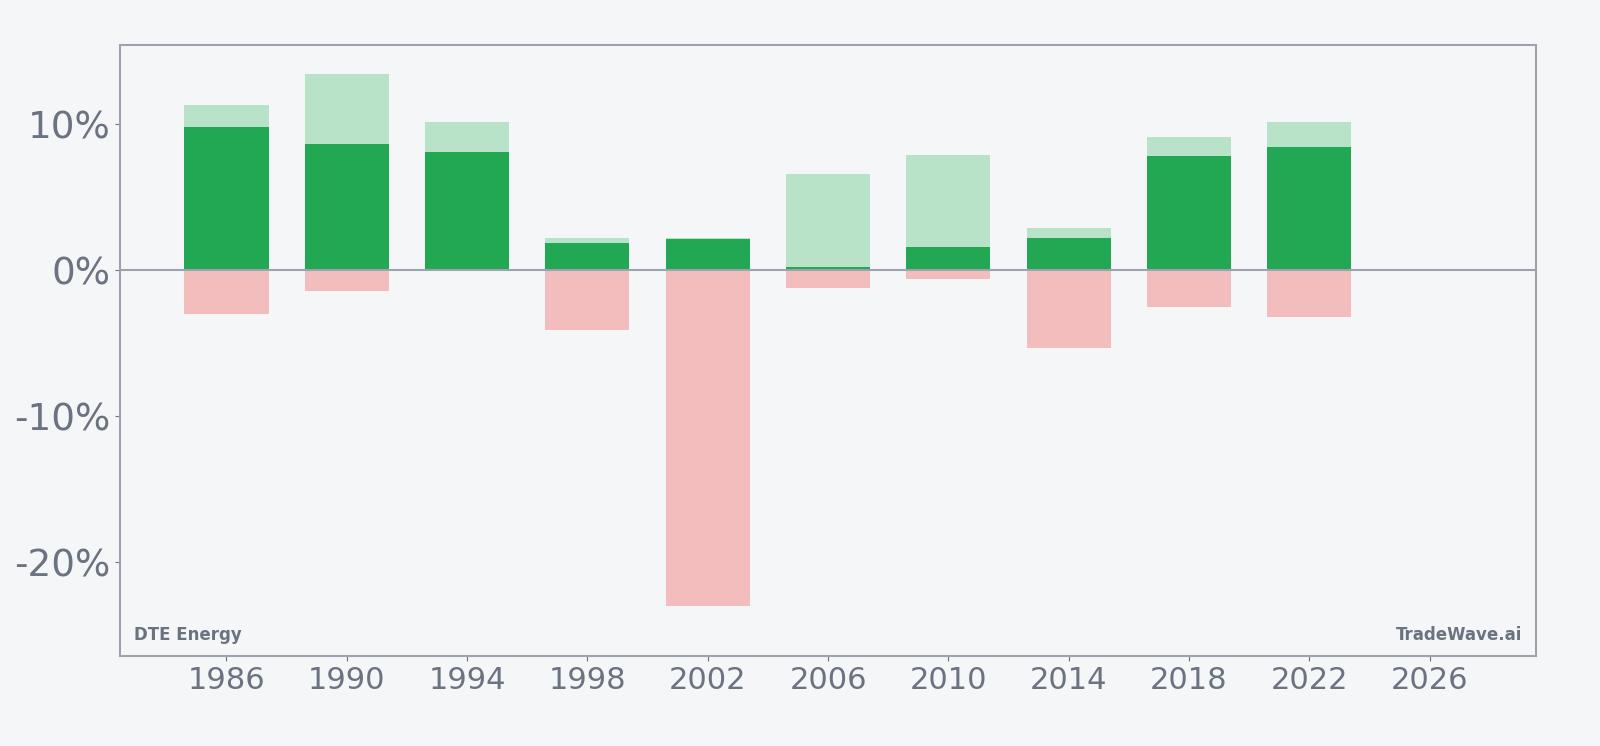
The combined net/MFE/MAE bar profile shows that most years delivered a clear positive run-up in the trade direction, but several also featured meaningful downside air pockets before finishing higher. Large favorable excursions paired with contained adverse moves in years like 1986 and 2022 contrast with the 2002 pattern, where the stock endured a deep drawdown before clawing back to a small gain.
History does not guarantee future results; adverse excursions can be large even in winning windows, and traders should size positions with that path risk in mind.
Why does DTE Energy (DTE) follow this seasonal pattern?
One likely driver is the way midterm election years cluster regulatory and policy milestones for utilities, including rate cases and infrastructure planning that often land in the middle of the year. Analysts have also pointed to sector rotation, as investors look for defensive yield and stable cash flows in the summer when macro uncertainty and political noise tend to rise. For DTE specifically, this pattern may reflect recurring expectations around capital spending, grid upgrades and demand trends that get repriced as the year’s outlook becomes clearer.
What is driving DTE Energy (DTE) today?
DTE Energy closed the prior session at $152.37, down 1.1% on the day, after trading between $151.74 and $153.68 on volume of about 990,000 shares. The stock sits roughly 1.7% below its 52-week high of $155.06, with a 10.72% gain over the past month, and is trading above its 50-day moving average of $143.67 on lighter-than-average 20-day volume of about 1.48 million shares.
Fundamentally, the story investors are watching is the potential step-change in electricity demand from artificial intelligence and cloud data centers. In July 2025, DTE told investors it was in talks to supply several gigawatts of power to Big Tech data centers, a load that could require new battery storage and possibly additional natural gas-fired generation capacity to support the grid.[1] On the same day, the company reported second-quarter 2025 results that missed Wall Street’s profit estimates but showed rising earnings in its electric segment and reaffirmed full-year guidance, underscoring how grid and infrastructure spending are becoming central to the investment case.[1]
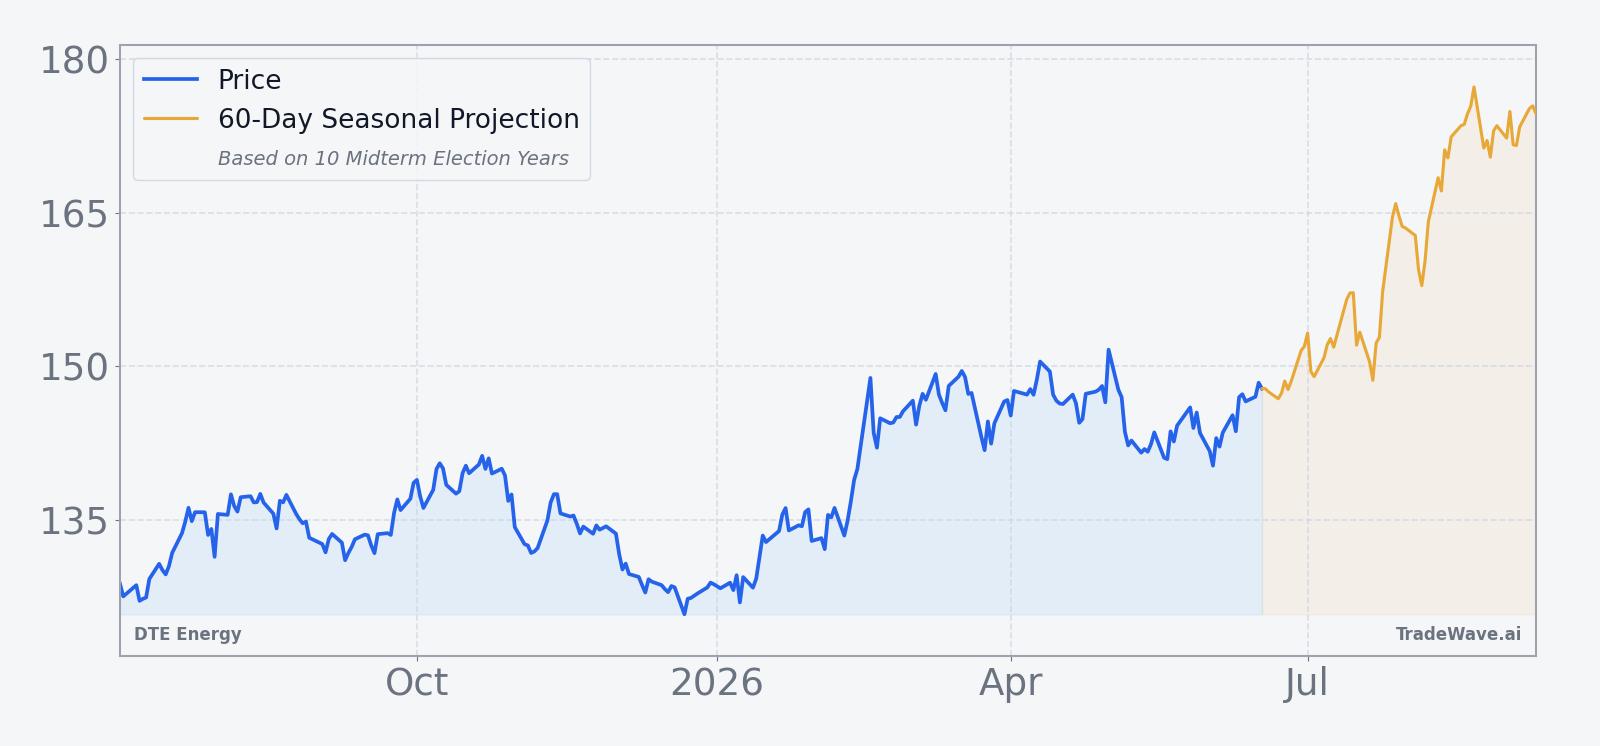
The chart below situates the latest move in its recent multi-month context, alongside a 60-day seasonal projection based on prior midterm-year behavior.
What should traders watch in this upcoming window?
First, the calendar: the 51-day midterm-year window beginning Jul 2 has historically been a sweet spot for DTE, and behavior inside this stretch will show whether the 10-for-10 record can hold. A sustained bid that keeps the stock above its 50-day moving average and challenges or breaks the $155 area would be consistent with the historical seasonal trend, while a failure that sees DTE trade materially below recent support would mark a clear departure from the pattern.
Second, watch how the policy and infrastructure narrative evolves as the United States moves deeper into the midterm election year. Any concrete updates on data center load commitments, battery storage projects or new generation plans could influence how investors price DTE’s long-term earnings power and capital needs, especially if those announcements cluster inside this seasonal window.[1][2] Finally, monitor volatility: if intraperiod swings start to resemble the deeper drawdowns seen in years like 2002, that would signal that even a historically strong window can carry meaningful downside risk before any potential recovery.
Sources
About this seasonal analysis
Seasonal pattern data is sourced from TradeWave.ai, which analyzes historical price behavior across annual calendar windows going back up to 30 years. Read the full data methodology or the book The 100-Year Pattern by Afshin Moshrefi (2026 edition). Past performance of seasonal patterns does not guarantee future results. This article is for informational purposes only and does not constitute investment advice.