Merck & Co. (MRK) Has Climbed in 15 of 15 Midterm Aug 22-Jan 7 Windows, Averaging 13.24% Gains
Merck & Co. is trading just below its 52-week high as it approaches an Aug 22–Jan 7 window that has delivered gains in every midterm election year in the past sample, giving traders a rare, clean seasonal backdrop around drug-pricing and deal headlines.
Price as of Jul 24, 2026: $131.07 (last close).
What is the seasonal pattern for Merck & Co. (MRK)?
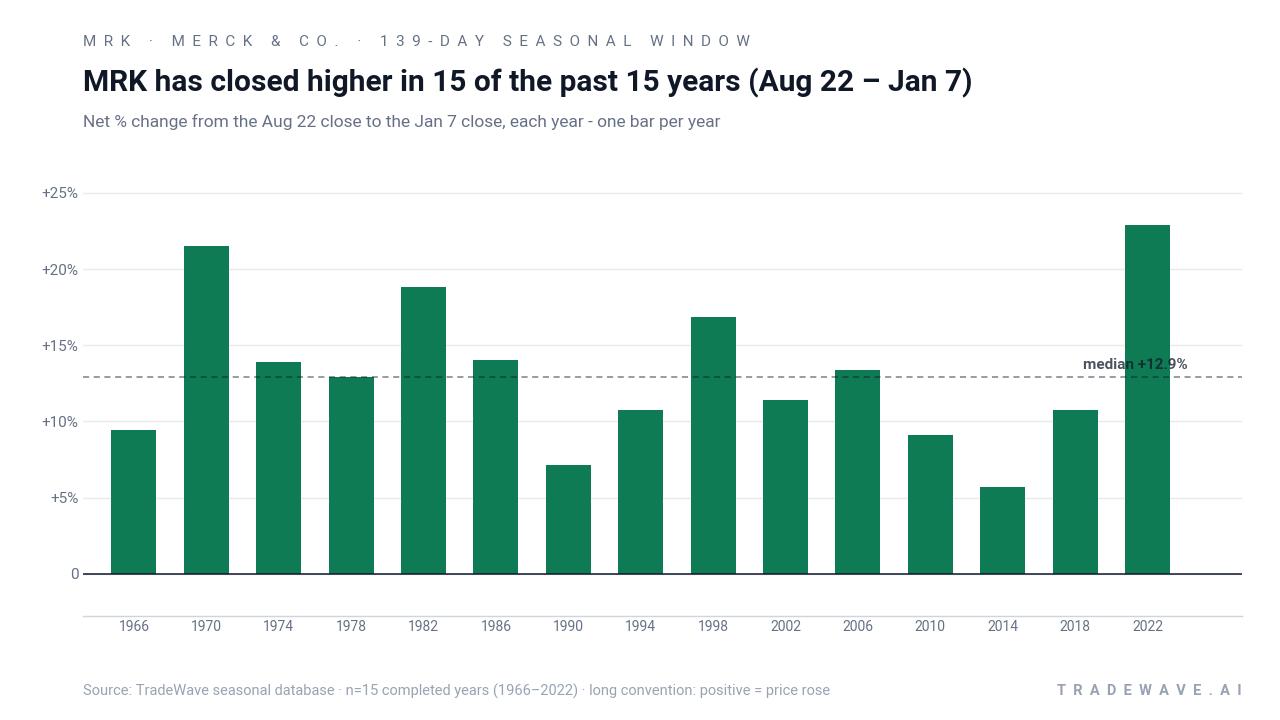
Merck & Co. has risen in 15 of 15 midterm election years during the Aug 22–Jan 7 window, with an average gain of 13.24% in winning years.
- 15 for 15 in this window, averaging 13.24% gains in winning years across the last 15 midterm election years.
- Seasonal window runs from Aug 22 through Jan 7, spanning 139 calendar days that have historically favored long positions in MRK.
- Percent Profitable is 100%, with 15 winners and 0 losers in the historical sample.
- Average profit of 13.24% compares with a median gain of 12.93%, pointing to a tight cluster of double-digit advances.
- TradeWave Ratio of 2.64 suggests price has typically traveled meaningfully in the trade direction within the window, while a Sharpe ratio of 2.35 reflects strong risk-adjusted returns.
- Individual years have still seen sizable intraperiod drawdowns, so the path has not been a straight line even in a perfect win record.
According to historical data from TradeWave.ai, this late-August through early-January stretch has behaved very differently from an average quarter for Merck & Co., and the next iteration is less than a month away.
How strong is Merck & Co. (MRK) in the Aug 22–Jan 7 seasonal window?
Merck & Co. has posted gains in 15 of the last 15 midterm election years during the Aug 22–Jan 7 window, with average profits of 13.24% for long positions. Shares finished Monday at $131.07, up 0.5% on the day and about 0.5% below their 52-week high of $131.74, leaving the stock effectively at record territory heading into this historically strong stretch. That combination of a clean 100% win record and a stock already pressing new highs makes this upcoming MRK seasonal trend hard for traders to ignore.
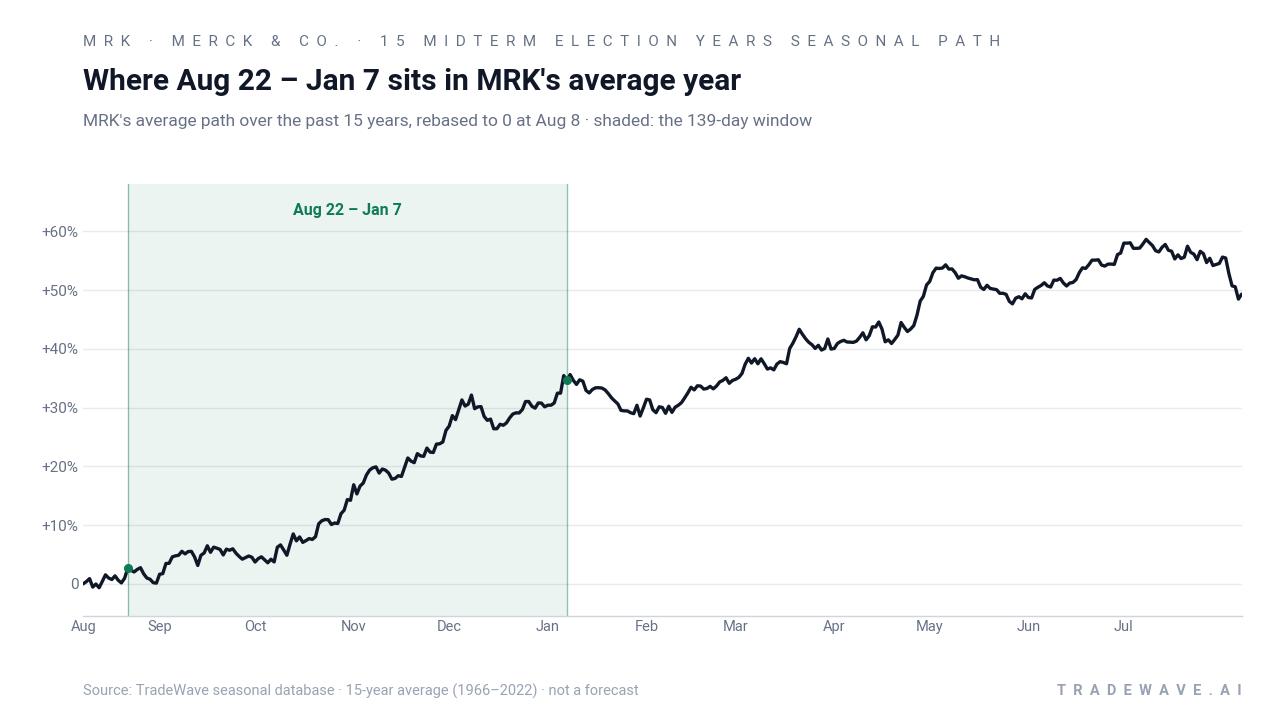
Because this pattern is grouped by the presidential election cycle, it reflects how MRK has behaved specifically in midterm election years, not in a random run of calendar years. Midterm years often bring heavier policy noise around drug pricing and Medicare negotiations, so the fact that this particular late-year window has still delivered consistent upside suggests institutional flows and portfolio rebalancing have outweighed headline risk for large-cap pharma in this phase.[3]
Across the 15 midterm-year samples, the median gain of 12.93% sits close to the 13.24% average, which tells you the wins have been steady rather than driven by one or two outliers. The weakest year in the per-year table, 2014, still saw MRK up 5.68% from Aug 22 to Jan 7, while the strongest, 2022, delivered a 22.87% net return over the same dates. Add it up and stacking this 139-day window across the sample compounds to roughly 536% cumulative gains.
A second view shows how each year’s net gain sits inside its full intraperiod range, from worst drawdown to best rally.
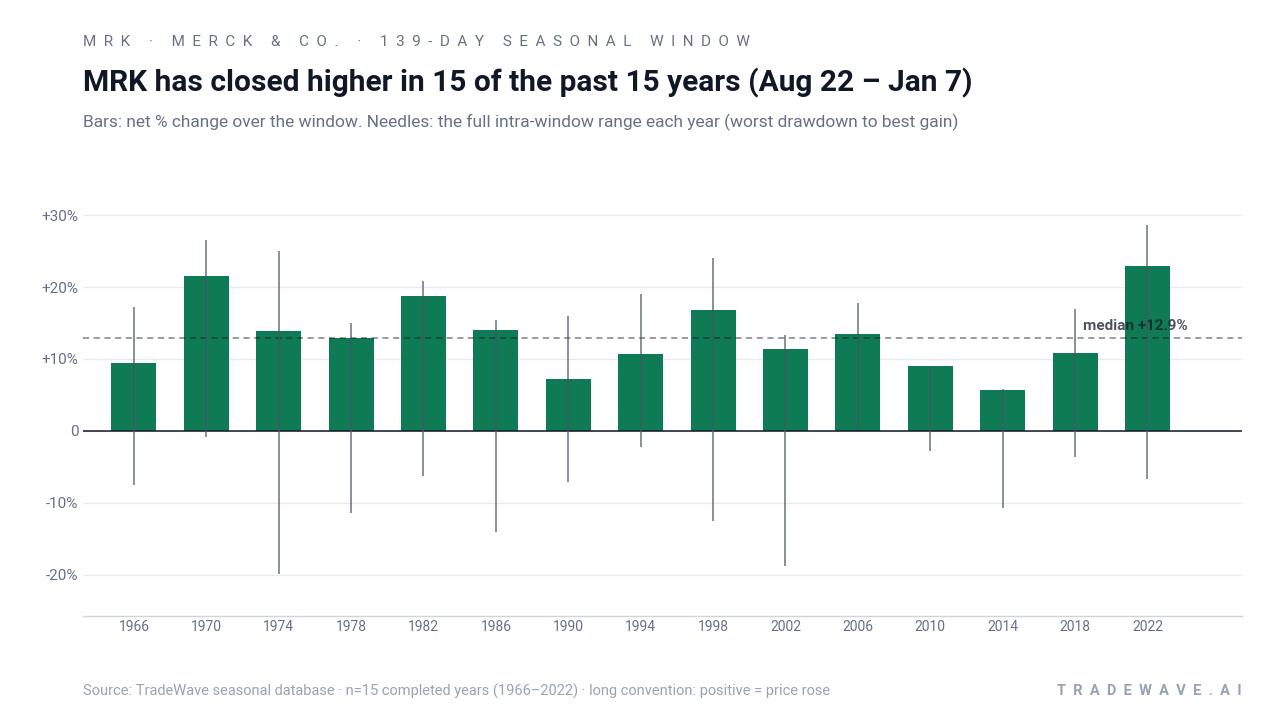
Those bars and needles show why this MRK seasonal pattern has appealed to long-only traders. In strong years like 1998 and 2022, the maximum favorable move within the window reached 24.09% and 28.56% respectively, while the final closes still locked in double-digit gains. At the same time, several years carried meaningful downside swings along the way, with worst drawdowns such as an 18.81% slide in 2002 and a 14.02% dip in 1986 before the stock recovered to finish higher.
The TradeWave Ratio of 2.64 captures that tendency for MRK to travel a long way in the trade direction during this stretch, even when the final net gain is smaller than the peak run-up. The Sharpe ratio of 2.35, based on end-of-window outcomes, signals that the payoff has historically been strong relative to volatility, especially compared with more mixed parts of the calendar. Put simply, this has been one of MRK’s cleanest long-biased windows in the midterm-year playbook.
History does not guarantee future results; adverse excursions can still be large within the window, and past MAE levels show that even winning years have included sharp drawdowns.
Why does Merck & Co. (MRK) follow this seasonal pattern?
One likely driver is the way midterm election years cluster key catalysts for big pharma between late summer and early January, from major oncology conferences to year-end formulary decisions and Medicare pricing updates.[3] Analysts have also pointed to institutional portfolio rebalancing into defensive healthcare stocks late in the midterm year as investors look past policy noise toward the historically stronger pre-election year. For a name like Merck, where oncology and pipeline deals dominate the story, that combination of event flow and risk rotation may help explain why this specific window has repeatedly favored the long side.
What is driving Merck & Co. (MRK) today?
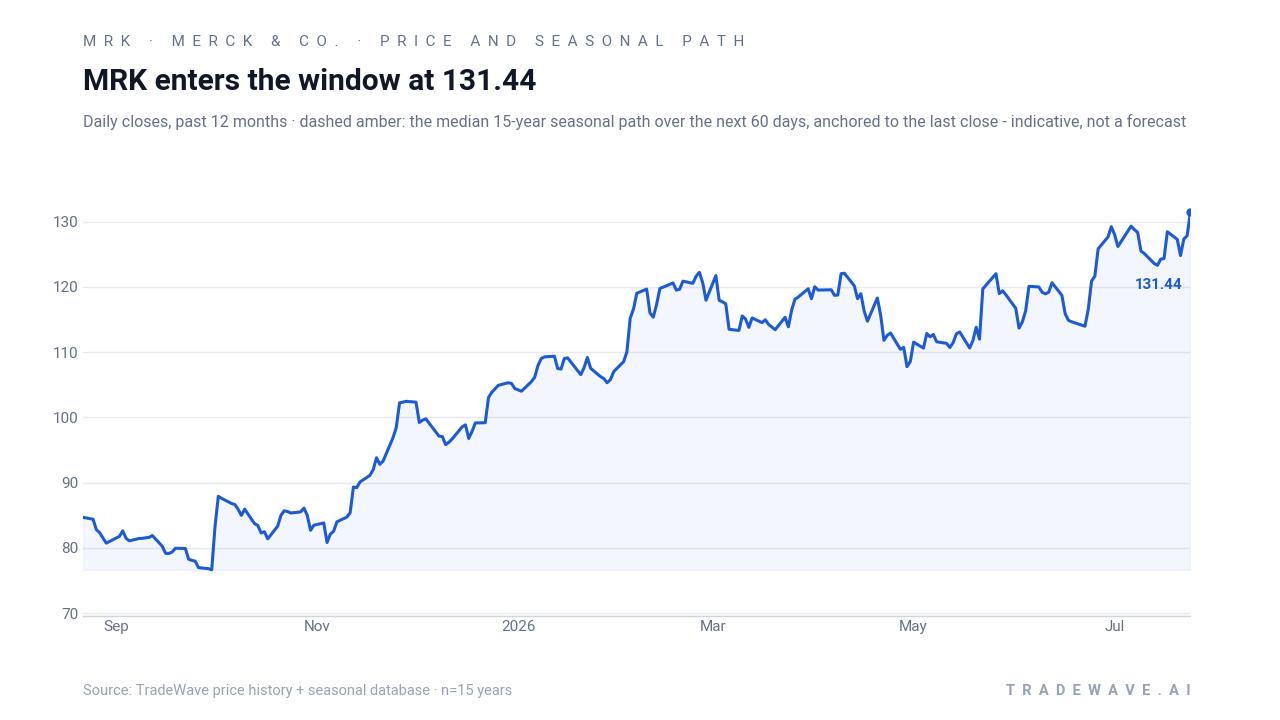
MRK ended the prior session at $131.07, up 0.59 points or 0.5%, with the stock trading in a tight intraday band between $130.24 and $131.71 on volume of about 6.1 million shares. That leaves Merck roughly 0.5% below its 52-week high of $131.74 and well above its 50-day moving average near $120.36, underscoring how strong the tape has been into late July.
Fundamentally, the story is still about balancing blockbuster Keytruda growth against looming patent expirations and Medicare price negotiations. In Feb 2026, Merck projected 2026 sales of $65.5 billion to $67.0 billion, below some analyst expectations, as management flagged headwinds from patent losses and U.S. drug-pricing reforms that could pressure parts of the portfolio.[3] At the same time, the company has been leaning hard into oncology and new growth drivers, building a dedicated cancer division and pursuing acquisitions to extend its pipeline beyond Keytruda’s eventual loss of exclusivity.[6][13]
On Apr 30, 2026, Merck reported first-quarter revenue of $16.29 billion, topping estimates and prompting an increase in adjusted 2026 EPS guidance to a range of $5.04 to $5.16, even as GAAP results showed a net loss tied to acquisition-related charges.[4] That print followed a string of late-2025 catalysts, including Q3 2025 results where Keytruda sales rose about 10% to $8.1 billion, offsetting a drop in Gardasil, and a series of regulatory wins that expanded Keytruda’s label and introduced a subcutaneous formulation in Europe.[5][1]
Deal-making has been another key driver. In Nov 2025, Merck agreed to buy Cidara Therapeutics for about $9.2 billion to secure a long-acting flu prevention asset, a move Reuters framed as part of a broader push to diversify ahead of Keytruda’s patent cliff.[9] In Jan 2026, reports surfaced that Merck was in talks to acquire Revolution Medicines for roughly $30 billion, reinforcing the message that management is willing to spend to bulk up its oncology and targeted-therapy pipeline.[2] A separate March 2026 report said Merck was nearing a $6 billion deal for Terns Pharma, again focused on cancer assets.[13]
Strategically, Merck has told investors it expects roughly $70 billion in revenue from new growth drivers by the mid-2030s, with larger contributions from cardiometabolic, respiratory and infectious disease portfolios alongside oncology.[6] That long-term guidance, delivered in Jan 2026, helped frame the recent acquisition spree as part of a deliberate shift rather than opportunistic deal-chasing. For traders watching the MRK seasonal pattern, the key question is how this pipeline build-out and policy backdrop intersect with a late-year window that has historically rewarded long exposure.
The chart below shows MRK’s recent climb toward record highs alongside the median 60-day seasonal path heading into the upcoming window.
What should traders watch as this MRK seasonal window approaches?
First, the calendar. The next iteration of the Aug 22–Jan 7 window begins in less than a month, right as the U.S. midterm election year moves into its late phase and investors start to look ahead to the pre-election year, which has often been friendlier for risk assets. For MRK, that timing lines up with a period when drug-pricing headlines, Medicare negotiations and year-end portfolio rebalancing can all hit at once, historically without derailing the stock’s late-year strength.[3]
Second, price levels. With MRK sitting just below its 52-week high and well above its 50-day moving average, traders will be watching whether any pullbacks into August resemble the historical pattern of intraperiod drawdowns that ultimately resolved higher. A shallow dip that holds above the 50-day line would be consistent with prior midterm-year windows, while a deeper break that undercuts that moving average would mark a clear departure from the typical MRK trading window behavior.
Third, the policy and deal tape. Any fresh guidance on 2026–2027 sales, updates on Medicare price negotiations, or confirmation of large oncology acquisitions such as the reported Revolution Medicines and Terns Pharma talks could all influence how comfortable institutions feel leaning into healthcare defensiveness late in the year.[2][3][13] If those headlines reinforce the story of a diversified post-Keytruda pipeline and manageable pricing pressure, they would rhyme with the historical pattern of MRK strength in this midterm-year slice.
Finally, volatility inside the window. The historical record shows that even in a perfect 15-for-15 run, MRK has often experienced sizable maximum adverse moves before finishing higher. Traders who track intraday and multi-week swings will want to see whether any drawdowns after Aug 22 stay within the rough bounds of past MAE readings or break materially below them. A contained shakeout followed by renewed strength would fit the established MRK seasonal trend, while a sustained breakdown would be a clear sign that this midterm-year playbook is changing.
Sources
- Forbes – “Why Is Merck Stock Surging?” (Nov 26, 2025)
- Seeking Alpha – “Key deals this week: Merck, Glencore, CrowdStrike, Marvell Technology, Steel Dynamics and more” (Jan 10, 2026)
- Reuters – “Merck forecasts 2026 sales below estimates on patent losses” (Feb 3, 2026)
- CNBC – “Merck beats quarterly estimates on strength of Keytruda and new products, narrows outlook” (Apr 30, 2026)
- Reuters – “Merck posts higher third-quarter sales as Keytruda growth offsets drop from Gardasil” (Oct 30, 2025)
- Reuters – “Merck says new growth opportunities to drive revenue of $70 billion by mid-2030s” (Jan 13, 2026)
- Reuters – “Merck bets on flu prevention with $9.2 billion deal for Cidara Therapeutics” (Nov 14, 2025)
- Reuters – “Merck nears $6 billion acquisition of Terns Pharma to boost cancer portfolio, FT reports” (Mar 25, 2026)
- Forbes – “Is Merck Stock’s Run Legitimate?” (Dec 24, 2025)
About this seasonal analysis
Seasonal pattern data is sourced from TradeWave.ai, which analyzes historical price behavior across annual calendar windows going back up to 30 years. Read the full data methodology or the book The 100-Year Pattern by Afshin Moshrefi (2026 edition). Past performance of seasonal patterns does not guarantee future results. This article is for informational purposes only and does not constitute investment advice.