Abbott Laboratories (ABT) Has Rallied in 10 of 10 Midterm Aug-May Windows, Averaging 17% Gains
Abbott Laboratories is approaching a historically powerful Aug 26 to May 14 trading window just as the stock rallies on upgraded profit guidance and sector strength.
Price as of Jul 24, 2026: $103.06 (last close).

What is the seasonal pattern for Abbott Laboratories (ABT)?
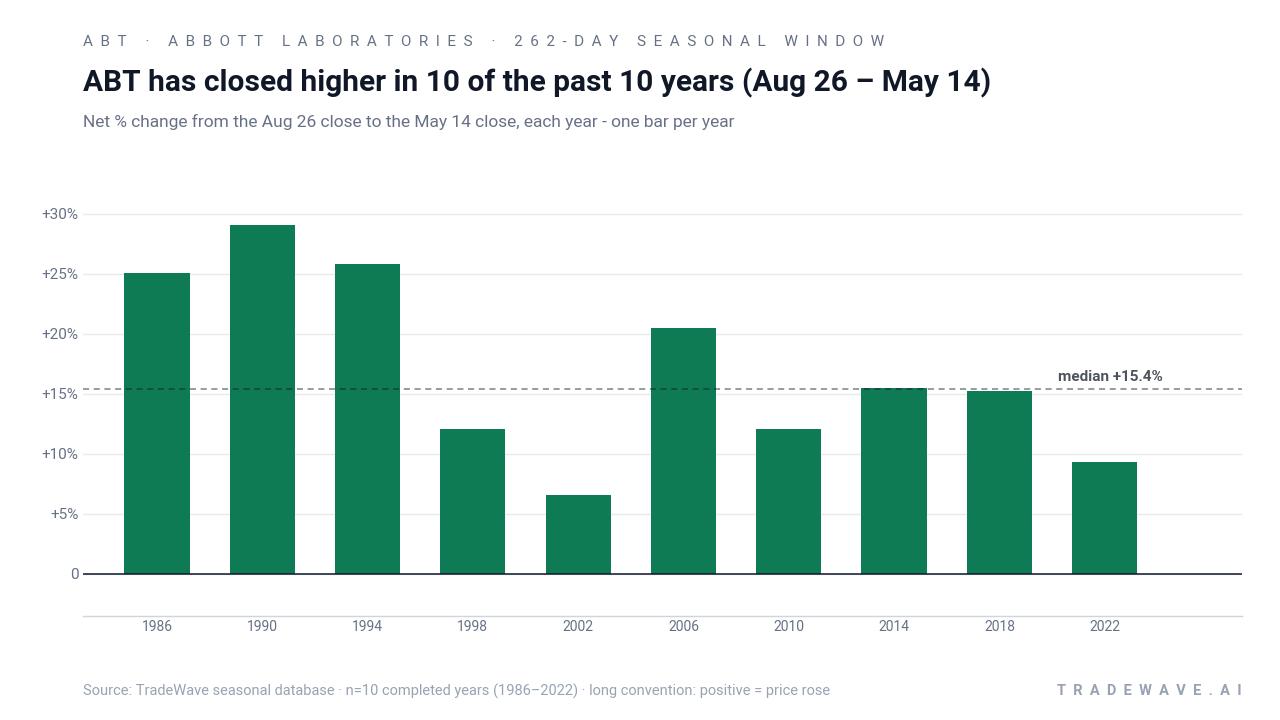
Abbott Laboratories has risen in 10 of 10 midterm-year Aug 26 to May 14 windows, with an average gain of 17.11% in winning years.
- 10 for 10 in this window, with Abbott Laboratories averaging 17.11% gains in winning years across the last 10 midterm election cycles.
- Seasonal window runs from Aug 26 through May 14, spanning 262 calendar days and aligning with the midterm-to-pre-election phase of the presidential cycle.
- Percent Profitable is 100%, with 10 winners and 0 losers for this long-direction pattern.
- Annualized return across the window clocks in at 16.89%, with a Sharpe ratio of 1.87 based on end-of-window outcomes.
- The TradeWave Ratio of 2.01 indicates that price has typically traveled meaningfully in the long direction within the window, not just at the final close.
- Individual years have still seen sizable drawdowns inside the window, with adverse moves reaching double digits before recovering to positive finishes.
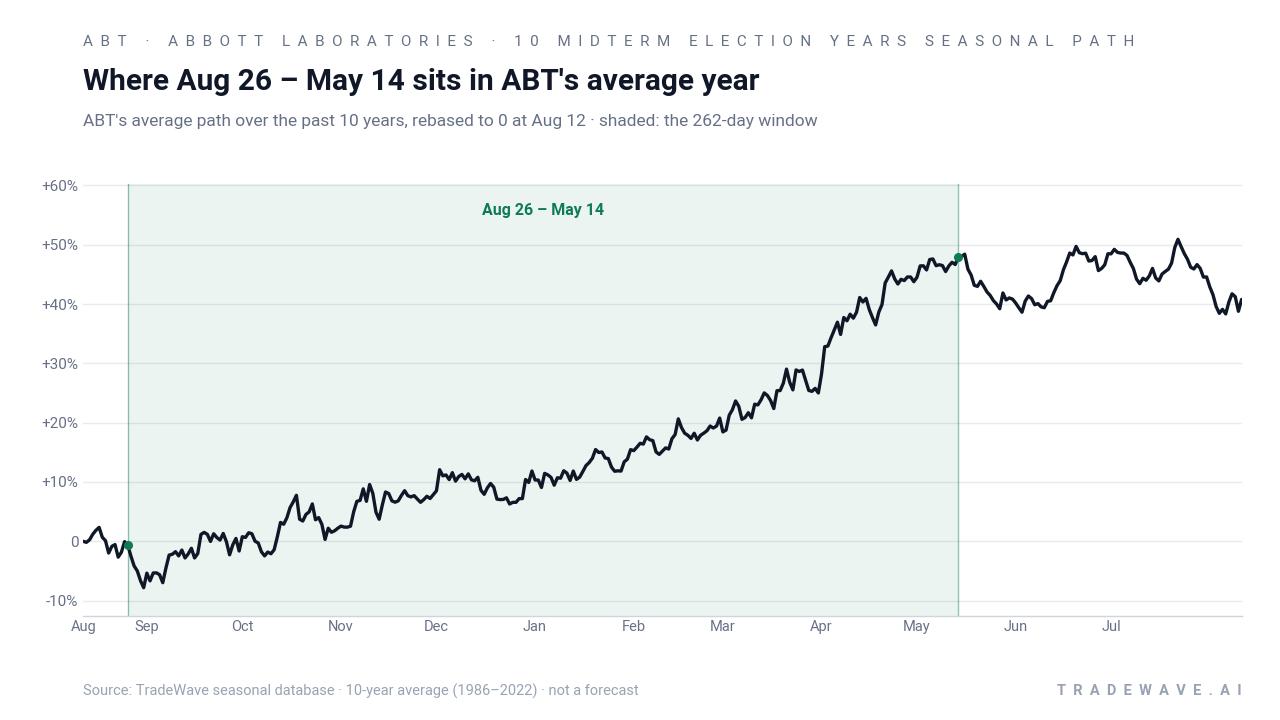
According to historical data from TradeWave.ai, this midterm-year stretch has behaved very differently from an average calendar year for Abbott Laboratories, with a distinct bias that shows up when you isolate the Aug 26 to May 14 window.
How strong is the upcoming seasonal window for Abbott Laboratories (ABT)?
Abbott Laboratories has risen in every single Aug 26 to May 14 window across the last 10 midterm election years, averaging 17.11% gains for long positions. The stock finished the prior session at 103.06 after a 2.3% jump, leaving it well off its 52-week low of 80.81 and below its 52-week high of 131.35. That combination of a clean 10-for-10 seasonal record and a stock that has just broken higher again after earnings puts an unusual spotlight on the next 262-day trading window.
The presidential election cycle matters here because this pattern is built only from midterm election years, a phase that often brings policy uncertainty, reimbursement debates and shifting healthcare budgets. In that context, Abbott’s diagnostics and medical devices franchise has historically seen capital rotate in during the late midterm and early pre-election stretch, and the Aug 26 to May 14 window captures that behavior.
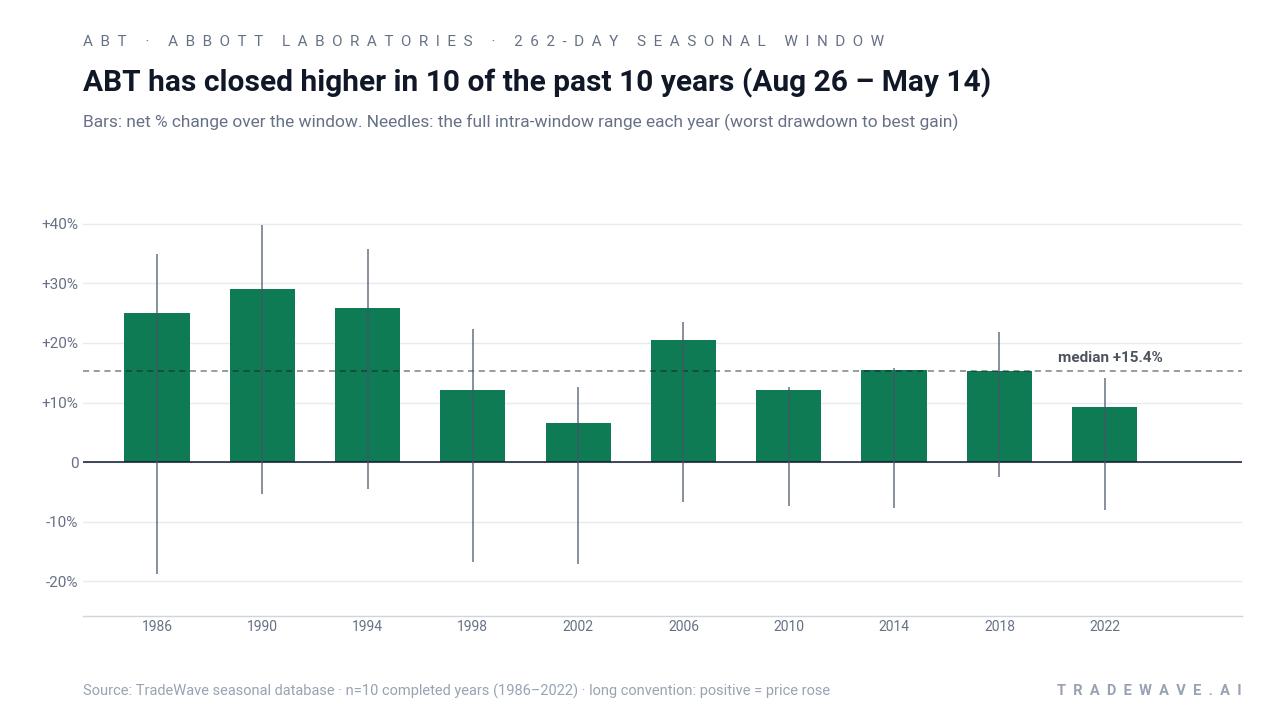
Year-by-year ranges show how much the stock has typically swung inside the window before finishing higher.
Across the 10 midterm-year samples, the long trade direction has been unambiguously favorable: 10 winners, 0 losers and a 100% hit rate. Average gains of 17.11% mask a wide spread, from a 6.55% advance in 2002 to a 29.03% jump in 1990, but every year finished in the green. The annualized return of 16.89% and a Sharpe ratio of 1.87 point to a window that has historically rewarded long exposure with relatively strong risk-adjusted outcomes.
Looking at individual years, 1990 stands out as one of the strongest, with a 29.03% net return and a maximum favorable move of 39.7% from the entry price before the window closed. On the softer side, 2002 still delivered a 6.55% gain but saw a maximum adverse move of 17.07% at one point, illustrating that even winning years have contained sharp pullbacks. The TradeWave Ratio of 2.01 captures this tendency for price to travel meaningfully in the trade direction within the window, not just drift to a modest positive finish.
The MFE and MAE profile shows a consistent pattern of early volatility followed by trend persistence. In several years, including 1986 and 1998, Abbott first suffered double-digit drawdowns of 18.71% and 16.76% respectively before recovering to double-digit gains by the end of the window. In others, such as 2014 and 2018, the worst intraperiod declines were contained to single digits while the stock ground higher, suggesting that the downside has not always been severe but has been present often enough to matter.
The cumulative chart for this midterm-year window compounds those outcomes into a striking picture: stacking the Aug 26 to May 14 trades across the 10 cycles would have produced a 376% cumulative return. Add it up and you get a pattern that has not just been positive on average but consistently so, with gains clustering across decades rather than in a single lucky stretch. The key takeaway is simple: in midterm election years, this long 262-day window has historically been one of Abbott’s most reliable bullish regimes.
History does not guarantee future results; adverse excursions (MAE) can be large even in winning windows.
Why does Abbott Laboratories (ABT) follow this seasonal pattern?
One likely driver is the way Abbott’s earnings calendar and product launches line up with the policy-heavy midterm and pre-election period, when healthcare spending and reimbursement expectations often reset. Analysts have also pointed to institutional portfolio repositioning into defensive growth names like medical devices and diagnostics as macro uncertainty peaks in midterm years. This pattern may reflect that slow rotation, with investors steadily adding exposure from late August through the following spring as visibility on regulation, rates and hospital budgets improves.
What is driving Abbott Laboratories (ABT) today?
Abbott shares closed at 103.06 in the prior session, up 2.3% on the day, extending a sharp rebound that has carried the stock well above its 52-week low of 80.81 but still below its 52-week high of 131.35. The latest leg higher followed Abbott’s Jul 16 earnings report, where the company beat second-quarter profit and revenue expectations and raised its 2026 adjusted profit forecast to a range of $5.45 to $5.60 per share, helped by strength in diagnostics and medical devices.[4] That same day, the stock logged its best single session in 24 years and briefly led the S&P 500, underscoring how quickly sentiment has flipped from the more cautious tone that followed earlier guidance trims tied to the Exact Sciences acquisition.[1][5]
Beyond earnings, Abbott has had to manage operational headlines. On Jul 17, the company disclosed two separate cyber incidents affecting its cancer diagnostics business and a LabCentral portal, though it said operations were not affected and there was no evidence of data misuse.[13] For a diagnostics and devices group that sits at the intersection of healthcare and data, the lack of operational disruption helped keep the focus on fundamentals rather than security risk.
The chart below situates the latest move in its recent multi-month context, alongside the median 60-day seasonal path.
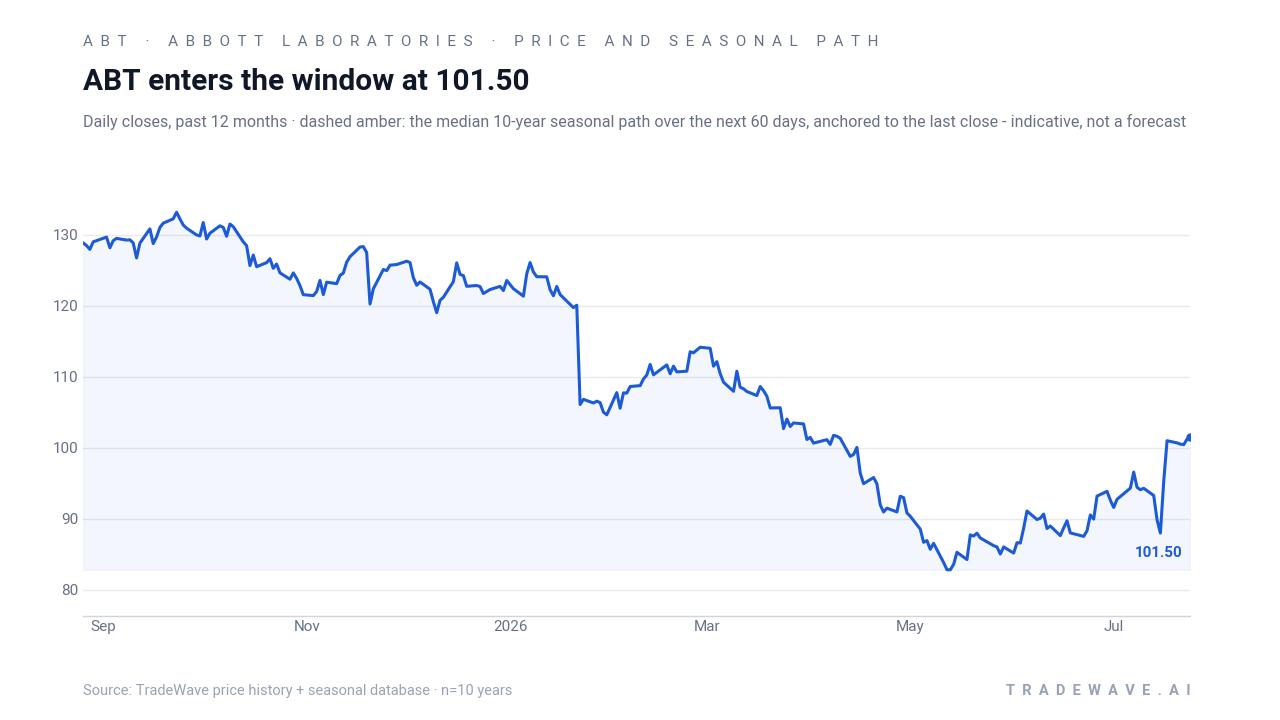
Sector context has been supportive. Medical devices and diagnostics have benefited from robust demand, including continuous glucose monitors and cancer testing, which helped Abbott’s Q2 revenue edge past expectations and gave management confidence to lift guidance.[4] At the same time, the $23 billion Exact Sciences deal is still expected to trim about $0.20 per share from 2026 profit, a drag that earlier in the year forced Abbott to reset its outlook before the latest upgrade in July.[5] The market’s willingness to look through that hit and reward the stronger core business is part of what makes the approaching seasonal window so interesting: the stock is entering it from a position of renewed strength rather than repair.
In the background, macro conditions remain in flux, with investors weighing the path of interest rates, healthcare policy and election-year rhetoric. For a diversified healthcare name like Abbott, that mix has often translated into a defensive-growth role in portfolios, especially in the midterm election year when volatility in more cyclical sectors tends to rise. The historical Aug 26 to May 14 pattern sits squarely in that phase, bridging the late midterm period into the year before the presidential election, when risk appetite has often improved across past cycles.
What should traders watch as Abbott Laboratories (ABT) approaches this window?
First, the calendar: the next iteration of the Aug 26 to May 14 window begins on Aug 26, 2026, and runs deep into the year before the presidential election. Historically, that has been a sweet spot for Abbott, with 10 of 10 midterm-year samples finishing higher and average gains north of 17%. How the stock behaves into that start date, especially after its post-earnings surge, will shape whether this cycle begins from an extended or more consolidated base.
Second, watch the earnings and guidance cadence. The company has just raised its 2026 profit outlook on the back of strong diagnostics and medical devices demand, reversing the more cautious tone from April when the Exact Sciences deal forced a trim.[4][5] If subsequent quarters sustain that narrative of margin resilience and top-line growth, it would rhyme with prior midterm-year windows where fundamental momentum and the seasonal pattern lined up.
Third, monitor policy and reimbursement headlines as the midterm election year progresses into the pre-election year. Shifts in Medicare, hospital budgets or device regulation can quickly change how investors treat large-cap healthcare, and past cycles suggest that clarity on those fronts has often coincided with stronger performance in this specific window. A supportive policy backdrop would fit the historical pattern; a surprise regulatory shock would be one way this cycle could diverge.
Finally, keep an eye on volatility inside the window, not just the end result. Prior midterm-year samples have seen intraperiod drawdowns that reached double digits before finishing higher, as the MAE needles in the seasonal charts make clear. If Abbott repeats that behavior, traders may see sharp pullbacks even in a year that ultimately respects the 10-for-10 record. A smoother path with shallower dips would mark a departure from history, while another choppy but upwardly biased run would reinforce the idea that this long midterm-to-pre-election stretch remains one of the stock’s most distinctive seasonal regimes.
Sources
- Barron's: Abbott Stock Is Leading the S&P 500 After Earnings for Its Best Day in 24 Years (Jul 16, 2026)
- Forbes: Is The Fall In Abbott Stock Justified? (Jan 23, 2026)
- Reuters: Abbott raises 2026 profit forecast on strength in diagnostics, medical devices (Jul 16, 2026)
- Reuters: Abbott trims 2026 profit forecast on Exact deal hit, shares fall (Apr 16, 2026)
- Reuters: Abbott investigates two separate cyber incidents, says no operations affected (Jul 17, 2026)
About this seasonal analysis
Seasonal pattern data is sourced from TradeWave.ai, which analyzes historical price behavior across annual calendar windows going back up to 30 years. Read the full data methodology or the book The 100-Year Pattern by Afshin Moshrefi (2026 edition). Past performance of seasonal patterns does not guarantee future results. This article is for informational purposes only and does not constitute investment advice.