Nasdaq 100 (NDX) Has Rallied in 9 of 9 Midterm Jul 26-Apr 17 Windows, Averaging 19.28% Gains
Nasdaq 100 is trading just below record territory as it approaches a Jul 26 seasonal window that has delivered strong gains in past midterm election years, raising the stakes for tech-heavy index traders.
Price as of Jul 22, 2026: $28,998.10 (last close).

What is the seasonal pattern for Nasdaq 100 (NDX)?
Nasdaq 100 has risen in 9 of 9 midterm election years during the Jul 26 to Apr 17 window, with an average gain of 19.28% in winning years.
- 9 for 9 in this window, with Nasdaq 100 averaging 19.28% gains across winning years from Jul 26 to Apr 17.
- Percent Profitable is 100%, with 9 winners and 0 losers across the last 9 midterm election years in this pattern.
- Average profit of 19.28% reflects a long trade direction, with no losing years in the sample.
- The TradeWave Ratio of 1.44 suggests price typically travels meaningfully in the trade direction within the window, beyond just the final close.
- A Sharpe ratio of 1.55 points to a historically strong risk-adjusted profile for this specific Nasdaq 100 trading window.
- Individual years have still seen sizable drawdowns inside the window, with some episodes showing double-digit adverse moves before finishing higher.
According to historical data from TradeWave.ai, this midterm-year stretch behaves very differently from an average calendar year for the Nasdaq 100, and the next iteration is only days away.
How has Nasdaq 100 (NDX) traded in this midterm-year seasonal window?
Nasdaq 100 has closed higher in every single one of the last 9 midterm election years during the Jul 26 to Apr 17 window, averaging a 19.28% gain. The index finished the prior session at 28,998.10, down 0.5% on the day and about 5.7% below its 52-week high of 30,762.20. With the next 266-day window set to open on Jul 26, traders are staring at a historical pattern that has quietly delivered outsized returns while still packing meaningful drawdowns along the way.
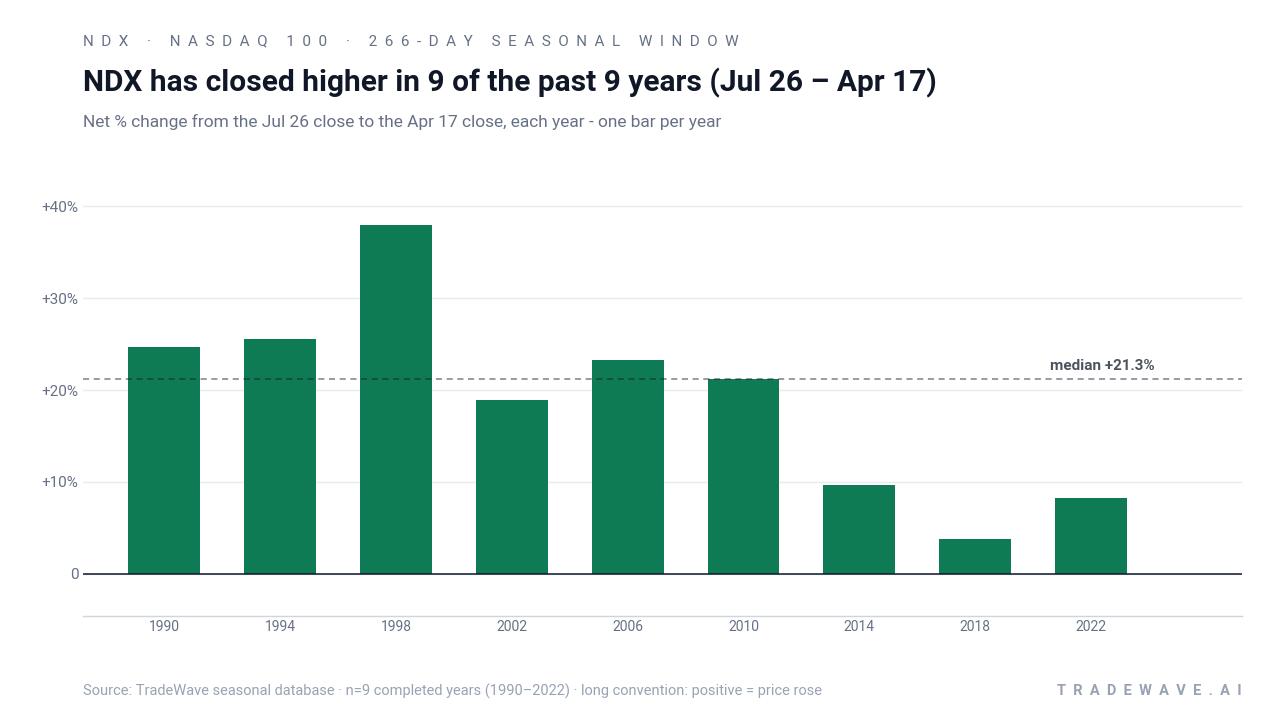
Grouping the data by the presidential election cycle matters here because this window straddles the back half of the midterm election year and runs deep into the year before the presidential election, a phase that has often coincided with friendlier policy tone and improving risk appetite for growth stocks. For a tech-heavy benchmark like the Nasdaq 100, that combination of political calendar and liquidity backdrop has historically lined up with powerful rallies once the midterm-year volatility phase gives way to the pre-election ramp.
Formally, this seasonal window begins on Jul 26 and spans 266 days, with a long trade direction. Across the last 9 midterm election years that match this phase, Nasdaq 100 has posted a 100% win rate, with 9 winners and 0 losers. Average profit across those years is 19.28%, with a median outcome of 21.26%, and the cumulative return from stacking the window year after year reaches 373%. That combination of consistency and magnitude is unusual for a major index, especially one as volatile and tech-concentrated as NDX.
The per-year breakdown shows how those gains have arrived. The strongest year in the sample was 1998, when the index returned 37.94% between the Jul 26 entry and the Apr 17 exit, helped by a maximum favorable move of 57.83% at the peak of the dot-com surge. The softest outcome was 2018, which still finished up 3.78% over the window but saw a maximum adverse move of 20.34% as the index absorbed a sharp Q4 correction before recovering into the following spring. Even in 2022, a difficult year for growth stocks, the window delivered an 8.28% gain with a 13.52% best run-up and a 13.62% worst drawdown.
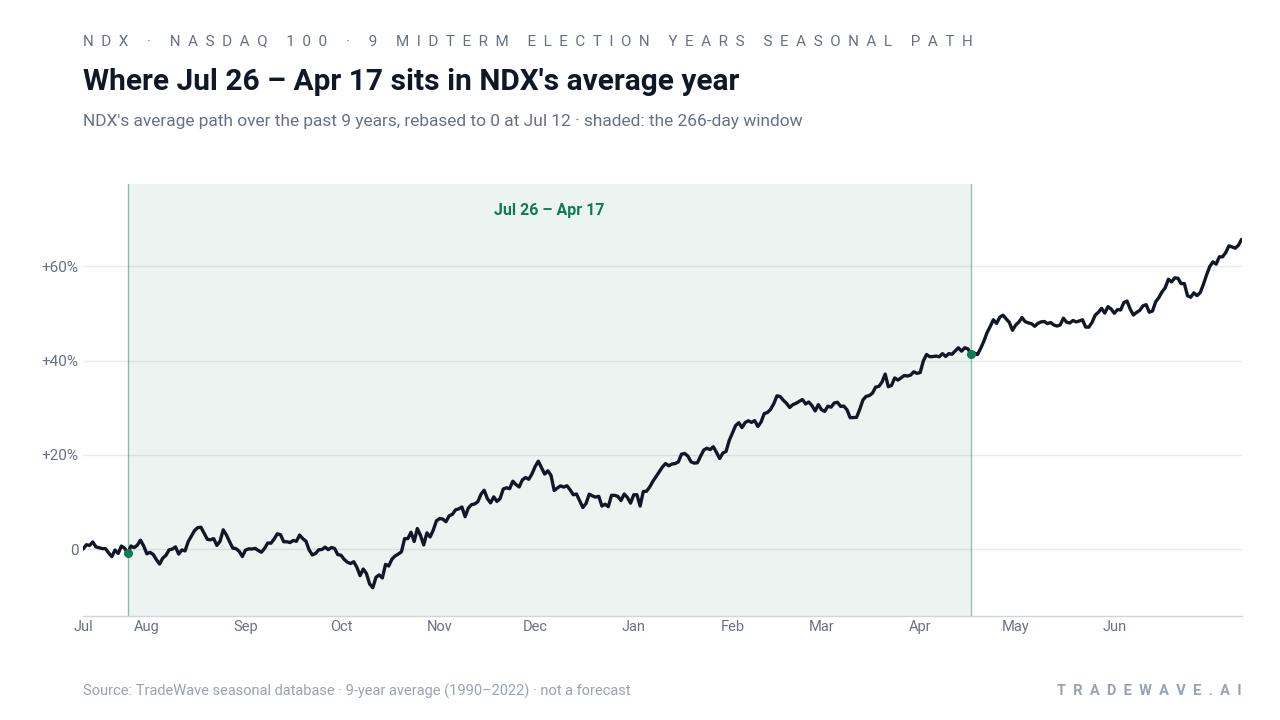
Year-by-year ranges highlight how far NDX has swung inside the window before settling at those positive closes.
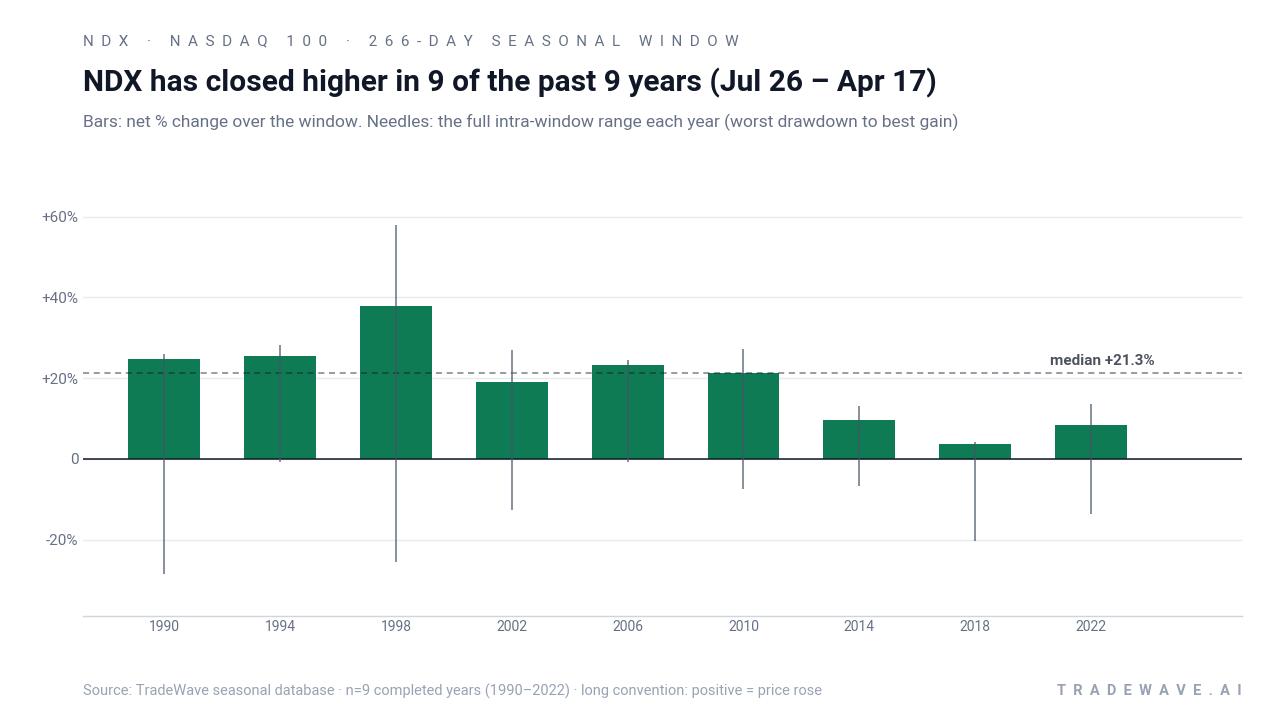
The stacked net / maximum favorable move / maximum adverse move profile underlines that this is not a gentle ride. In several years, including 1990 and 1998, the best intraperiod rallies exceeded 25% while the worst drawdowns also pushed into double digits, reflecting a high-variance environment where both bulls and bears saw big swings before the window closed higher. In calmer years such as 1994 and 2006, the worst drawdowns stayed under 1%, and the index simply trended up through the period.
Put together, the pattern is clear: nine for nine, with a long bias that has historically rewarded patience through volatility. History does not guarantee a repeat, but the consistency of positive closes and the size of the average gain make this one of the more striking NDX seasonal trends tied to the election cycle.
Why does Nasdaq 100 (NDX) follow this seasonal pattern?
One likely driver is the way the earnings calendar and policy backdrop line up between late summer of the midterm election year and the following spring, when tech and communication giants often report back-to-back quarters that reset expectations. Analysts have also pointed to institutional portfolio repositioning after midterm volatility, as managers rotate back into growth and high-beta names ahead of the historically stronger year before the presidential election. This pattern may also reflect a friendlier liquidity and regulatory tone as Washington shifts from midterm campaigning to pre-election stimulus and messaging, which has often supported risk-on behavior in the Nasdaq 100.
History does not guarantee future results; adverse excursions within this window have at times been large even in years that ultimately finished higher.
What is driving Nasdaq 100 (NDX) today?
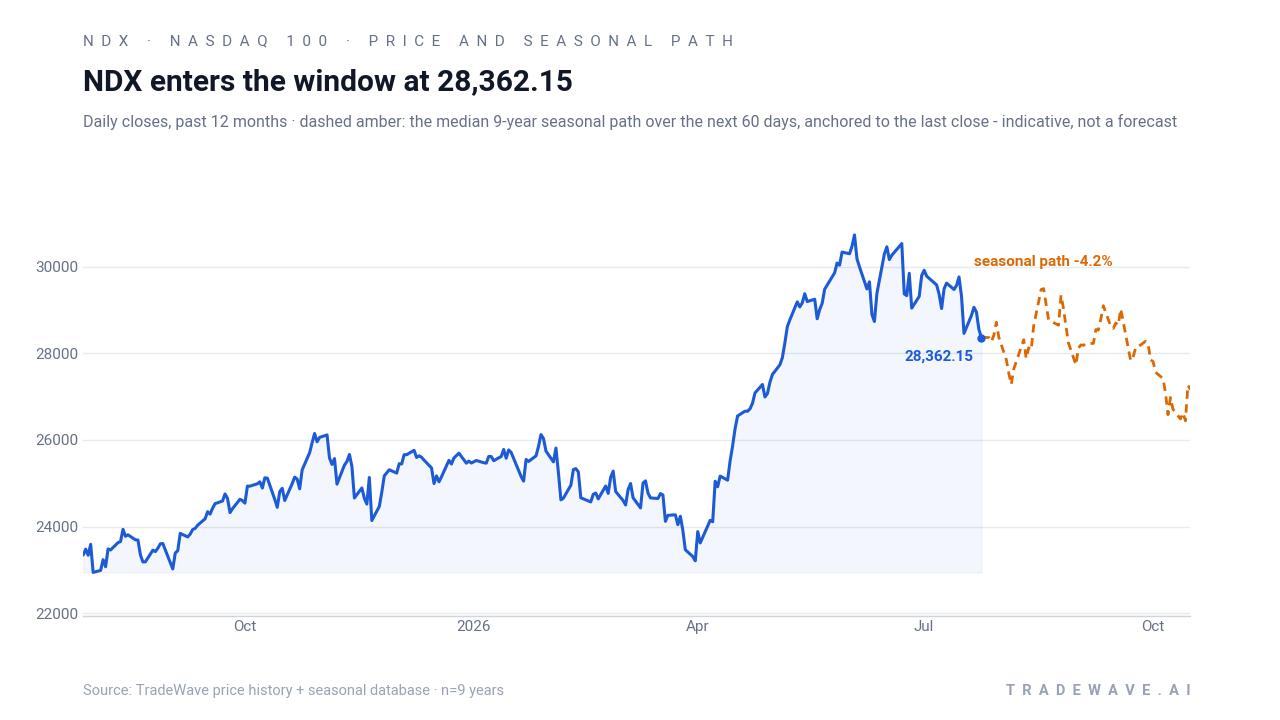
Nasdaq 100 ended the prior session at 28,998.10, down 157 points or 0.5%, leaving the index about 5.7% below its 52-week high of 30,762.20 and still well above its 52-week low of 22,673.88. The benchmark remains above its 50-day moving average of 29,555.92 and has slipped 1.19% over the past month, a modest pullback after a strong run that pushed it into record territory earlier this year.
Under the surface, some technicians are flagging a potential diamond top pattern on the Nasdaq-100 and its QQQ ETF, a formation that can precede trend reversals if confirmed by a breakdown in price and breadth.[1] At the same time, macro commentary has focused on weakening semiconductor leadership and concerns that narrow gains in a handful of mega-cap names may be masking softer market breadth, a dynamic that matters for an index as concentrated in tech and hyperscalers as NDX.[1] Those cross-currents leave traders weighing whether the latest consolidation is a pause before another leg higher or the start of a more meaningful rotation away from high-growth names.
The chart below situates the latest pullback against the past year of trading and the median seasonal path over the next two months.
What should traders watch as this seasonal window opens?
As the Jul 26 window approaches, the first watchpoint is whether NDX can hold above its 50-day moving average and avoid a decisive breakdown from the suspected diamond top pattern.[1] A clean hold and turn higher would be more in line with the historical midterm-to-pre-election seasonal trend, while a sharp break lower with expanding breadth weakness would mark a clear departure from the past nine cycles. Second, the behavior of semiconductor and hyperscaler leaders will be critical: if chip stocks continue to lag while the broader index grinds higher, it would suggest a rotation within tech rather than a wholesale unwind of the growth trade.
Third, traders should track how volatility behaves inside the window relative to prior years. Historically, some of the best outcomes in this pattern have come with sizable intraperiod drawdowns, so a bout of turbulence early in the window would not automatically contradict the seasonal script. What would challenge it is a sustained move that leaves NDX below key support into year-end, rather than the recoveries that have characterized past midterm-year episodes. Finally, as the calendar shifts from the midterm election year toward the year before the presidential election, policy headlines around fiscal support, regulation of big tech, and central bank signaling will shape whether this cycle can extend the nine-for-nine record or break it.
Sources
- Barchart.com, “The Nasdaq-100 Could Be Forming a Textbook Diamond Top. Here's What to Watch on the QQQ Chart Now.” Jul 7, 2026.
About this seasonal analysis
Seasonal pattern data is sourced from TradeWave.ai, which analyzes historical price behavior across annual calendar windows going back up to 30 years. Read the full data methodology or the book The 100-Year Pattern by Afshin Moshrefi (2026 edition). Past performance of seasonal patterns does not guarantee future results. This article is for informational purposes only and does not constitute investment advice.