HP Inc. (HPQ) Has Risen in 8 of 10 Midterm Aug-Feb Windows, Averaging 21% Gains
HP Inc. is trading around $25 as it heads toward an Aug 12 seasonal window that has often favored the bulls, giving traders a long tech hardware stretch to watch into late winter.
Price as of Jul 22, 2026: $25.10 (last close).
What is the seasonal pattern for HP Inc. (HPQ)?
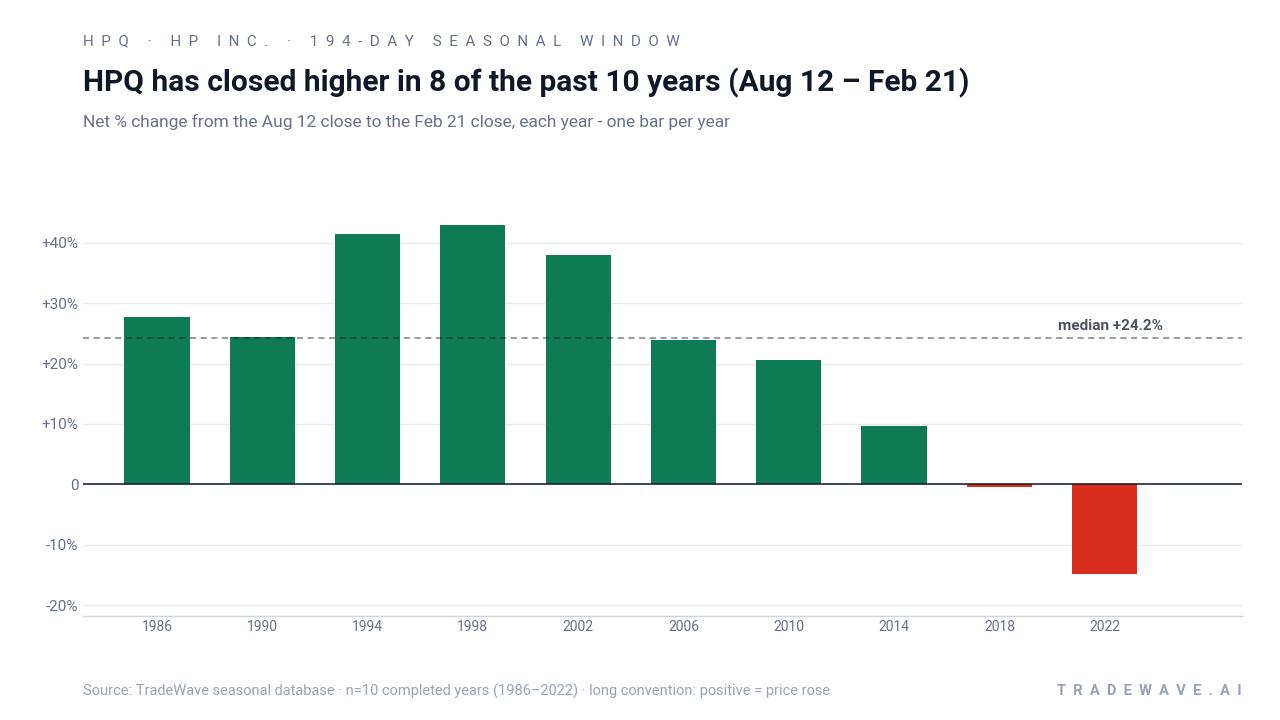
HP Inc. has risen in 8 of 10 years during this Aug 12 to Feb 21 midterm-year window, with an average gain of 28.55% in winning years.
- 8 for 10 in this window, with winning years averaging 28.55% gains and a 21% average when all years are included.
- Seasonal window runs roughly 194 days from Aug 12 to Feb 21, covering late summer, the holiday quarter, and early-year tech spending.
- Percent Profitable sits at 80%, with 8 winners and 2 losers across the last 10 midterm election years.
- Average loss in down years is -7.62%, showing that misses have been smaller than the typical upside in winning years.
- The TradeWave Ratio of 1.54 points to meaningful intraperiod travel in the trade direction during this HPQ seasonal trend.
- A Sharpe ratio of 1.03 for this HP Inc. trading window signals a historically favorable risk-adjusted profile, albeit with notable drawdowns in some years.
According to historical data from TradeWave.ai, this upcoming stretch has behaved differently from a typical calendar period for HPQ. The next section looks at how that election-cycle pattern has played out in prior midterm years.
How has HP Inc. (HPQ) traded in the Aug–Feb midterm-year window?
HP Inc. has closed higher in 8 of the last 10 midterm election years during the Aug 12 to Feb 21 window, with a long-side setup that has historically rewarded patience. Shares finished the latest session at $25.10, up 1.2% on the day, leaving the stock between its 52-week extremes after a solid one-month gain of 6.04%.
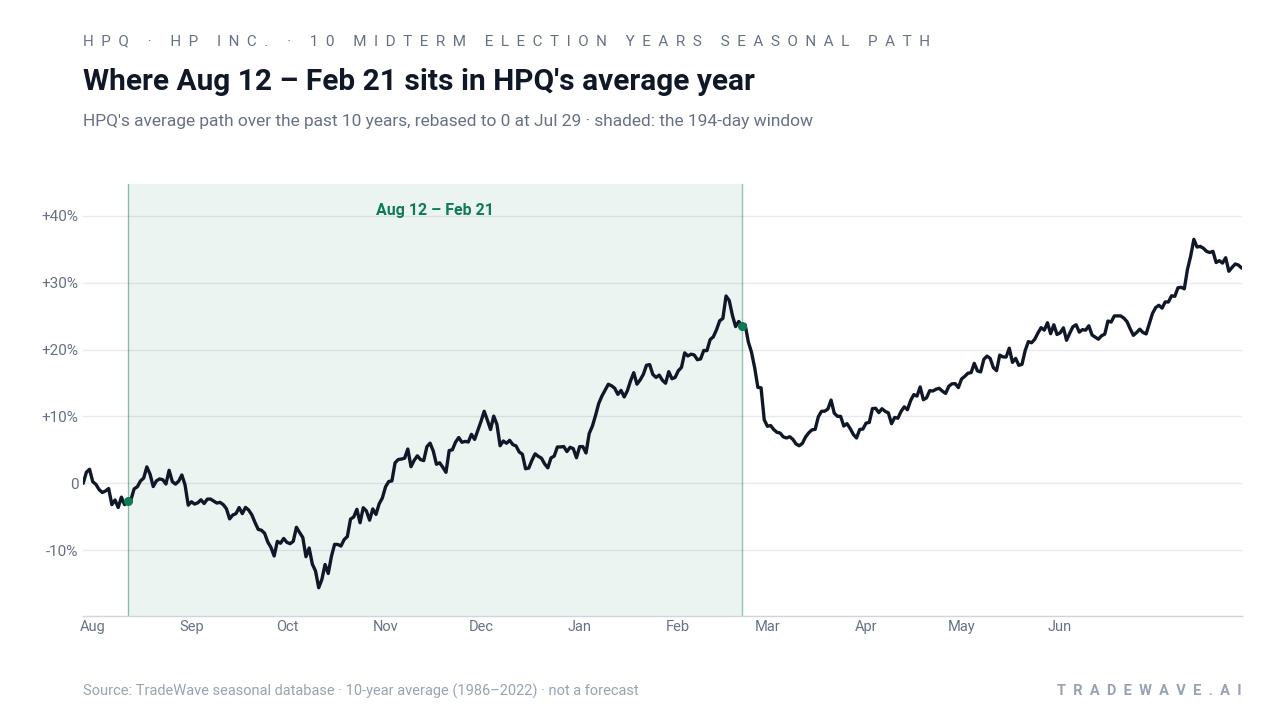
Because this pattern is grouped by the presidential election cycle, it reflects how HPQ has behaved specifically in the year before the presidential election, across the last 10 midterm election years. That matters for a tech hardware name like HP Inc. because corporate PC refresh budgets, public-sector IT spending, and broader risk appetite often respond to policy expectations and fiscal positioning in this phase of the cycle.
This seasonal window begins on Aug 12 and spans 194 days, and historically it has been a strong stretch for HP Inc. on the long side. Across the last 10 midterm election years, the long trade direction has produced an 80% win rate, with 8 winners and 2 losers. Winning years have averaged 28.55% gains from entry to exit, while including the two down years pulls the all-years average to 21%, still a sizable move for a single multi-month window.
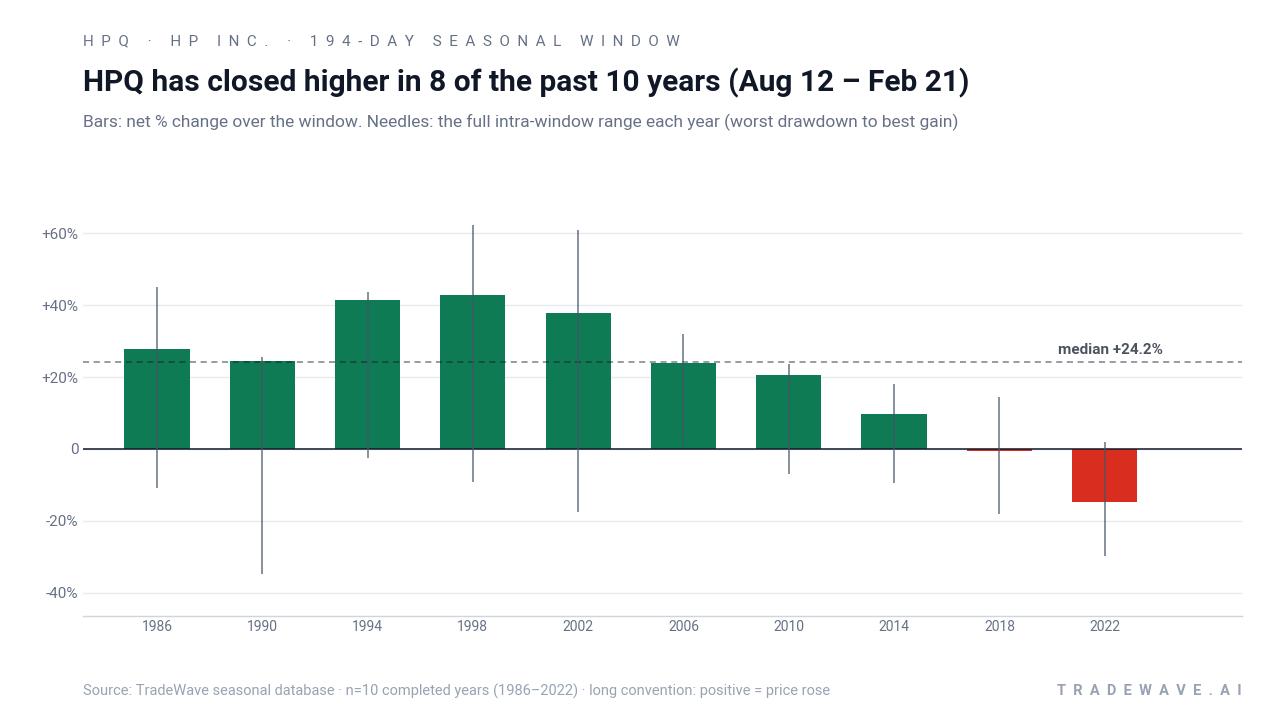
The per-year breakdown shows how that HPQ seasonal trend has played out. In 1998, the stock gained 42.86% over the window, with a maximum favorable move of 62.20% before giving back some ground by the close. In 1994, HPQ rallied 41.37% with only a -2.62% worst drawdown from entry, a clean example of the pattern working with limited pain. On the other side of the ledger, 2022 delivered a -14.79% loss for the long setup, with the stock suffering a -29.89% worst intraperiod drawdown and barely any upside, while 2018 was essentially flat at -0.46% despite a 14.43% peak run-up.
The intraperiod behavior matters as much as the final score. Maximum favorable excursion and maximum adverse excursion, the best and worst moves from the entry point within the window, show that HPQ has often traveled far in both directions before settling. Years like 1990 saw a 24.33% final gain but endured a -34.77% worst drawdown along the way, while 2002 combined a 37.92% net gain with a -17.47% adverse move at the low. That mix of strong upside and meaningful downside is what the 1.54 TradeWave Ratio is capturing for this HP Inc. trading window.
Yearly net and intraperiod ranges show how upside and downside have coexisted inside this long seasonal window.
Viewed together, the cumulative return profile is striking. Compounding this 194-day window across the 10 midterm election years in the sample produces a 514% cumulative gain, with an annualized return of 19.92% for the pattern. The Sharpe ratio of 1.03 indicates that, on a risk-adjusted basis, this HPQ seasonal window has historically delivered more reward than noise, even after accounting for the two losing years and the occasional deep drawdown.
History does not guarantee future results; adverse excursions can be large even in winning windows, and HPQ has seen double-digit drawdowns inside this pattern before recovering.
Why does HP Inc. (HPQ) follow this seasonal pattern?
One likely driver is the clustering of HP Inc.’s fiscal calendar and enterprise spending cycles around the back-to-school and holiday quarters, which fall squarely inside this Aug to Feb stretch. Analysts often point to corporate PC refreshes, public-sector IT budgets, and year-end procurement as key supports for hardware names in the year before a presidential election, when policy visibility tends to improve and CIOs are more willing to commit capital. This pattern may also reflect portfolio managers rotating into value and cash-generative tech ahead of the pre-election year, using HPQ as a way to balance growth exposure with steadier cash flows.
What is driving HP Inc. (HPQ) today?
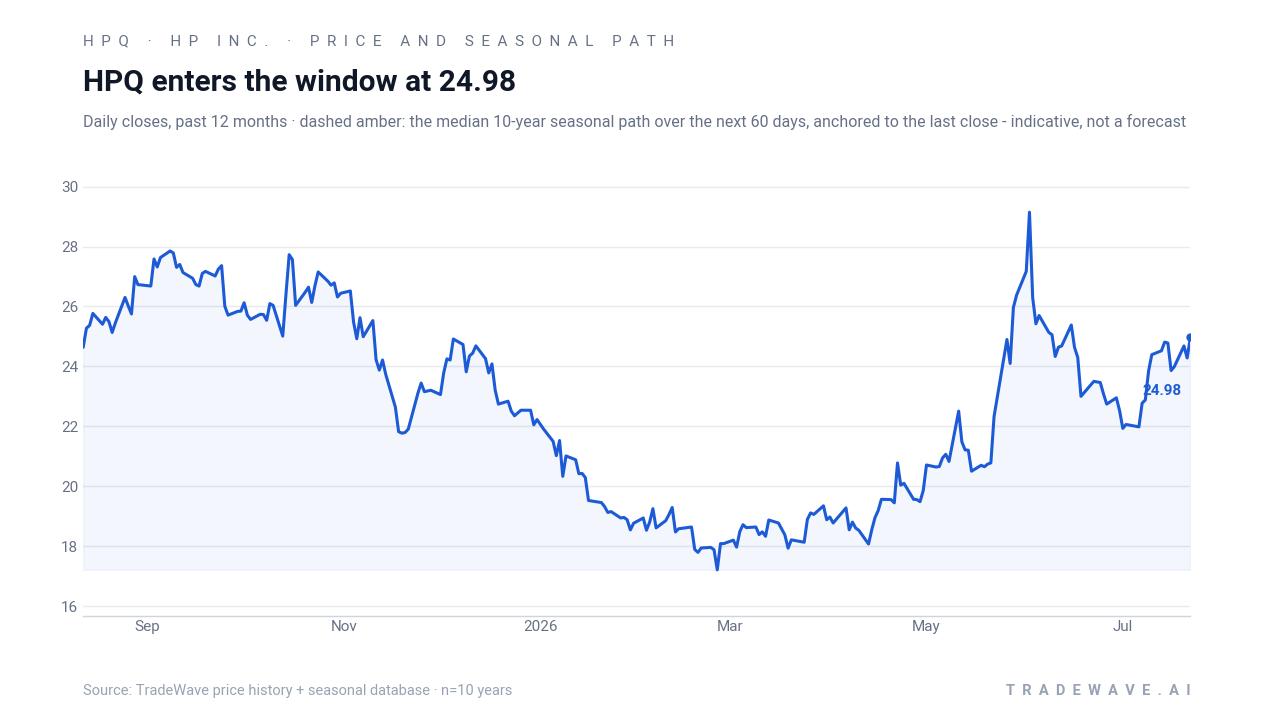
HPQ closed at $25.10, up 1.2% on the day, after trading between $24.98 and $25.54 on volume just over 10.0 million shares. The stock has climbed 6.04% over the past month and is trading above its 50-day moving average of about $23.59, with 20-day average volume near 14.6 million shares, suggesting a constructive tone as the market digests its latest earnings-driven jump.
On May 27, 2026, HP shares surged by double digits after the company reported earnings and revenue that beat expectations, a reminder that fundamental surprises can quickly reset the baseline heading into a seasonal window.[1] With no fresh analyst consensus targets or ratings updates in the data, positioning around HPQ is being set more by that earnings reset and the broader tech hardware backdrop than by Wall Street calls. For traders watching the upcoming Aug 12 seasonal window, the key question is whether the post-earnings strength can carry into a historically favorable stretch that has often rewarded long exposure in prior midterm election years.
The chart below situates the latest move against HPQ’s past year of trading and a historical seasonal projection for the next 60 days.
What should traders watch as the Aug 12 window approaches?
First, watch how HPQ behaves as Aug 12 approaches relative to its 50-day moving average and recent one-month uptrend. A firm hold above that moving average into the start of the window would align with the historical pattern of strength, while a break back below it would signal that this cycle may not track the prior midterm-year script.
Second, keep an eye on upcoming corporate PC and printer demand commentary from peers and channel partners, since this 194-day window spans the back-to-school season, the holiday quarter, and early-year budget flush. Any signs that enterprise or consumer hardware spending is stalling would raise the bar for HPQ to repeat its historical seasonal gains.
Third, monitor trading volume and intraday ranges once the window opens. Past years have shown that even winning cycles can include sharp drawdowns, with worst intraperiod moves reaching double digits before the stock recovered. If volatility spikes without corresponding follow-through in price, it would suggest that the current midterm-year environment is more fragile than the long-run averages imply.
Finally, tie all of this back to the broader election-cycle backdrop. As markets move deeper into the year before the presidential election, investors often shift toward names with clearer cash flows and established franchises. If HPQ continues to attract that capital while holding its post-earnings gains, it would be a sign that the historical Aug–Feb seasonal window is once again lining up with the policy and spending calendar that has supported it in prior midterm election years.[1]
Sources
About this seasonal analysis
Seasonal pattern data is sourced from TradeWave.ai, which analyzes historical price behavior across annual calendar windows going back up to 30 years. Read the full data methodology or the book The 100-Year Pattern by Afshin Moshrefi (2026 edition). Past performance of seasonal patterns does not guarantee future results. This article is for informational purposes only and does not constitute investment advice.