8-for-8 Midterm Streak: Pinnacle West Capital (PNW) Enters 122-Day Window Averaging 10.52% Gains
Pinnacle West Capital is stepping into a historically strong 122-day midterm-year seasonal window just as the stock trades near the upper end of its recent range, raising the stakes for utility investors watching the next few months.
Price as of Jul 22, 2026: $106.30 (last close).

What is the seasonal pattern for Pinnacle West Capital (PNW)?
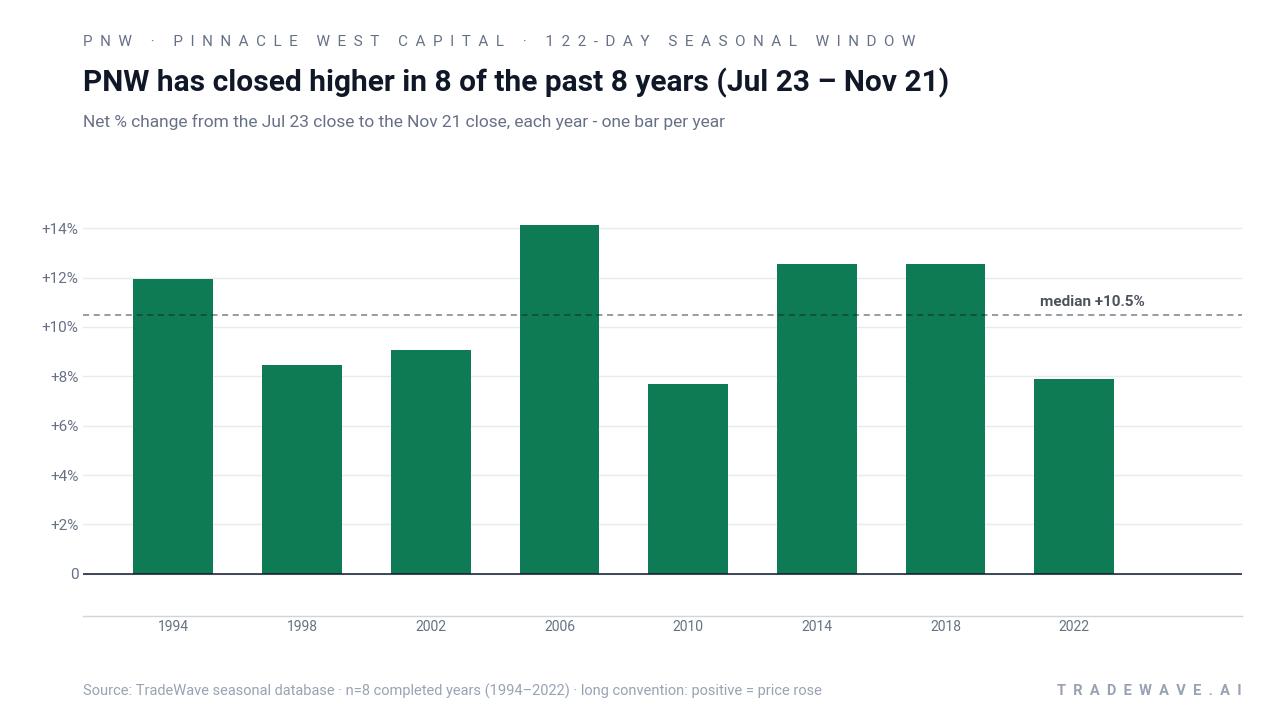
Pinnacle West Capital has risen in 8 of 8 midterm-year Jul 23 to Nov 21 windows, with an average gain of 10.52% in winning years.
- 8 for 8 in this window, with Pinnacle West Capital gaining an average 10.52% across winning years from Jul 23 to Nov 21.
- Seasonal bias is bullish over this 122-day stretch, with 100% Percent Profitable, 8 winners and 0 losers in the sample.
- Average winner gains of roughly 10% to 14% per year stack to a 122% cumulative return when the window is repeated across the last eight midterm election years.
- The TradeWave Ratio (TWR) of 2.65 signals that price has typically traveled meaningfully in the long direction within the window, not just at the close.
- A Sharpe ratio of 3.66 for this pattern points to unusually strong risk-adjusted returns compared with typical single-stock seasonal windows.
- Intraperiod swings have still been real, with some years showing double-digit drawdowns before finishing higher, so timing and risk controls matter.
According to historical data from TradeWave.ai, this midterm-year stretch for Pinnacle West Capital has behaved very differently from an average quarter, with a clear directional tilt that many investors may not have on their radar.
How has Pinnacle West Capital (PNW) traded in this midterm-year window?
Pinnacle West Capital has finished higher in every single Jul 23 to Nov 21 window across the last eight midterm election years, averaging 10.52% gains for long positions. Shares enter this year’s iteration at 106.3 after a 0.6% move higher on Thursday, sitting closer to the top of their recent 12‑month range than the bottom.
Grouping the data by the presidential election cycle matters here because utilities often trade as policy and rate proxies, and midterm years tend to coincide with shifting regulatory rhetoric and positioning ahead of the following year’s campaign season. In this case the pattern phase is the midterm election year, and the calendar is also in a midterm year, so the historical sample lines up cleanly with today’s backdrop.
Across the eight midterm-year samples from 1994 through 2022, every Jul 23 to Nov 21 window delivered a positive close for a long trade. The strongest year in the set was 2006, when PNW gained 14.11% over the window, while the softest was 2010 with a still‑solid 7.68% rise. Add it up and repeating this 122‑day slice across those eight cycles would have compounded to a 122% cumulative gain.
The intraperiod path has not been a straight line. In 2002, for example, the stock’s best point‑to‑peak move within the window reached 27.73%, but it also suffered a worst drawdown of 21.66% from the entry before finishing up 9.07%. Other years such as 2006 saw much shallower downside, with a maximum adverse move of just 0.16% against a 15.19% best gain, underscoring how the same bullish seasonal tendency can arrive with very different volatility profiles.
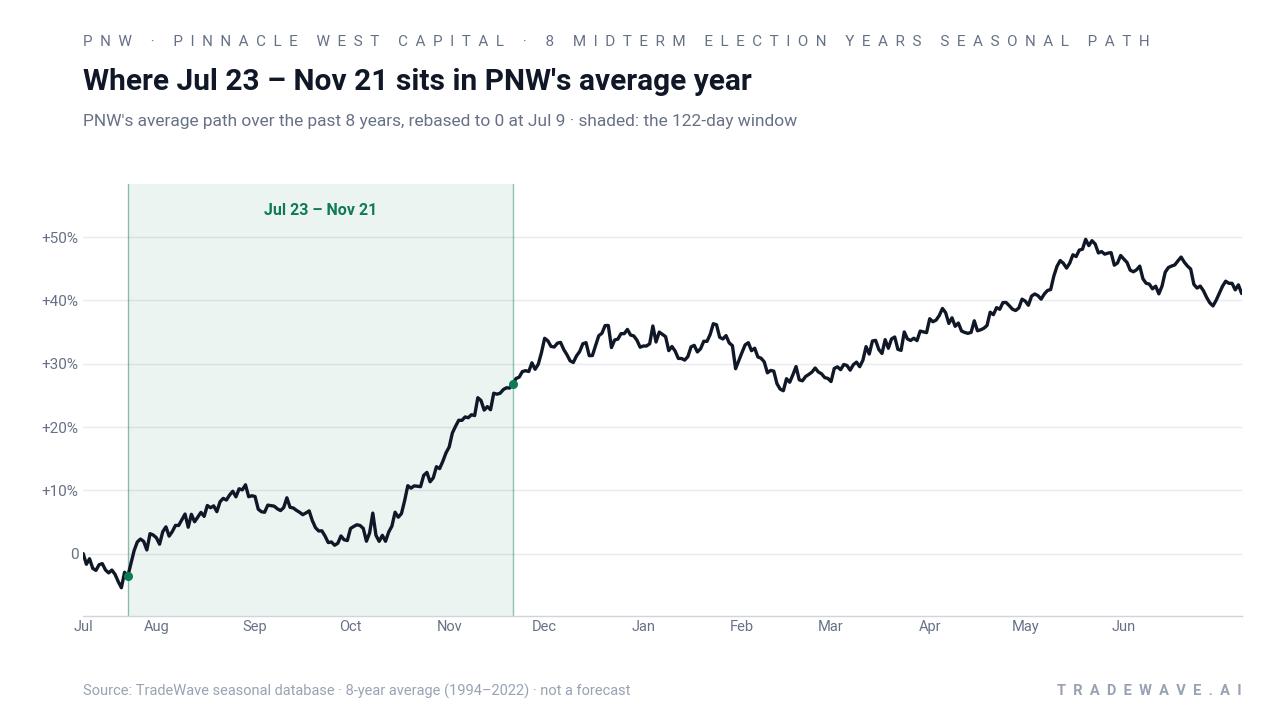
A second view that layers in both best gains and worst drawdowns helps clarify how far PNW has swung inside this window before settling at its final result.
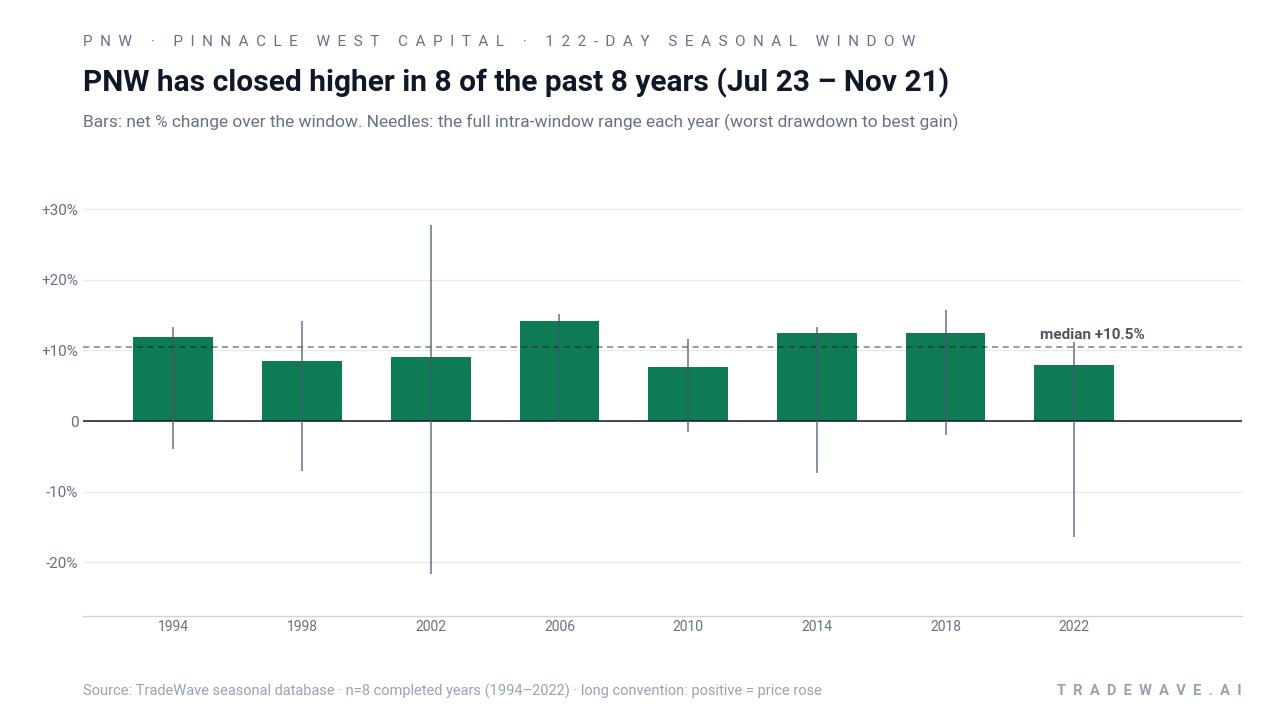
The bar‑and‑range profile shows that maximum favorable moves have often stretched into the low‑ to mid‑teens, while maximum adverse moves have ranged from barely negative to more than 20% in the toughest year. That combination aligns with the high TradeWave Ratio and Sharpe ratio: historically this has been a productive long window, but one where traders have had to sit through real volatility to capture the seasonal edge.
History does not guarantee future results; adverse excursions can be large even in winning windows, and past seasonal strength does not ensure similar outcomes in 2026.
Why does Pinnacle West Capital (PNW) follow this seasonal pattern?
One likely driver is the way utility earnings, regulatory decisions and rate expectations cluster in the back half of midterm election years, when policy debate heats up but concrete legislation is still limited. Analysts have also pointed to institutional portfolio repositioning into defensive, dividend‑paying sectors ahead of the typically stronger pre‑election year, which can favor names like Pinnacle West Capital. The pattern may also reflect seasonal electricity demand and fuel cost dynamics that tend to firm utility cash flows heading into winter.
What is driving Pinnacle West Capital (PNW) today?
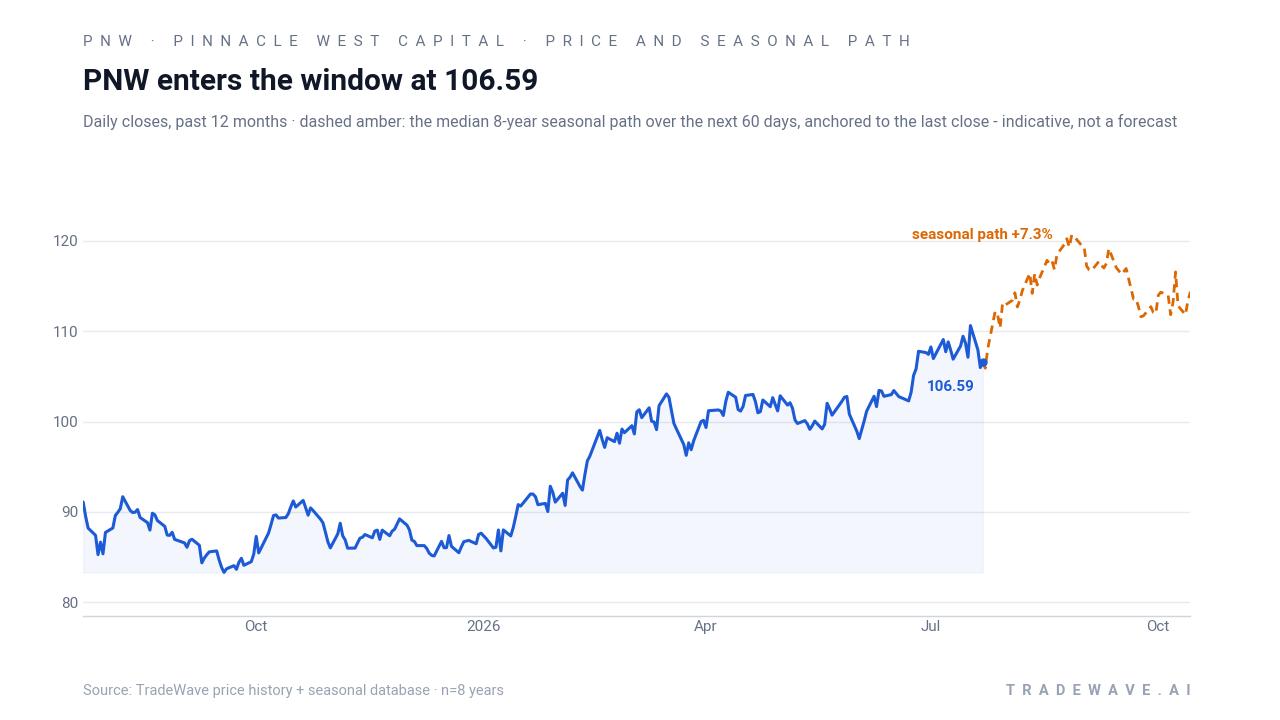
Pinnacle West Capital closed Thursday at 106.3, up 0.6% on the day, extending a roughly 2.16% gain over the past month as the stock grinds higher above its 50‑day moving average near 103.82. That leaves shares about 4.4% below their 52‑week high of 111.16 and well above the 52‑week low near 80.52, a setup that gives the upcoming seasonal window room to work in either direction.
The chart below shows how that recent climb lines up with the stock’s 12‑month path and the median seasonal projection for the next two months.
Volume has been healthy, with roughly 1.5 million shares changing hands on Thursday against a 20‑day average near 1.18 million, suggesting active positioning as the calendar flips into this historically important stretch. With no near‑term earnings date or major company‑specific catalyst on the calendar, the next few months for PNW may be shaped more by sector flows, rate expectations and the broader midterm‑to‑pre‑election policy narrative than by single headlines.
What should traders watch in this PNW seasonal window?
First, the 52‑week high around 111.16 is a natural reference point. In prior midterm-year windows, PNW has often pushed to new highs or at least challenged prior resistance as the seasonal pattern played out, so how the stock behaves as it approaches that zone will be an early tell on whether 2026 is tracking the historical script.
Second, intraperiod drawdowns have been meaningful in several years, with worst moves against the trade reaching into double digits even when the final result was positive. Traders watching this PNW seasonal trend will want to monitor how any pullbacks develop relative to the 50‑day moving average and recent swing lows, since deeper dips have historically occurred early in the window before later recoveries.
Third, the policy calendar matters. As the midterm election year progresses toward the pre‑election year, any shifts in rate expectations, utility regulation or state‑level energy policy could either reinforce or blunt the usual defensive bid that has supported PNW in past cycles. A pattern of steady inflows into utility and dividend‑focused funds during this 122‑day stretch would be consistent with the historical seasonality, while persistent outflows or sharp rate spikes would argue for a more cautious read.
Finally, behavior relative to the median seasonal path over the next 60 to 90 days will be important. If PNW tracks or modestly lags that historical curve while holding above key support, the eight‑for‑eight record remains intact as a useful backdrop. A sharp break below the typical path, especially if accompanied by unusually heavy volume or sector‑wide weakness, would signal that 2026’s midterm-year window is diverging from the past and that traders should treat the historical pattern as context rather than a roadmap.
Sources
About this seasonal analysis
Seasonal pattern data is sourced from TradeWave.ai, which analyzes historical price behavior across annual calendar windows going back up to 30 years. Read the full data methodology or the book The 100-Year Pattern by Afshin Moshrefi (2026 edition). Past performance of seasonal patterns does not guarantee future results. This article is for informational purposes only and does not constitute investment advice.