Nasdaq 100 (NDX) Pullback Meets Rare Technical Buy Signal and a Powerful Midterm-Year Tailwind
Nasdaq 100 is pulling back from record territory just as it approaches a 266-day midterm-year seasonal window that has never been negative in the last nine cycles.
Price as of Jul 16, 2026: $29,025.77 (last close).

What is the seasonal pattern for Nasdaq 100 (NDX)?
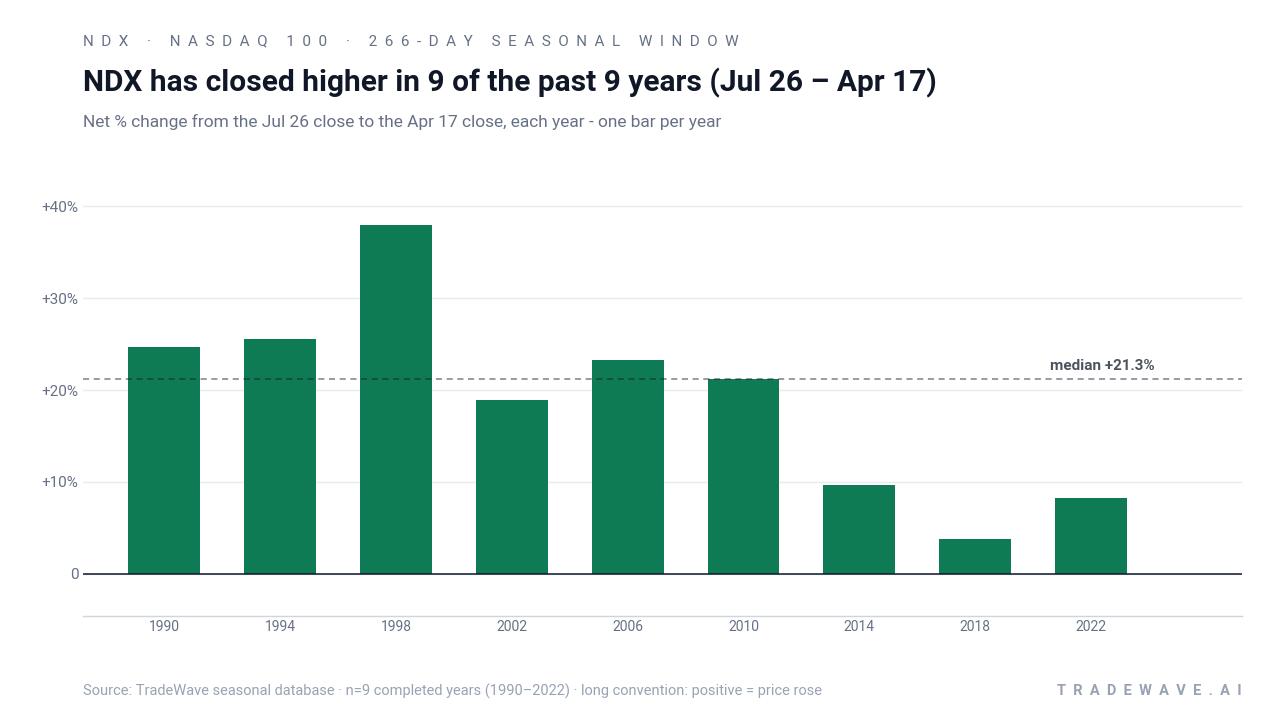
Nasdaq 100 has risen in 9 of 9 midterm-election-year windows starting around Jul 26, with an average gain of 19.28% in winning years.
- 9 for 9 in this window, with Nasdaq 100 averaging 19.28% gains across all winning years.
- The upcoming pattern starts Jul 26 and runs 266 trading days, spanning late midterm year into the year before the presidential election.
- Percent Profitable is 100%, with 9 winners and 0 losers across the last nine midterm-election-year cycles.
- Average winner gains of 19.28% stack into a 373% cumulative return across the sample, with an annualized return of 18.86%.
- The TradeWave Ratio of 1.44 signals that price has typically traveled meaningfully in the long direction within the window, even before final outcomes.
- Intraperiod swings have been sizable in some years, with adverse moves exceeding 20% in weaker paths despite the clean win record.
According to historical data from TradeWave.ai, this is one of the most distinctive midterm-year regimes on the Nasdaq 100 calendar, and the next iteration is only days away.
How has Nasdaq 100 (NDX) behaved in this midterm-year window?
Nasdaq 100 has posted gains in all nine midterm-election-year windows that begin around Jul 26 and run for 266 trading days, averaging 19.28% advances with a long bias. The index finished the prior session at 29,025.77, down 1.6% on the day and about 5.6% below its 52-week high of 30,762.20. That combination of a modest pullback from records and a historically powerful midterm-to-pre-election stretch is why this specific Nasdaq 100 trading window is on the radar for systematic and discretionary traders alike.
Grouping the data by the presidential election cycle matters here because this window straddles the back half of the midterm election year and the run-up into the year before the presidential election, a phase that has often coincided with friendlier policy tone and improving risk appetite in prior cycles. In other words, this is not just a generic “late summer to early summer” pattern; it is tied to how markets have historically traded as Washington moves from midterm uncertainty toward the next presidential race.
Across the last nine midterm-election-year samples, the trade direction for this Nasdaq 100 seasonal pattern is long, and every instance has finished positive. Average profit of 19.28% sits close to the median outcome of 21.26%, which suggests the distribution of returns has been relatively balanced rather than dominated by a single outlier year. Add it up and the cumulative return across all nine windows is 373%, with an annualized return of 18.86% for this specific slice of the calendar.
The per-year table shows how that plays out in individual cycles. The strongest year in the sample was 1998, when the index gained 37.94% between entry and exit, helped by a maximum favorable move of 57.83% at the best point in the window. On the softer side, 2018 still finished up 3.78% but saw a maximum adverse move of 20.34% from entry, underscoring that even “winning” midterm-year windows can feel rough in real time.
Intraperiod swings are where the MFE/MAE profile becomes important. MFE, or maximum favorable excursion, captures the best point-to-peak move from the entry during the window, while MAE, or maximum adverse excursion, tracks the worst drawdown from that same entry. In 1990, for example, the index ultimately gained 24.73%, but the worst drawdown inside the window was a 28.46% slide before the trend reasserted higher. Several other years, such as 1998 and 2022, also combined double-digit positive outcomes with double-digit adverse moves along the way.
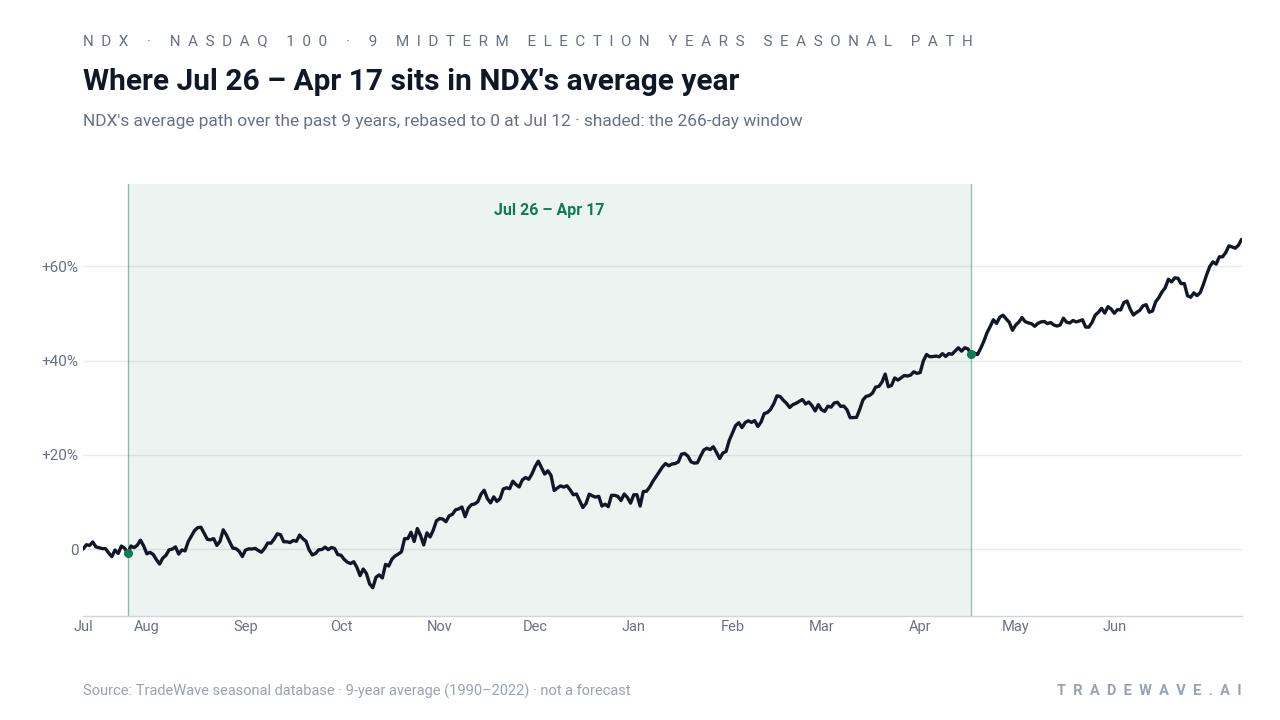
The historical seasonal trend chart for this window shows a fairly steady upward slope rather than a single explosive burst. Gains tend to build across the full 266 trading days, with some choppier behavior early on and a more consistent climb as the calendar moves deeper into the year before the presidential election. That fits the broader pattern many investors know anecdotally: midterm-year volatility often gives way to a more durable risk-on phase as policy uncertainty clears.
A second view of yearly net, best-case, and worst-case moves highlights how upside and drawdowns have coexisted in this pattern.
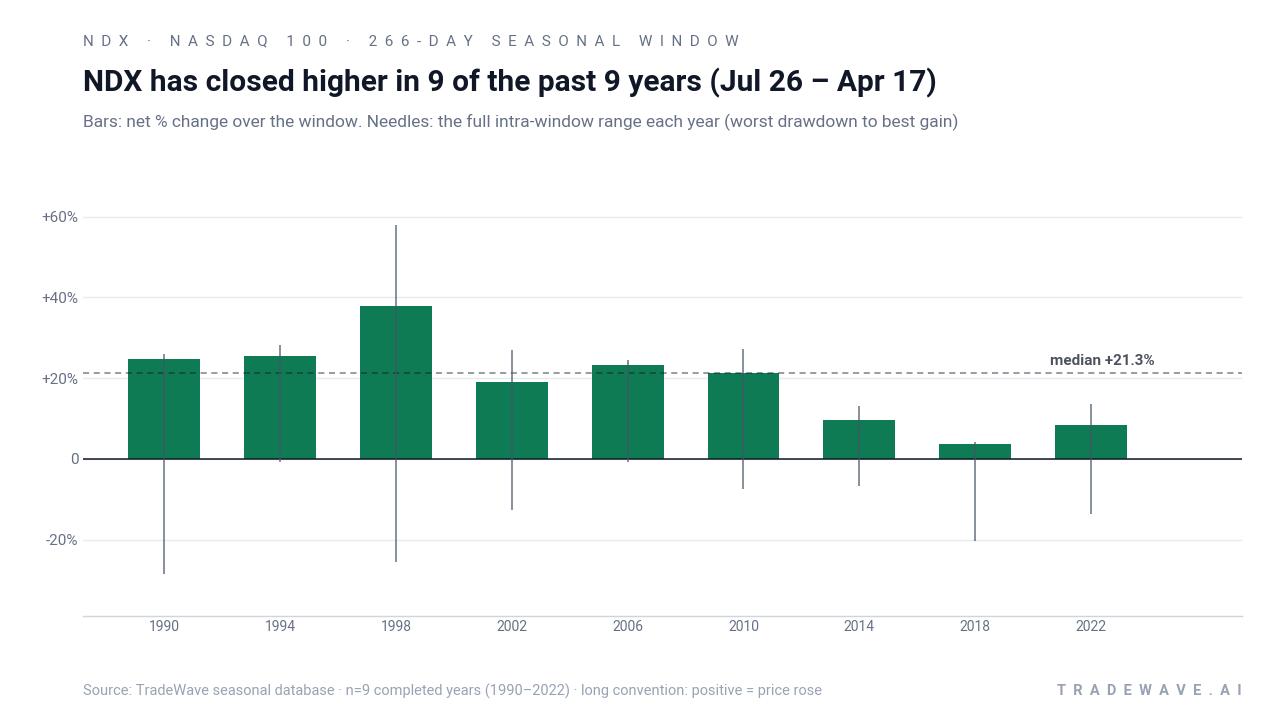
The stacked net/MFE/MAE bars make the trade-off clear: upside potential has been large, with several years showing favorable excursions north of 25%, but adverse moves have also been meaningful, occasionally exceeding 20% before the window closed higher. For long-only investors, that history argues for respecting both the strength of the pattern and the volatility that has often accompanied it.
History does not guarantee future results, and maximum adverse excursions can be large even in windows that ultimately finish positive.
Why does Nasdaq 100 (NDX) follow this seasonal pattern?
One likely driver is the way the earnings calendar and policy cycle line up between the back half of the midterm year and the year before the presidential election. Analysts have pointed to a mix of reduced policy uncertainty, steadier Federal Reserve signaling, and improving corporate guidance as catalysts that often support growth and tech-heavy benchmarks in this phase. The pattern may also reflect institutional portfolio repositioning, as large allocators lean back into risk assets once midterm political risk is out of the way.
What is driving Nasdaq 100 (NDX) today?
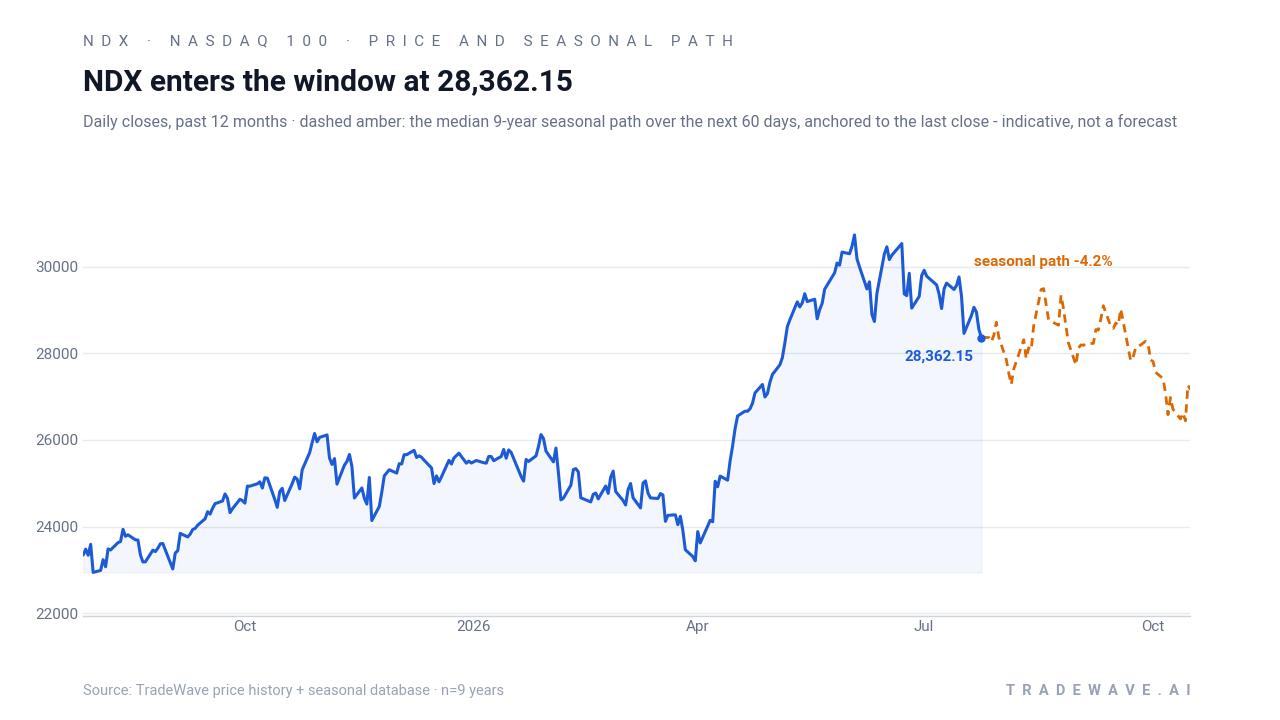
Nasdaq 100 closed the prior session at 29,025.77, down 476.83 points or 1.6%, after trading between 28,881.23 and 29,333.06 on the day. The index remains above its 50-day moving average of 29,537.18 and sits about 5.6% below its 52-week high of 30,762.20, with a one-month return of -3.14% and 20-day average volume near 9.9 billion shares across its constituents.
The chart below situates the latest pullback against the past year of trading and a 60-day seasonal projection overlay.
In October 2025, a technical study highlighted a rare pattern in the Nasdaq 100 that had appeared only six times since 1975 and historically preceded further highs, reinforcing the idea that structural forces have been supporting the index in this cycle.[1] That backdrop, combined with the strong midterm-year seasonal trend, helps explain why many systematic strategies continue to treat pullbacks as part of a larger uptrend rather than a regime shift.
What should traders watch as this Nasdaq 100 window opens?
The first marker is timing. The new seasonal window begins on Jul 26 and runs for roughly 266 trading days, so price action in the final week before entry will shape how stretched or reset the index looks going in. A deeper dip toward the 50-day moving average would echo several past years that started the window from a consolidation rather than a breakout.
Second, watch how the index behaves around prior highs near 30,762.20 once the window is underway. In earlier cycles, strong midterm-year windows often saw the Nasdaq 100 clear resistance and then trend higher in stages rather than in a single surge. A failure to hold breakouts, or repeated reversals from that zone, would be an early sign that this iteration is diverging from the historical seasonal trend.
Third, keep an eye on volatility and intraperiod drawdowns. History shows that even in winning years, maximum adverse moves have sometimes exceeded 20%, so sharp pullbacks inside the window would not be unusual by past standards. What matters for pattern confirmation is whether those drops have been followed by renewed buying that restores the longer-term uptrend.
Finally, the policy calendar will matter as the market moves from the midterm election year into the year before the presidential election. Macro headlines around Federal Reserve policy, fiscal negotiations, and regulatory shifts in key tech sectors will shape how closely this cycle tracks the prior nine. Traders who track seasonality closely will be watching whether any policy shock interrupts the typical midterm-to-pre-election climb that has defined this Nasdaq 100 window in the past.
Sources
About this seasonal analysis
Seasonal pattern data is sourced from TradeWave.ai, which analyzes historical price behavior across annual calendar windows going back up to 30 years. Read the full data methodology or the book The 100-Year Pattern by Afshin Moshrefi (2026 edition). Past performance of seasonal patterns does not guarantee future results. This article is for informational purposes only and does not constitute investment advice.