6-for-6 Midterm Record: S&P 500 Financials Sector SPDR (XLF) Averages 11.03% Gains
S&P 500 Financials Sector SPDR is stepping into a historically strong midterm-to-pre-election seasonal regime, with past cycles showing double-digit gains but also sharp intraperiod swings.

What is the seasonal pattern for S&P 500 Financials Sector SPDR (XLF)?
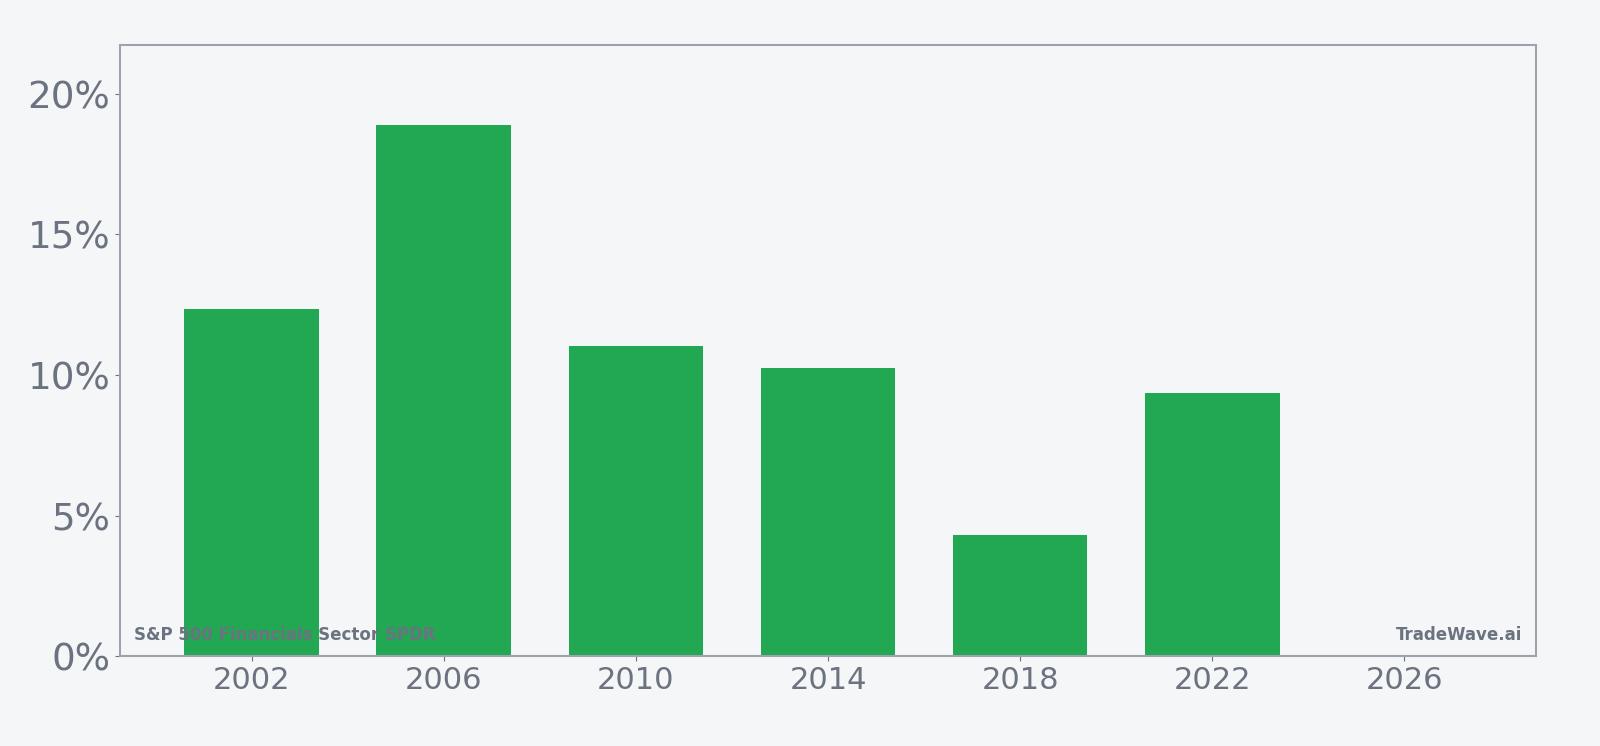
S&P 500 Financials Sector SPDR has risen in 6 of 6 midterm-year windows like this one, with an average gain of 11.03% in winning years.
- 6 for 6 in this window, with S&P 500 Financials Sector SPDR averaging 11.03% gains in winning years.
- Seasonal window starts Jul 17 and runs 352 trading days, spanning late midterm election year into the following pre-election year.
- Percent Profitable is 100%, with 6 winners and 0 losers across the last six comparable midterm election cycles.
- Trade Direction is long, supported by an annualized return of 10.94% and a Sharpe ratio of 1.51 over the sample.
- TradeWave Ratio of 2.04 signals that price has typically traveled meaningfully in the trade direction within the window, even with intraperiod volatility.
- Individual years have seen adverse moves as deep as about 18% inside the window, underscoring that strong seasonality has not eliminated drawdowns.
According to historical data from TradeWave.ai, this midterm-to-pre-election stretch for financials has behaved very differently from an average year on the calendar. The next section walks through how that pattern has played out for XLF in prior cycles and what that backdrop means for the current window.
How has S&P 500 Financials Sector SPDR (XLF) traded in this midterm-year window?
S&P 500 Financials Sector SPDR has posted gains in every one of the last six midterm election years during the 352-day window that begins around Jul 17, averaging 11.03% advances for long positions. The ETF is entering this regime in the middle of the midterm election year and historically has carried that strength through into the following pre-election year, a phase that has often been supportive for risk assets.
Grouping the data by the presidential election cycle matters here because financials are tightly linked to policy, regulation and the rate backdrop, all of which tend to follow a four-year rhythm. This specific XLF seasonal trend captures the late-midterm period, when Washington often shifts from tightening and uncertainty toward a more supportive stance ahead of the next presidential race.
Across the six midterm election years in this sample, the trade direction is firmly long. Percent Profitable sits at 100%, with 6 winners and 0 losers, and the average profit for those winning years is 11.03%. The annualized return of 10.94% and a Sharpe ratio of 1.51 point to a historically favorable risk-adjusted profile for this XLF seasonal pattern.
The per-year table shows how that has played out in individual cycles. The strongest year in the sample was 2006, when XLF gained 18.9% from entry to exit, while the softest outcome was 2018, which still finished up 4.3% despite a rough patch for global risk assets. Even in 2002, a challenging environment for financials, the ETF advanced 12.35% across this same midterm-to-pre-election trading window.
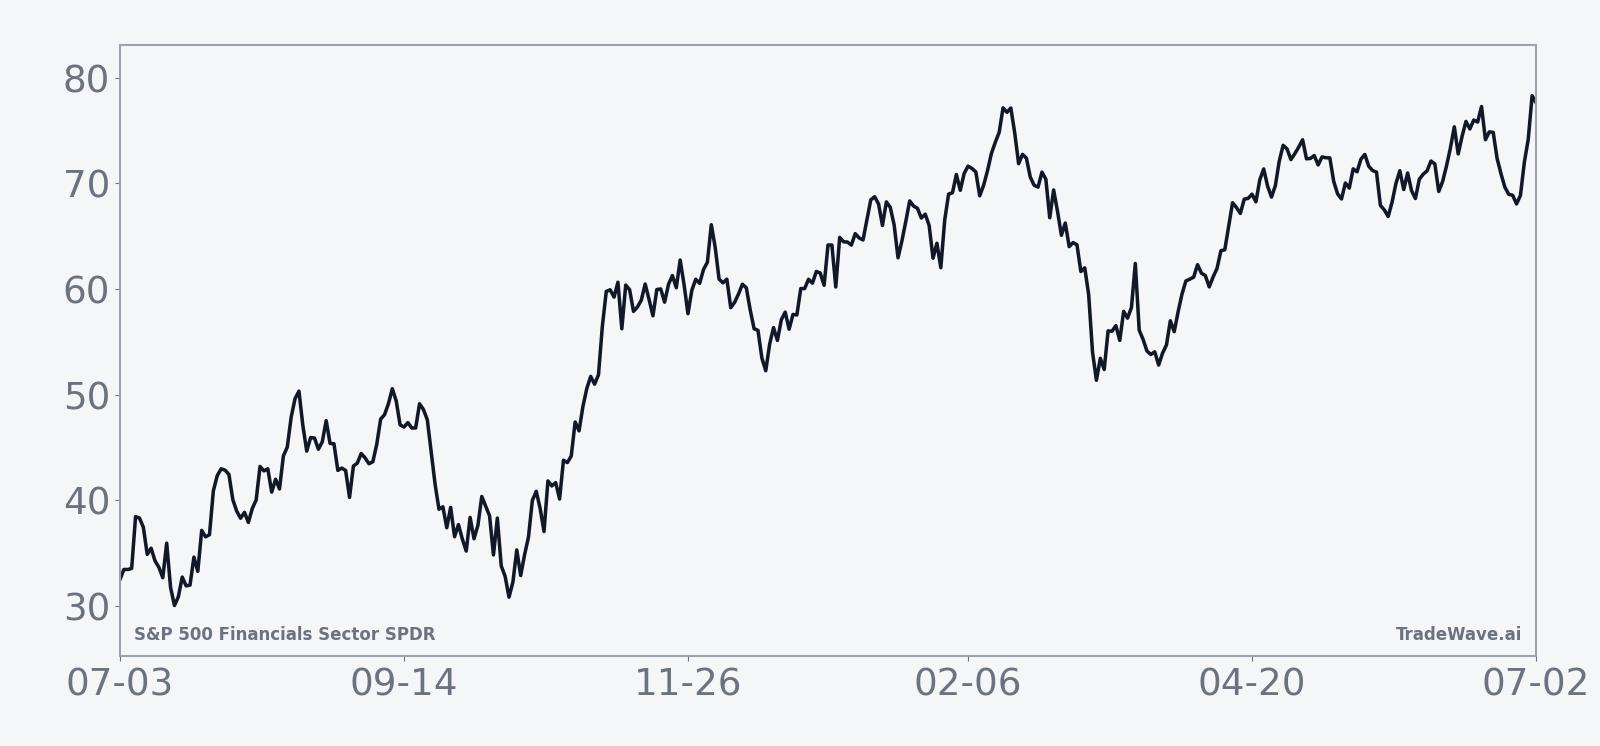
The historical seasonal average suggests that gains in this XLF trading window tend to accrue steadily rather than in a single burst. The trend line climbs through much of the period, with only modest pauses, which fits a narrative of financials grinding higher as midterm-year policy uncertainty fades and the pre-election year’s pro-growth bias kicks in.
Year-by-year net returns and intraperiod swings show how upside and downside have coexisted inside this otherwise consistent pattern.
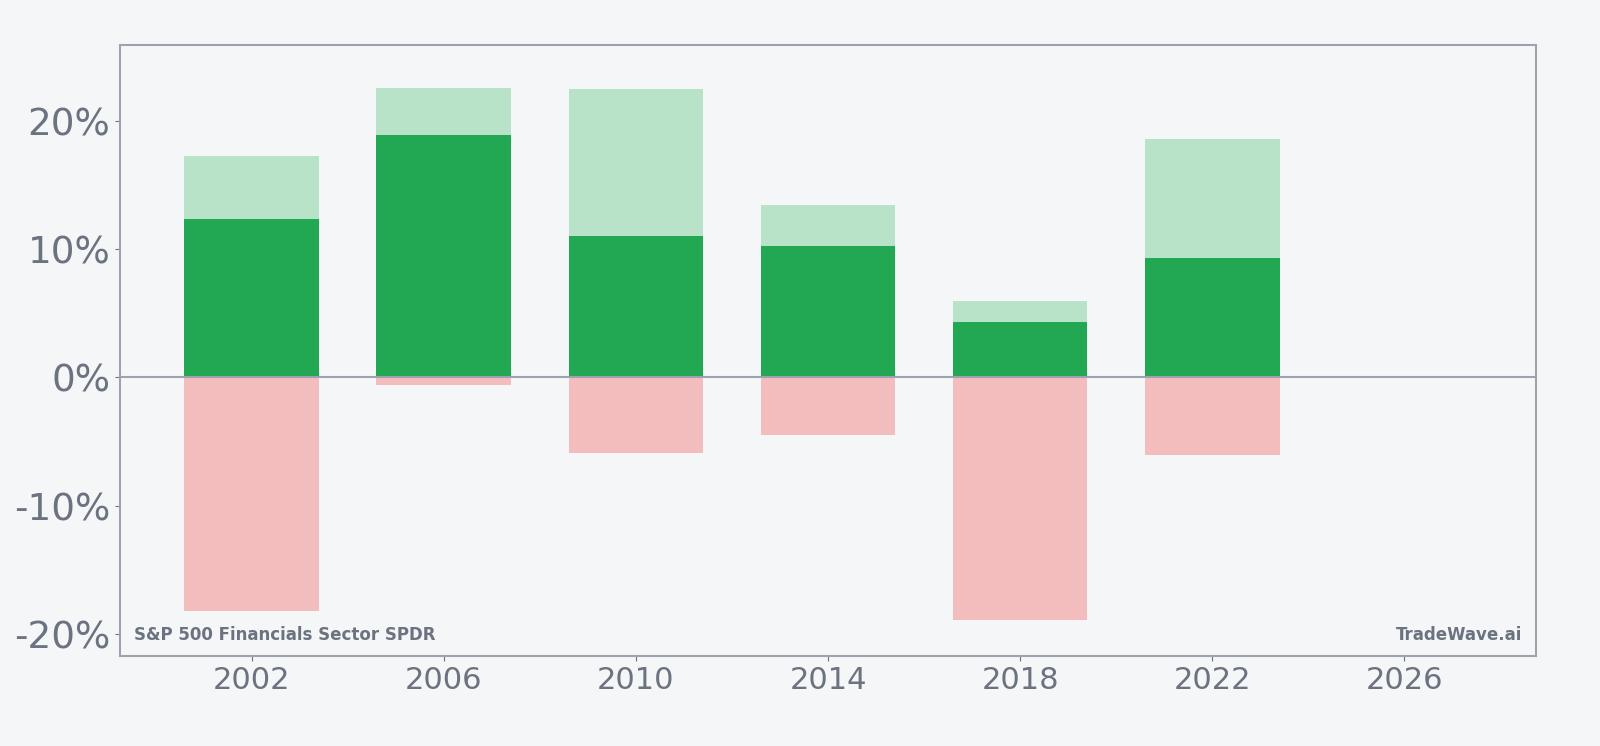
The bars with maximum favorable and adverse excursions underline that this has been a high-conviction but not low-volatility setup. In 2010, for example, XLF’s best intraperiod move reached 22.53% above the entry level, while the worst drawdown was 5.88% below. In 2018, the ETF finished higher but endured an adverse move of 18.93% at one point, showing that even winning years have contained sizable pullbacks inside the window.
The cumulative return profile across all six cycles adds up to an 86% gain for this pattern window, which is substantial for a sector ETF tied to large-cap financials. Add it up: six midterm election years, six winners, and a long-only seasonal regime that has historically rewarded patience, provided investors could tolerate the intraperiod swings.
History does not guarantee future results; adverse excursions can be large even in winning windows, and past XLF drawdowns inside this pattern have at times approached 20% before recovering.
Why does S&P 500 Financials Sector SPDR (XLF) follow this seasonal pattern?
One likely driver is the way the policy and rate backdrop evolves from the midterm election year into the pre-election year, a phase when Washington often shifts from tightening and regulatory noise toward a more market-friendly stance. Analysts also point to institutional portfolio rebalancing and sector rotation, as investors move back into financials once midterm uncertainty clears and the next presidential race comes into view. The clustering of bank earnings and capital-return announcements across this span may further reinforce the historical XLF seasonal trend.
What is driving S&P 500 Financials Sector SPDR (XLF) today?
S&P 500 Financials Sector SPDR is entering this historically strong midterm-year window after a 5.15% gain over the past month, trading between a 52-week low near 47.34 and a high of 56.84 with recent action hovering around its 50-day moving average of 52.83. Average 20-day volume of roughly 34.7 million shares underscores how central XLF remains as a proxy for U.S. banks, insurers and diversified financials, and the ETF’s one-month climb suggests investors have been leaning back into the sector ahead of the heart of earnings season.
The chart below situates the latest move in its recent multi-month context and overlays a short-term seasonal projection.
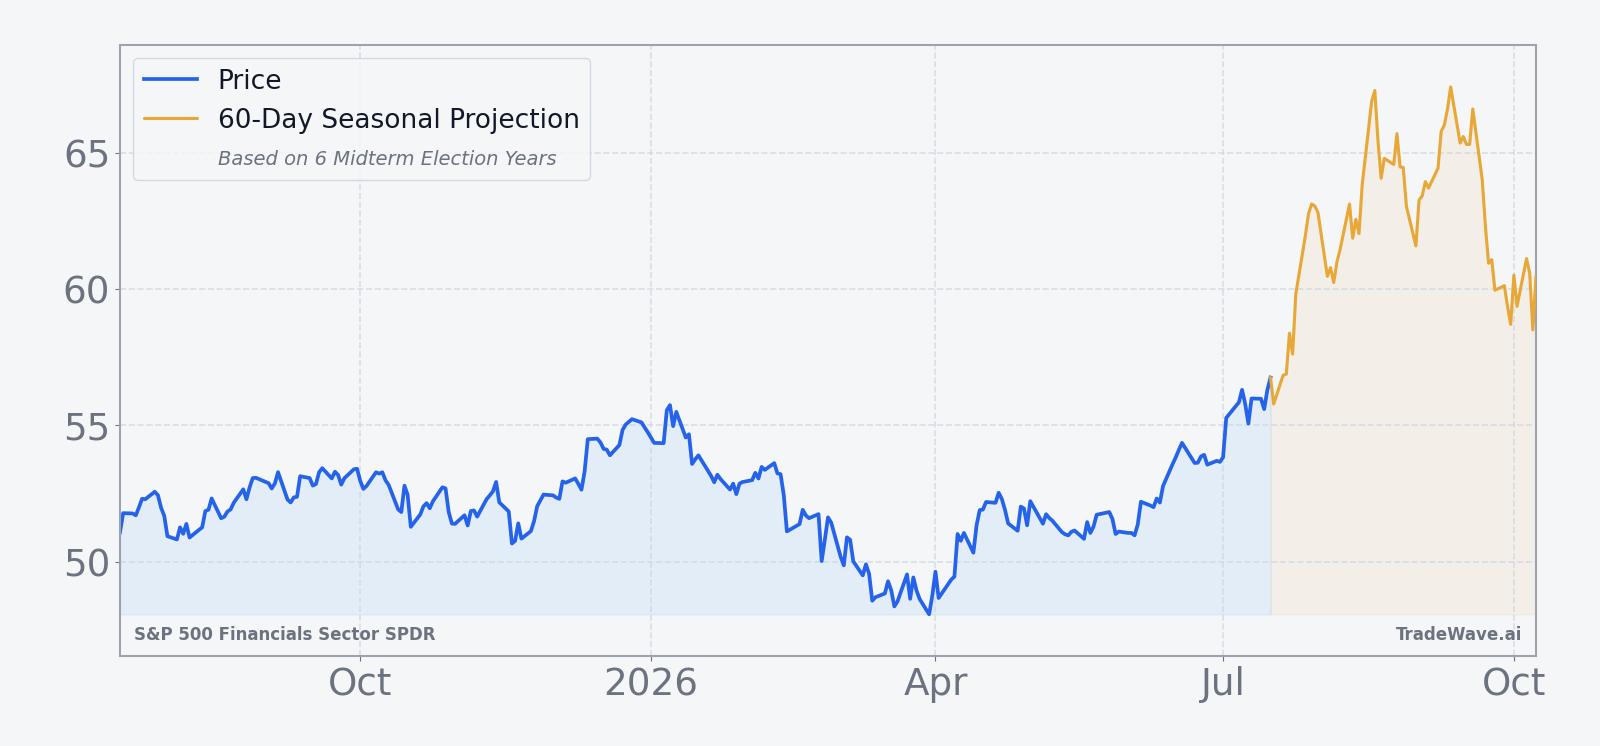
For traders, the setup is straightforward but not simple. The XLF seasonal outlook for this midterm-to-pre-election stretch has been unambiguously positive in the past, yet the bars chart makes clear that those gains have come with meaningful volatility along the way. The key test in this cycle will be whether financials can follow the historical script of grinding higher from midterm summer into the following year while absorbing the kind of double-digit drawdowns that have marked prior windows.
What should traders watch in this XLF seasonal window?
First, watch how XLF behaves around its 50-day moving average near 52.83 as the new window unfolds; in prior cycles, sustained strength above that kind of intermediate trend line has often coincided with the stronger seasonal stretches. Second, monitor whether pullbacks stay shallower than the worst historical adverse moves, which have reached roughly 18% inside the window in years like 2002 and 2018. Third, track how the ETF responds to the coming run of bank earnings, regulatory headlines and rate expectations, since those catalysts have historically shaped the path of returns even when the full-window outcome stayed positive.
If XLF can hold recent gains and treat any midterm-year volatility as consolidation rather than trend reversal, it would be consistent with the six-for-six record this seasonal pattern carries into the current cycle. A break of that behavior, especially if accompanied by deeper-than-usual drawdowns or a failure to participate in broader pre-election-year strength, would be an early sign that this time may be diverging from the historical script.
Sources
About this seasonal analysis
Seasonal pattern data is sourced from TradeWave.ai, which analyzes historical price behavior across annual calendar windows going back up to 30 years. Read the full data methodology or the book The 100-Year Pattern by Afshin Moshrefi (2026 edition). Past performance of seasonal patterns does not guarantee future results. This article is for informational purposes only and does not constitute investment advice.