7-for-7 Midterm Run: S&P 500 SPDR (SPY) Averages 15.07% Gains in This 363-Day Window
S&P 500 SPDR is approaching a 363-day midterm-year seasonal window that has never been negative in the last seven cycles, just as traders weigh inflation, Fed policy and the next leg of the bull market.

What is the seasonal pattern for S&P 500 SPDR (SPY)?
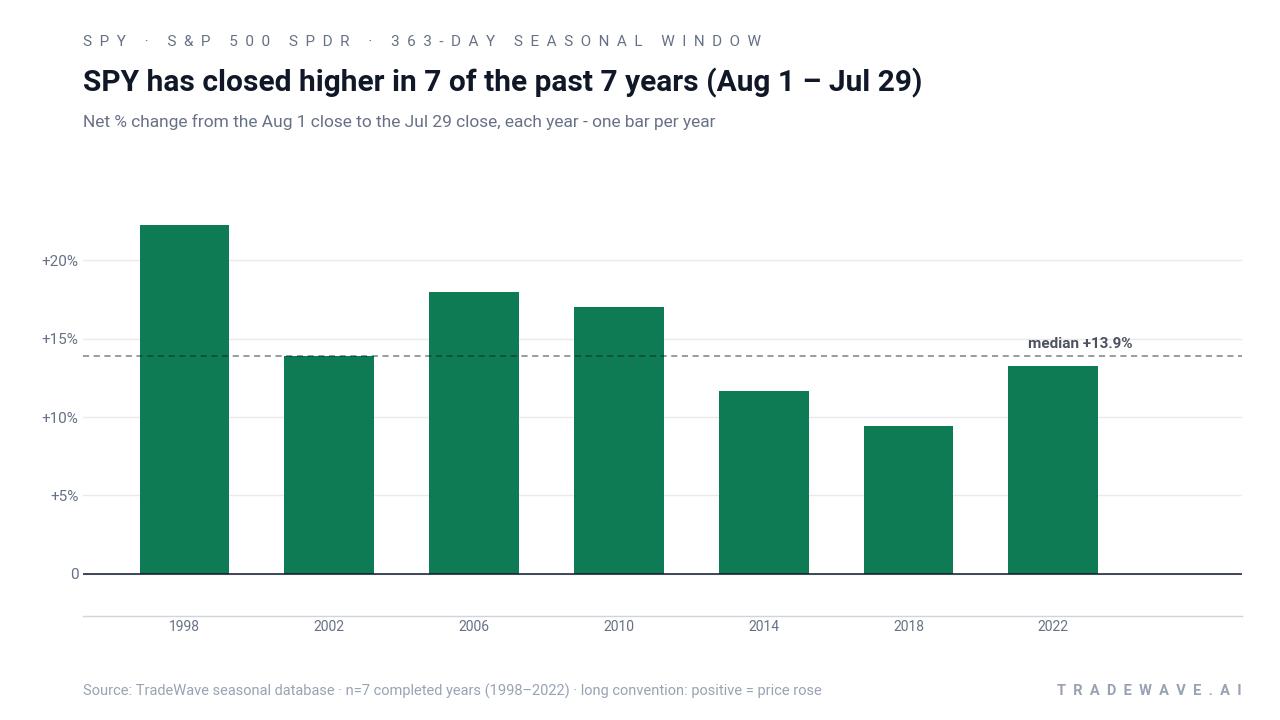
S&P 500 SPDR has risen in 7 of 7 midterm-year windows starting around Aug. 1, with an average gain of 15.07% in winning years.
- 7 for 7 in this window, with S&P 500 SPDR averaging 15.07% gains in winning years across the last seven midterm election cycles.
- The upcoming seasonal window begins on Aug. 1, 2026 and runs for 363 trading days, spanning the late midterm year into the heart of the year before the presidential election.
- Percent Profitable is 100%, with 7 winners and 0 losers in this S&P 500 SPDR trading window.
- Average profit of 15.07% reflects strong upside across all years in the sample, with no negative outcomes in this long SPY seasonal trend.
- Intraperiod swings have been meaningful, with individual years showing double-digit peak run-ups and double-digit drawdowns before finishing higher.
- The pattern aligns with the well-known tendency for the S&P 500 to strengthen from late in the midterm election year into the year before the presidential election.
According to historical data from TradeWave.ai, this is not just another calendar stretch for SPY but a distinct election-cycle regime. TradeWave.ai’s historical database shows a repeatable pattern that links late midterm-year positioning with the risk-on tone that often builds into the year before the presidential election.
How strong is the upcoming seasonal window for S&P 500 SPDR (SPY)?
The seasonal window beginning Aug. 1 has delivered gains for S&P 500 SPDR in every one of the last seven midterm election years, averaging 15.07% upside for long positions. With the ETF trading near the upper end of its 52-week range and only about 1.6% below its recent high, the next iteration of this pattern arrives as bulls already hold the upper hand. This combination of a clean win streak and a market sitting close to its highs makes the Aug. 1 start date a key line on the calendar for anyone tracking SPY’s historical seasonality.
Grouping the data by the presidential election cycle matters here because this window sits squarely in the midterm election year, a phase that has historically looked very different from the post-election year or the election year itself. In many cycles, the S&P 500 has struggled through choppy, policy-heavy midterm months before flipping into a stronger, more persistent advance as the calendar turns toward the year before the presidential election, when fiscal and monetary policy often lean more supportive of risk assets.
Within that framework, the Aug. 1 start date marks the handoff into what many traders think of as the “back half” of the midterm year, when the market begins to look through near-term policy noise and price in the next phase of the cycle. The Trade Direction for this pattern is explicitly long, and across the last seven midterm election years every single iteration finished higher over the 363-day span. Average gains of 15.07% sit alongside a median profit of 13.88%, which tells you the typical outcome has been a solid double-digit advance rather than a single outlier skewing the numbers.
The per-year table shows how consistent that SPY seasonal trend has been. The strongest year in the sample was 1998, when the ETF returned 22.24% over the window, while the softest was 2018, which still delivered a 9.46% gain despite a volatile backdrop. Even in 2002, a difficult environment for equities, SPY managed a 13.88% rise across this same midterm-year slice.
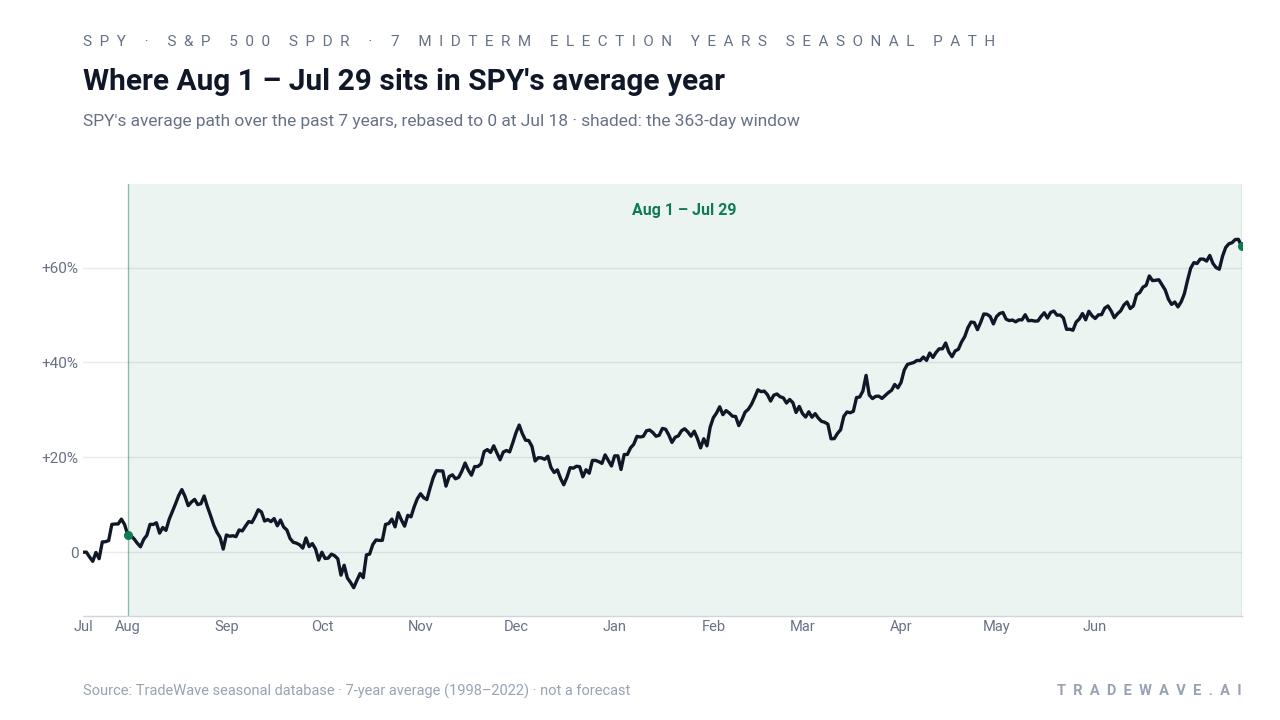
Yearly net and peak moves highlight upside persistence amid typical drawdowns.
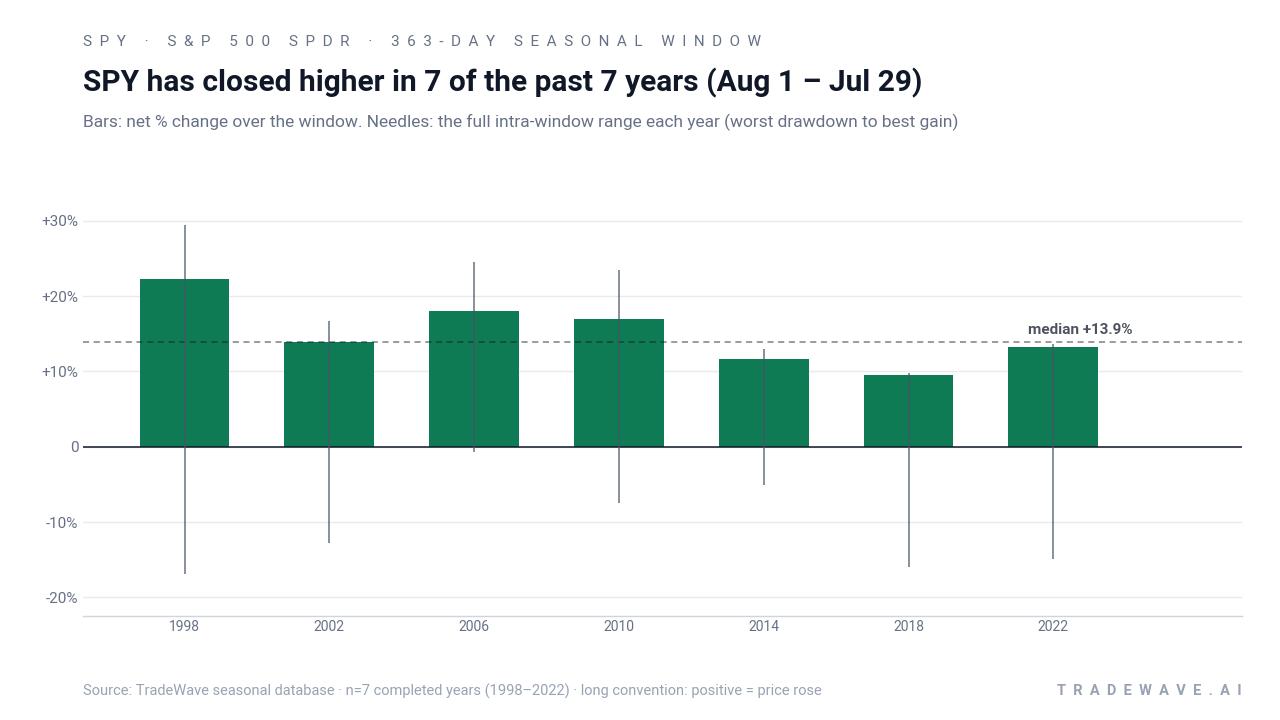
The bar chart that combines net returns with peak run-ups and worst drawdowns shows why this S&P 500 SPDR trading window has mattered for both bulls and risk managers. In 1998, for example, SPY’s best intraperiod move reached 29.37% above the entry level while the worst drawdown hit 16.86% below, a reminder that even winning years can involve deep air pockets. In 2006 the pattern was smoother, with a 24.5% maximum favorable move and only a 0.74% adverse excursion, while 2018 and 2022 both saw double-digit downside at some point in the window before finishing higher.
The TradeWave Ratio of 2.03 signals that price has typically traveled meaningfully in the trade direction within the window, independent of where it closed, and the Sharpe ratio of 2.58 points to a strong risk-adjusted profile based on end-of-window outcomes. Trend metrics show 42 long-trend bars versus zero short-trend bars across the full window, and an even stronger 54-to-0 skew when you focus on the primary trend segment, underscoring how often SPY has spent this period grinding higher rather than chopping sideways.
Viewed through the lens of the broader “100-Year Pattern” work on midterm-to-pre-election behavior, this 363-day stretch overlaps the long midterm-to-pre-election regime that has historically been one of the S&P 500’s most reliable bullish phases. Add it up: 165% cumulative gains across the seven midterm-year windows in this sample, with no losing years, is a record that even seasoned index traders may not fully appreciate.
History does not guarantee future results; adverse excursions (MAE) can be large even in winning windows.
Why does S&P 500 SPDR (SPY) follow this seasonal pattern?
One likely driver is the way the policy calendar and earnings cycle line up in the back half of the midterm year and into the year before the presidential election. Analysts have pointed to a mix of reduced political uncertainty after midterm votes, more predictable fiscal policy and a tendency for central banks to avoid major tightening late in the cycle as reasons risk appetite often improves. This pattern may also reflect institutional portfolio repositioning, as large allocators lean back into equities once early midterm volatility has flushed out weaker hands.
What is driving S&P 500 SPDR (SPY) today?
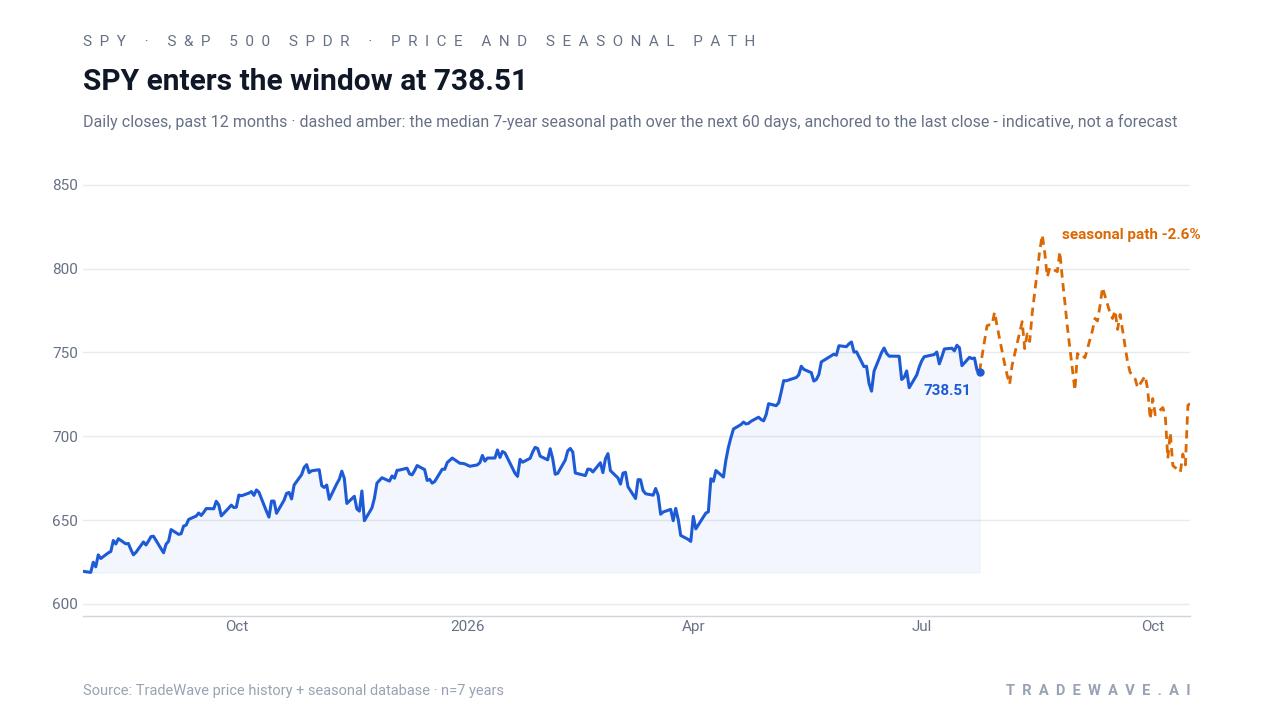
SPY heads toward this historically strong midterm-year seasonal window with the tape already firm, trading close to its 52-week high and logging a modest 0.57% gain over the past month. The macro backdrop remains dominated by inflation data and the Federal Reserve’s rate path, with investors watching the Core PCE price index and debating how many cuts might ultimately land in this cycle, a debate that has repeatedly swung broad equity ETFs like SPY over the past year.[1][3]
The chart below situates the latest move in its recent multi-month context.
Macro stories around jobs and growth also hang over the index. A weak jobs report earlier in the cycle sparked talk of an inflection point for equities, while strategists at major banks have argued that eventual Fed easing could support U.S. stocks, including SPY, if the economy avoids a hard landing.[2][3] For traders, the key question is how that policy and growth mix will intersect with a historical seasonality profile that has, so far, been unusually one-sided in favor of the bulls.
What should traders watch as this SPY seasonal window opens?
First, the calendar itself matters: Aug. 1 is the formal start of this 363-day S&P 500 SPDR trading window, and behavior in the first few weeks often sets the tone for how aggressively investors lean into the pattern. A firm tape that holds near the top of the 52-week range would be more consistent with prior strong years, while an early break lower would test how much weight traders are willing to put on the historical record.
Second, watch how inflation and Fed expectations evolve around key data releases such as Core PCE and jobs reports, since those have been the main macro levers for SPY in this cycle.[1][2][3] A backdrop of easing inflation and a credible path to rate cuts has historically lined up well with the risk-on bias that often emerges from late in the midterm year into the year before the presidential election. If, instead, inflation re-accelerates or the Fed turns more hawkish, the market could experience the kind of deep intraperiod drawdowns that past windows have shown even in winning years.
Finally, levels matter. Traders will be watching how SPY behaves around its recent high and the 50-day moving average as the window opens, using those reference points to judge whether the current rally is extending in line with the historical SPY seasonal trend or diverging from it. A pattern of buying dips within that band would echo prior midterm-year windows, while sustained breaks below support would signal that this cycle may not follow the script.
Sources
About this seasonal analysis
Seasonal pattern data is sourced from TradeWave.ai, which analyzes historical price behavior across annual calendar windows going back up to 30 years. Read the full data methodology or the book The 100-Year Pattern by Afshin Moshrefi (2026 edition). Past performance of seasonal patterns does not guarantee future results. This article is for informational purposes only and does not constitute investment advice.