Nasdaq 100 (NDX) Has Rallied in 9 of 9 Midterm Windows From July, Averaging 18.08% Gains
Nasdaq 100 is less than 4% off its 52-week high as it heads toward a 273-day midterm-year seasonal window that has never posted a loss in the last nine cycles.

What is the seasonal pattern for Nasdaq 100 (NDX)?
Nasdaq 100 has risen in 9 of 9 midterm-election-year windows starting around Jul 19 and lasting 273 days, with an average gain of 18.08% in winning years.
- 9 for 9 in this window, with Nasdaq 100 averaging 18.08% gains in winning years across the last nine midterm election cycles.
- The upcoming window begins on Jul 19, 2026 and runs for 273 trading days, spanning the late midterm year into the pre-election year.
- Percent Profitable is 100%, with 9 winners and 0 losers in the historical sample for this NDX seasonal trend.
- Average profit in winning years is 18.08%, with a cumulative return of 333% and an annualized return of 17.7% across the pattern history.
- The TradeWave Ratio (TWR) of 1.44 indicates that price has typically traveled meaningfully in the long direction within the window, while a Sharpe ratio of 1.5 reflects strong risk-adjusted outcomes.
- Intraperiod swings have still been sizable in some years, with adverse moves exceeding 30% in the weakest stretch even though every window finished positive.
According to historical data from TradeWave.ai, this midterm-year stretch for the Nasdaq 100 has behaved very differently from an average calendar year. The next section walks through what that pattern has looked like and how it lines up with today’s setup.
How has Nasdaq 100 (NDX) traded in this midterm-to-pre-election window?
Nasdaq 100 has risen in all nine prior midterm-election-year windows that start around Jul 19 and run for 273 trading days, averaging 18.08% gains with a long bias. Today the index closed at 29,670.95, down 1.0% on the session and about 3.5% below its 52-week high of 30,762.20.[1] That combination of a strong historical seasonality profile and an index sitting near the top of its one-year range is the backdrop as traders look toward the next leg of the presidential election cycle.
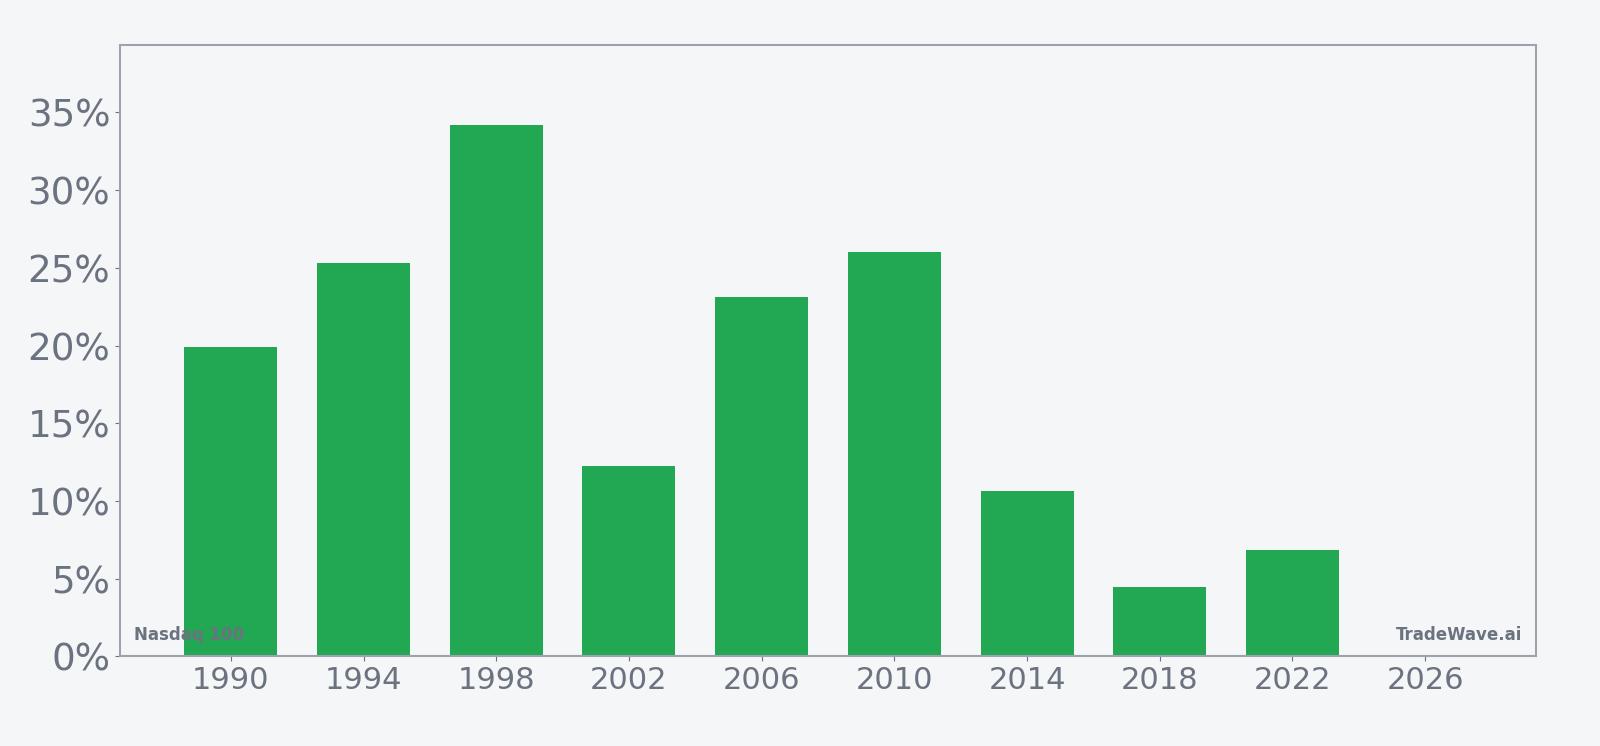
Because this pattern is grouped by the presidential election cycle, it captures how the Nasdaq 100 has behaved specifically in the late part of the midterm election year and into the following pre-election year. That matters for a tech-heavy benchmark like NDX, where policy expectations, regulation risk and liquidity conditions often shift as Washington moves from midterm outcomes toward the next presidential race.
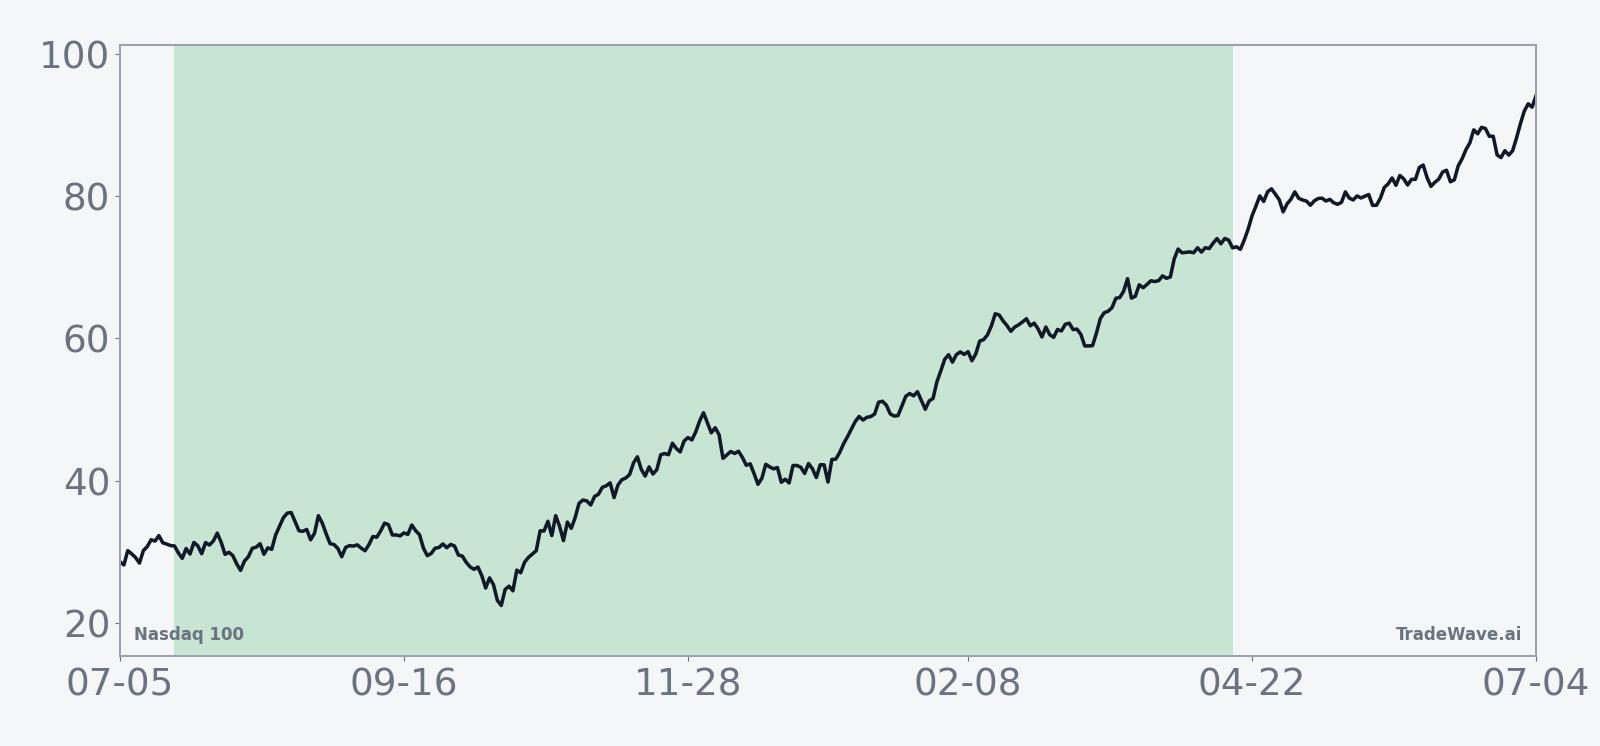
The historical seasonal average shows a fairly steady climb across the window, with gains building through the back half of the midterm year and continuing into the pre-election year. Trend statistics back that up: the pattern logged 62 long-trend observations versus 0 short-trend readings across the full window, and even on a shorter look the long side dominated 51 to 1. In plain English, when this window has opened in past midterm years, the typical path has been a grind higher rather than a choppy sideways tape.
Average profit of 18.08% across nine winners is only part of the story. The strongest year in the sample, 1998, saw a net return of 34.22% with a maximum favorable move of 53.58% from entry, while the weakest, 2018, still finished up 4.47% despite a maximum adverse move of 19.82% along the way. That mix of solid end-of-window gains and sometimes deep intraperiod drawdowns is what gives this NDX seasonal pattern its punch.
Yearly net and peak moves highlight how upside and downside swings have coexisted inside this otherwise consistent window.
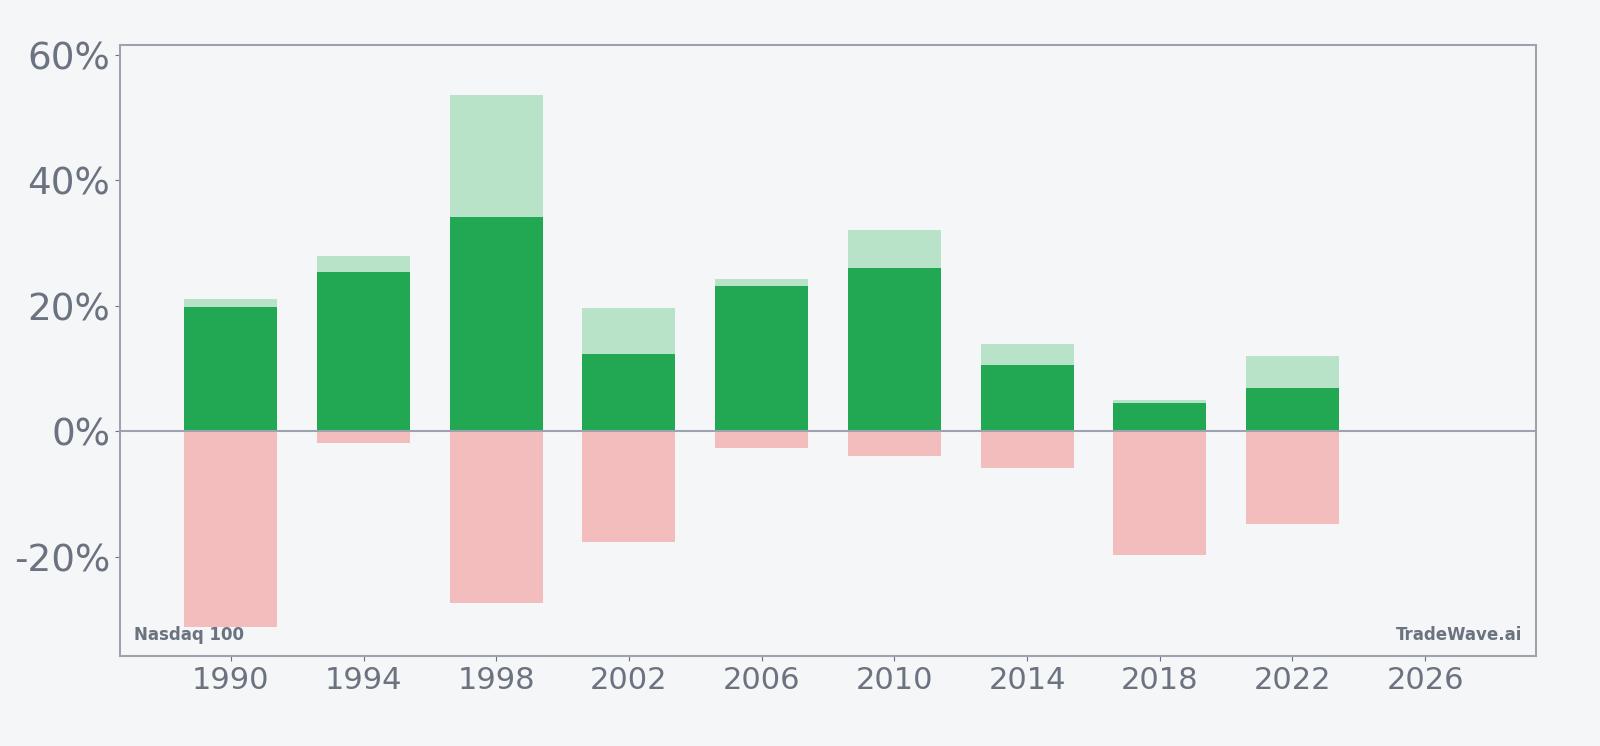
The stacked view of net returns, maximum favorable excursion and maximum adverse excursion makes the risk profile clear. In 1990, for example, NDX finished the window up 19.88% but at one point was down 31.24% from the entry level, while in 2006 the index never fell more than 2.71% below entry and still delivered a 23.1% gain. Large positive excursions paired with contained adverse moves in some years, and deep but ultimately recovered drawdowns in others, underline that this has been a high-conviction long window but not a low-volatility one.
History does not guarantee future results; adverse excursions can be large even in winning windows, and traders using seasonal tendencies still face the risk that the next cycle breaks the pattern.
Why does Nasdaq 100 (NDX) follow this seasonal pattern?
This midterm-to-pre-election pattern may reflect how tech and growth stocks respond to the policy calendar and earnings cycle. One likely driver is that midterm election uncertainty tends to clear by late in the year, while fiscal and regulatory plans for the coming presidential race start to firm up, encouraging risk-taking in growth-heavy benchmarks. Analysts also point to the clustering of big-cap tech earnings and index rebalancing in this stretch, which can amplify flows into the Nasdaq 100 when sentiment is constructive.
What is driving Nasdaq 100 (NDX) today?
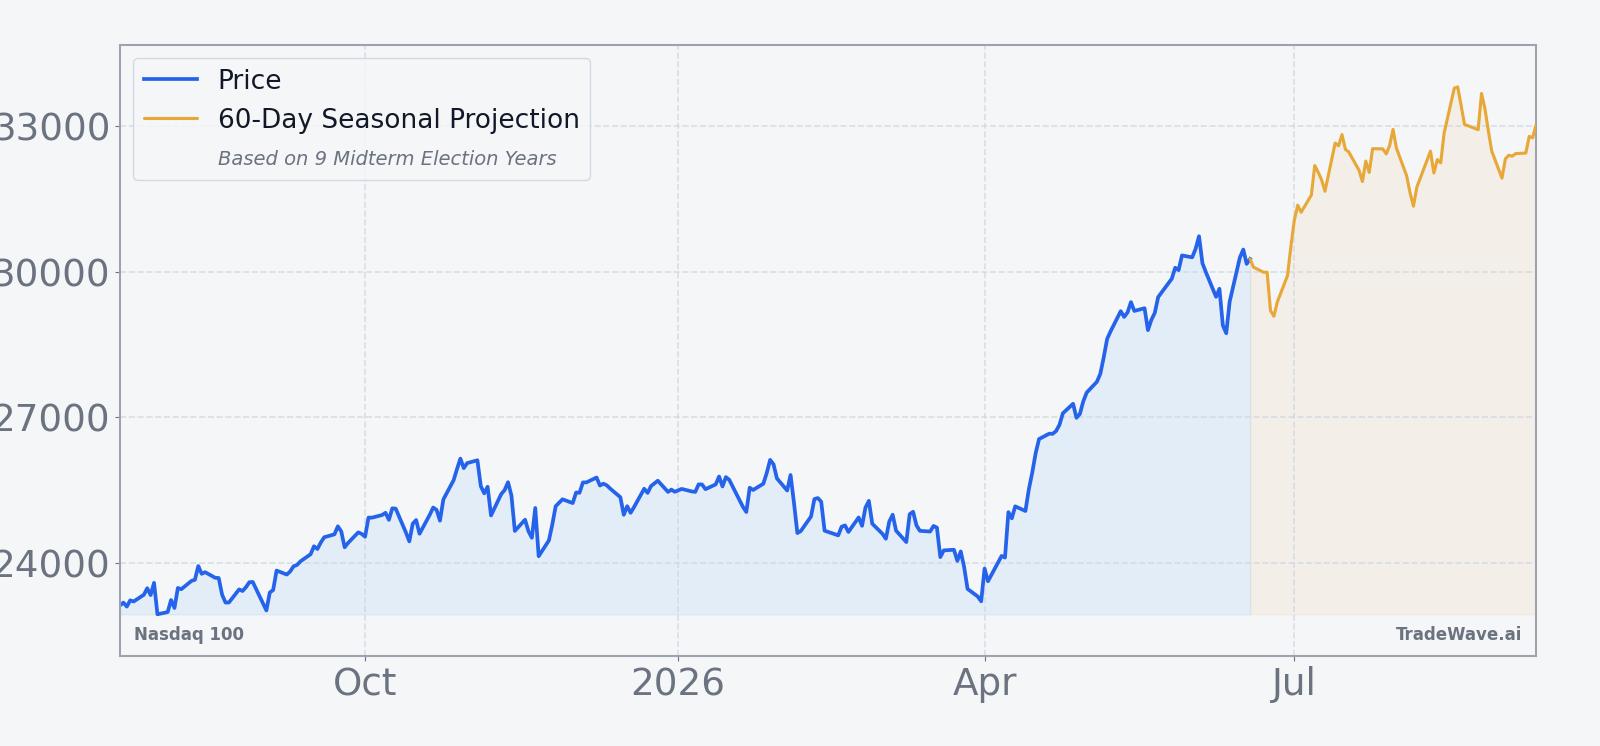
Nasdaq 100 finished Friday at 29,670.95, down 0.99% on the day, after trading between 29,604.93 and 30,208.94 and opening at 30,160.74.[1] The index is still up over the past month, with a 3.78% gain, and sits about 3.5% below its 52-week high of 30,762.20 while holding well above its 52-week low of 21,532.32 and its 50-day moving average of 28,484.11.[1] That leaves NDX in a firmly bullish trend heading into late June, with technology and growth names continuing to anchor broader risk sentiment.
One near-term structural driver is the June 2026 quarterly rebalance of the Nasdaq-100, which takes effect before the market opens on Jun 22.[1] Nasdaq has announced additions and removals that will tweak sector weights and could shift flows in index-tracking ETFs and derivatives as managers adjust to the new lineup.[1] For a benchmark that serves as a barometer for technology and growth-oriented companies, even modest changes in constituent mix can alter how sensitive NDX is to themes like artificial intelligence, cloud spending or consumer hardware cycles.[2]
In Feb 2026, Nasdaq also proposed a “fast entry” rule that would speed the inclusion of large new listings into flagship indexes such as the Nasdaq-100.[2] While that proposal predates the current rebalance, it underscores a broader shift in market structure: big-cap IPOs and direct listings could influence NDX composition more quickly than in past cycles, potentially tightening the link between primary issuance and index-level performance.[2] For traders watching the upcoming seasonal window, that means any large-cap tech or growth listing in late 2026 could feed into index dynamics faster than historical patterns alone might suggest.
The chart below situates the latest pullback against the past year’s rally and a short-term seasonal projection.
What should traders watch as this NDX seasonal window approaches?
First, the calendar: the 273-day window tied to the midterm election year begins on Jul 19, 2026 and runs deep into the pre-election year. Historically, that has been a strong stretch for long exposure in NDX, but the path has not been smooth, with several cycles showing double-digit drawdowns before recovering. How the index behaves into and through the June rebalance will help show whether current leadership in mega-cap tech is likely to carry into that seasonal regime.[1]
Second, levels: traders will be watching whether NDX can reclaim and hold above the 30,762.20 52-week high and maintain support near the 50-day moving average around 28,484.[1] A breakout to new highs ahead of the window would echo several past cycles where the index entered the pattern already in an uptrend, while a failure at resistance or a break of the 50-day could set up a more volatile entry similar to 1990 or 2018.
Third, policy and listing news: any updates on Nasdaq’s fast-entry proposal or additional index methodology tweaks could change how quickly new tech leaders are reflected in NDX.[2] In a year where the presidential race will soon dominate headlines, shifts in regulation, antitrust scrutiny or fiscal priorities for technology and growth sectors could either reinforce or blunt the historical midterm-to-pre-election tailwind.
Finally, behavior inside the window will be the real test of this historical seasonality. If NDX again shows a tendency to grind higher over the bulk of the 273 days, with pullbacks that resemble past maximum adverse moves rather than breaking them, that would be consistent with the nine-for-nine record. A sustained failure to hold rallies or an unusually deep and persistent drawdown would be an early sign that this cycle is diverging from the pattern, reminding traders that even a strong historical edge is a tendency, not a rule.
Sources
About this seasonal analysis
Seasonal pattern data is sourced from TradeWave.ai, which analyzes historical price behavior across annual calendar windows going back up to 30 years. Read the full data methodology or the book The 100-Year Pattern by Afshin Moshrefi (2026 edition). Past performance of seasonal patterns does not guarantee future results. This article is for informational purposes only and does not constitute investment advice.