Soybean Meal (ZM) Exports Face Brazil Shift as 8-of-10 Midterm July Slide Window Nears
Soybean Meal futures are hovering near $304 as an 11-day midterm-election-year July seasonal window with a strong short-side track record approaches, putting a spotlight on feed costs and crush margins.
Price as of Jun 30, 2026: $304.30 (intraday).

What is the seasonal pattern for Soybean Meal (ZM)?
Soybean Meal has fallen in 8 of 10 midterm-election-year July windows during this 11-day stretch, with an average 4.14% gain in winning short trades.
- 8 for 10 in this window, with winning short years averaging 4.14% price declines in Soybean Meal.
- The upcoming 11-day Soybean Meal trading window starts on Jul 12, 2026 and targets midterm election years only.
- Percent Profitable sits at 80%, with 8 winners and 2 losers for the short-side pattern.
- Including every year, Avg Profit - All is 2%, showing that losing years have been meaningfully adverse.
- Typical losing years for shorts have seen average losses of -8.09%, underscoring squeeze risk when the pattern misfires.
- The TradeWave Ratio of 1.38 points to sizable intraperiod moves in the trade direction relative to the 11-day window length.
According to historical data from TradeWave.ai, this mid-July stretch in midterm election years has behaved differently from a typical month for Soybean Meal, with a distinct short-side bias that traders often overlook.
How has Soybean Meal (ZM) traded in this midterm-year July window?
Soybean Meal has delivered profitable short trades in 8 of the last 10 midterm-election-year July windows, with winning years averaging 4.14% declines over just 11 calendar days. The next iteration of this window begins on Jul 12, 2026, with futures currently around 304.3, roughly 11.2% below the 52-week high of 342.7 and about 14.2% above the 52-week low of 266.5. That combination of a clear historical pattern, a mid-range price location, and a tight calendar countdown makes this slice of the summer soybean meal seasonal trend hard for risk managers to ignore.
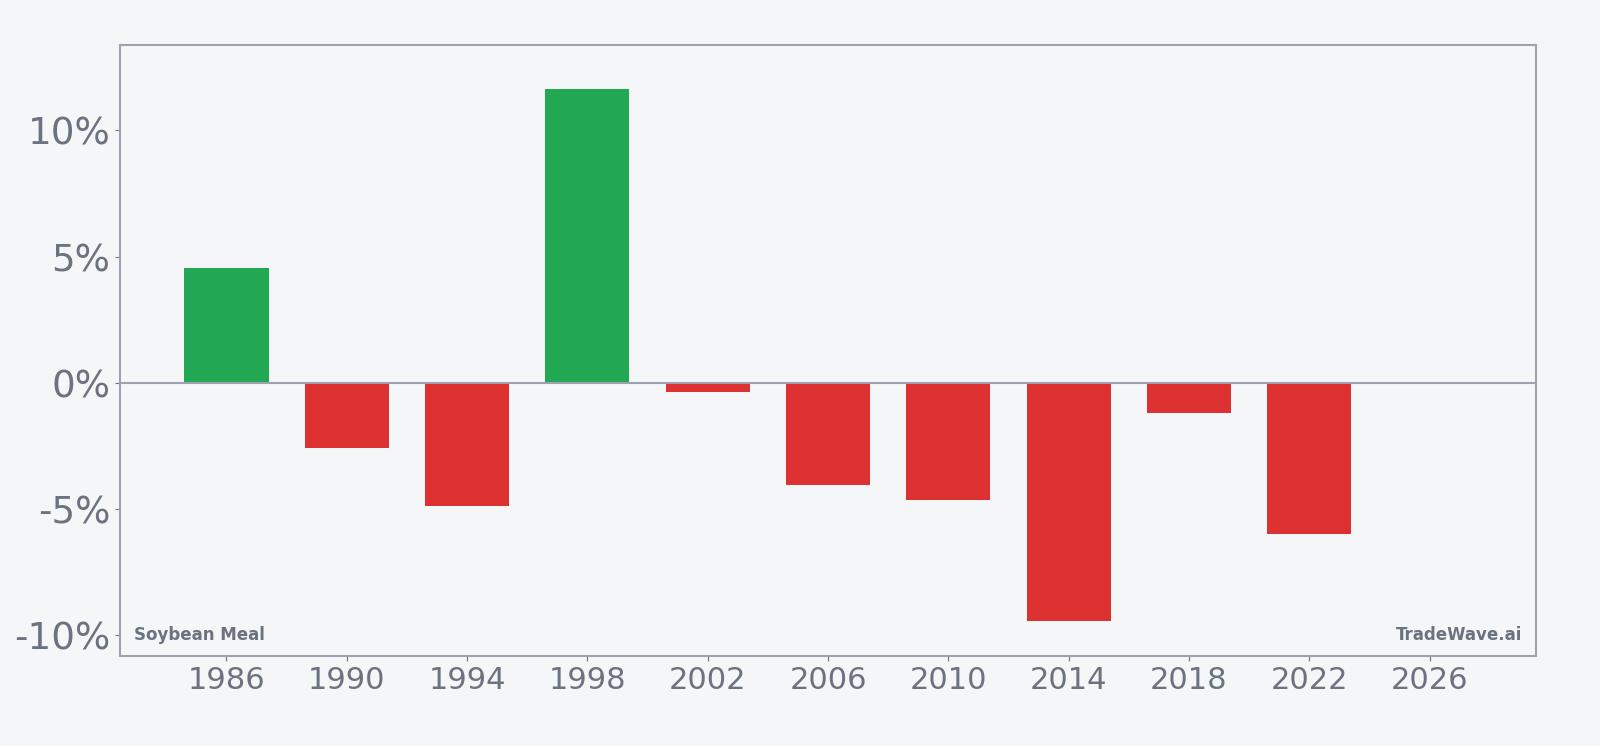
Grouping the data by the presidential election cycle matters here because this pattern only looks at the last 10 midterm election years, a phase that often brings shifting farm policy debates and trade negotiations that can jolt agricultural commodities. Pattern phase and calendar phase are aligned in 2026, which means the upcoming window is directly comparable to prior midterm-year episodes rather than being diluted by other parts of the four-year cycle.
For this short-side setup, an 80% Percent Profitable reading with 8 winners and 2 losers is a strong record for such a tight 11-day Soybean Meal trading window. The 4.14% Avg Profit in winning years shows that when the pattern works, prices have tended to slide meaningfully in a short span, while the 2% Avg Profit - All confirms that the losers have been large enough to drag down the all-years average. The -8.09% Avg Loss in losing years underlines that short squeezes in this window have not been gentle when they appear.
Looking at individual years, 1998 stands out as a powerful short winner, with Soybean Meal dropping 11.64% from entry to exit while the best intraperiod move in the trade direction reached 15.86% before a modest bounce. On the other side of the ledger, 2014 was a painful year for shorts, with a 9.42% net loss as prices rallied against the trade and the worst intraperiod drawdown reached -10.75% from the entry level. Those bookends frame the risk-reward profile that this July seasonal pattern has carried into the current cycle.
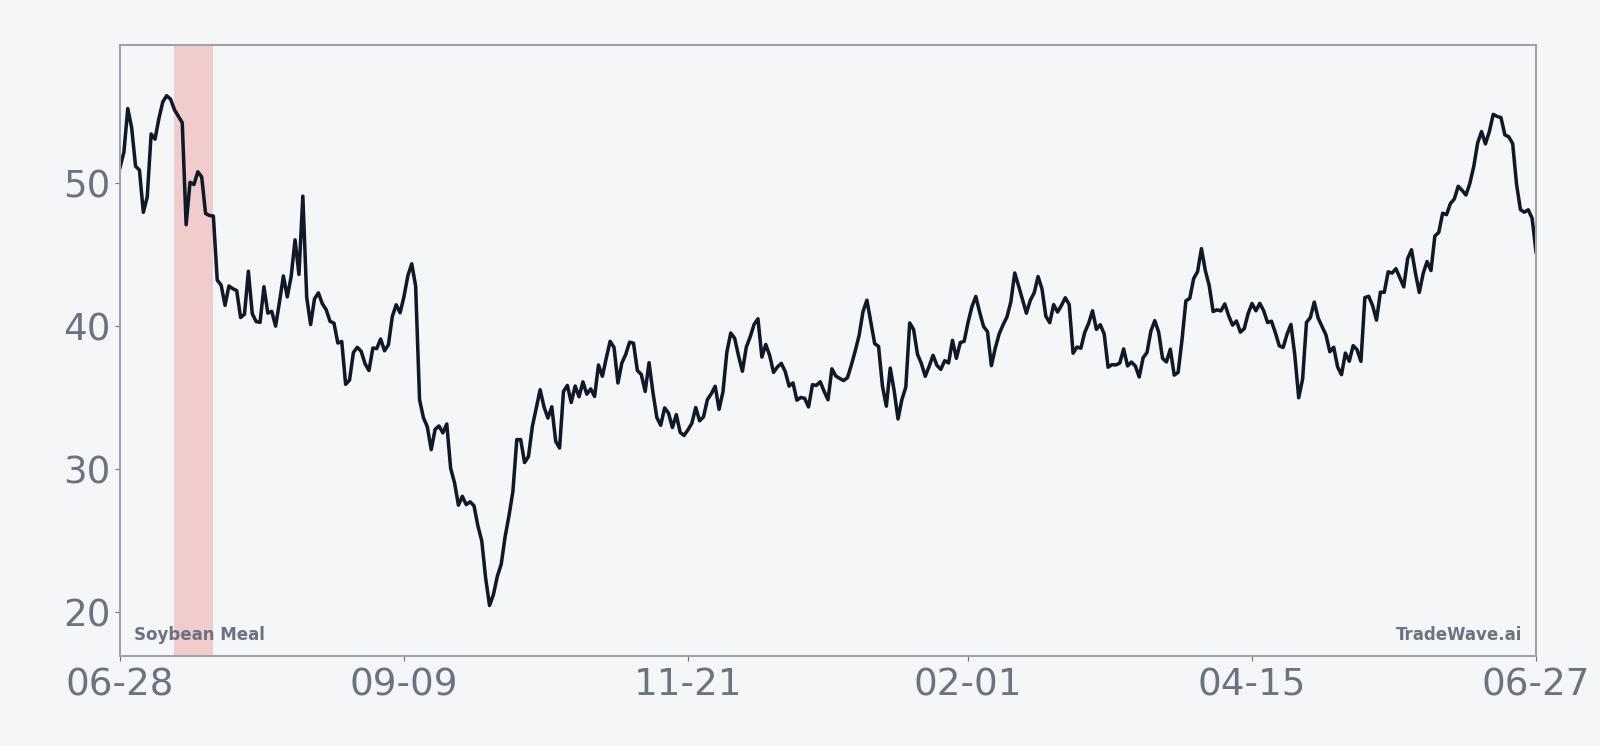
The historical seasonal average trend for this window tilts lower, with most of the downside clustering in the middle of the 11-day span rather than at the open or close. That suggests that in many years, shorts have seen the trade move their way after a brief period of noise, with the bulk of the favorable move accruing once the window is underway rather than on day one.
The combined net, peak favorable move and worst drawdown by year show how much room Soybean Meal has given both shorts and longs inside this window.
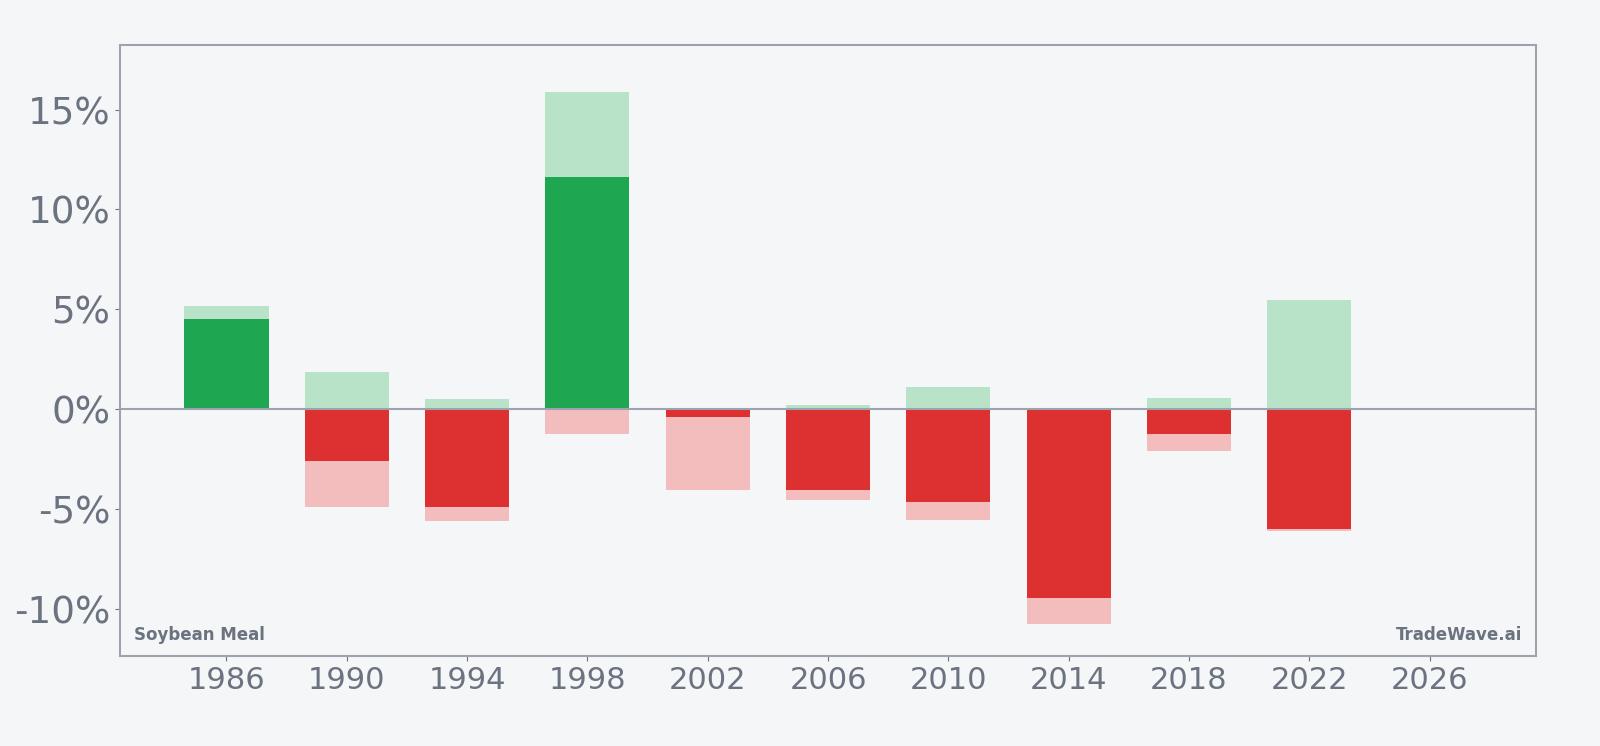
The stacked net, maximum favorable excursion and maximum adverse excursion bars highlight a key point for this Soybean Meal seasonal pattern: even in winning short years, the contract has often swung several percentage points against the trade before resolving lower. Large positive MFE readings alongside sizable negative MAE values show that this is a high-variance window where both sharp selloffs and violent countertrend rallies have occurred within the same 11-day stretch.
History does not guarantee future results; adverse excursions (MAE) can be large even in winning windows.
Why does Soybean Meal (ZM) follow this seasonal pattern?
This mid-July window likely reflects a mix of commodity supply and demand seasonality and positioning around the U.S. growing season. One likely driver is how crushers, exporters and feed buyers adjust hedges as crop conditions and export programs for the new marketing year become clearer, which can trigger short-term repricing in soybean meal. Analysts also point to shifting trade flows between the United States and Brazil, along with evolving export demand from key buyers such as the Philippines, as factors that can amplify mid-summer volatility in this contract.
What is driving Soybean Meal (ZM) today?
Soybean Meal futures settled at 304.3 in the prior session, up 0.7 points or 0.23% on light volume of 748 contracts, leaving the contract about 11.2% below its 52-week high of 342.7 and roughly 14.2% above its 52-week low of 266.5. The front month is trading below its 50-day simple moving average of 318.898 after a one-month slide of 7.94%, a pullback that has eased some of the pressure on livestock feeders but tightened margins for crushers that had benefited from earlier strength.
Macro drivers around this move remain rooted in the broader agricultural commodities and crush dynamics backdrop. Soybean meal is produced by crushing soybeans into meal and oil, so the balance between domestic crushing and exports directly shapes meal availability and pricing for feed users. U.S. soybean meal exports are expected to reach a record share of domestic production in the 2024/2025 crop year, with roughly 30% of output, or 17.4 million short tons, projected to move overseas, and the Philippines standing out as a primary buyer as Brazil’s rise as a soybean supplier to China continues to reshape trade flows.[1]
Those shifting flows mean that even modest price moves in Soybean Meal can ripple into feed costs in Asia and crush margins in North and South America. With the contract sitting between its 52-week extremes and below its 50-day average, traders are watching whether export demand and domestic crush rates tighten the market into the upcoming seasonal window or leave it better supplied than in prior midterm election years.
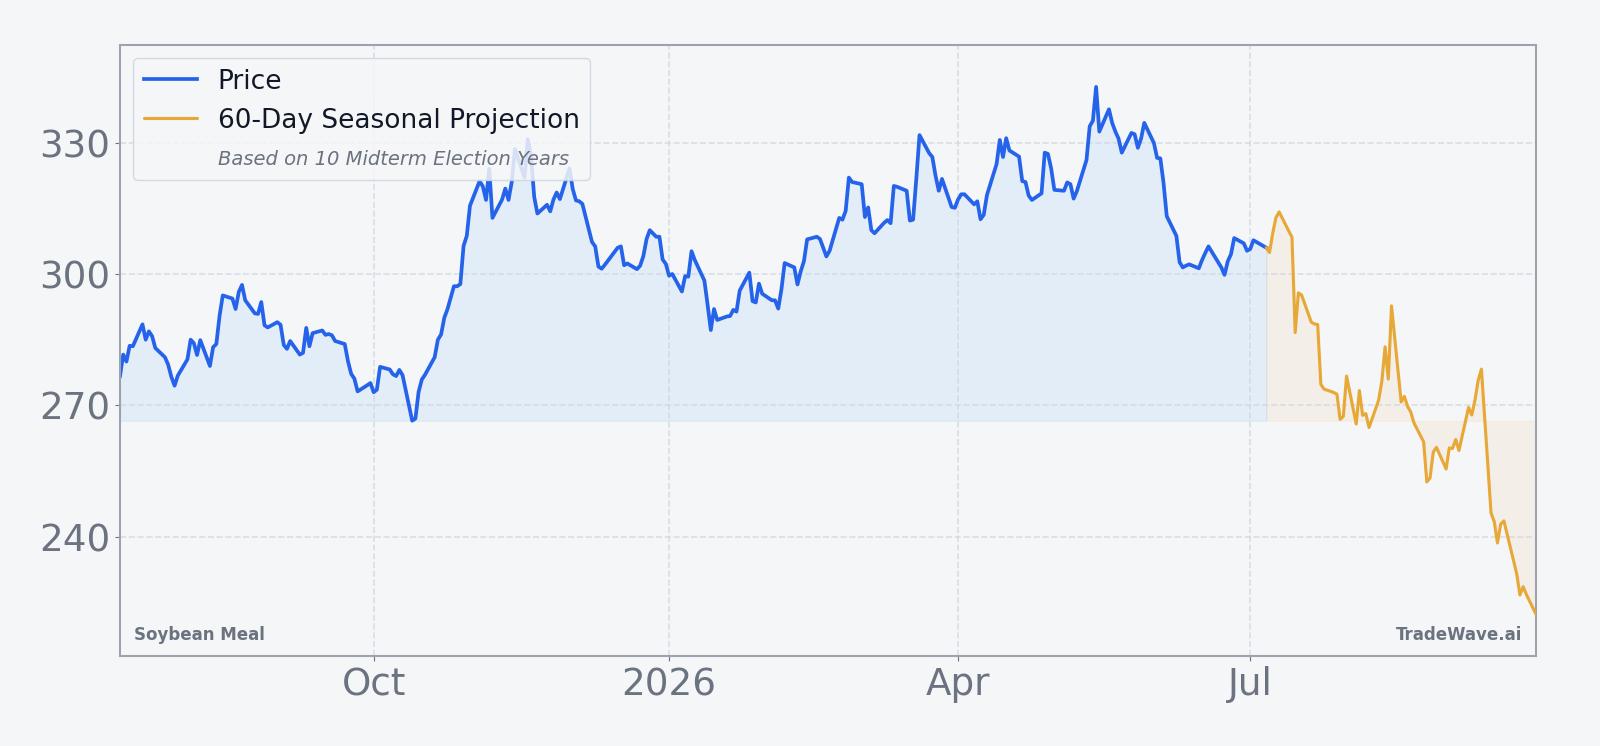
The chart below situates the latest pullback and current range against the past year of trading and a 60-day seasonal projection.
What should traders watch as this Soybean Meal seasonal window approaches?
First, the calendar. The 11-day midterm-year July window starting on Jul 12 sits squarely in the mid part of the midterm election year, just months before the transition into the pre-election year, a phase that has often brought a different risk tone across commodities and broader markets. How Soybean Meal behaves inside this window will help traders gauge whether the current pullback is a pause in a larger uptrend or the start of a deeper reset in feed costs.
Second, levels. On the downside, the 266.5 area that marks the 52-week low is the obvious stress point for feed buyers, while on the upside, the 50-day moving average near 318.9 and the 342.7 52-week high define the band where short squeezes in past losing years have inflicted the most pain on this seasonal short pattern. Price action around those levels during the 11-day window will show whether the historical short-side bias is asserting itself or being overwhelmed by fresh fundamental news.
Third, fundamentals. Export sales reports, crush data and any signs that U.S. soybean meal exports are tracking ahead of the projected record share of production will matter for this specific window, especially given the role of buyers such as the Philippines and the ongoing competition from Brazilian supplies into China.[1] Stronger-than-expected export pull could tighten the market and make it harder for the usual mid-July soft patch to develop, while softer demand would align more cleanly with the historical pattern.
Finally, volatility. The historical record shows that even winning short years have seen sizable adverse moves before resolving lower, so intraday and intra-window swings will be as important as the final outcome. If Soybean Meal starts the window with sharp rallies that quickly fade and reassert the downtrend, that would fit the typical pattern of noise followed by a mid-window slide. If instead the contract breaks above the 50-day average and holds those gains through the end of the window, it would look more like a 2014-style squeeze year where the seasonal short setup struggled.
Sources
About this seasonal analysis
Seasonal pattern data is sourced from TradeWave.ai, which analyzes historical price behavior across annual calendar windows going back up to 30 years. Read the full data methodology or the book The 100-Year Pattern by Afshin Moshrefi (2026 edition). Past performance of seasonal patterns does not guarantee future results. This article is for informational purposes only and does not constitute investment advice.