Lean Hogs (HE) Has Dropped in All 10 Midterm Summers, With Shorts Averaging 20.98% Gains
Lean Hogs futures are trading near the top of their 12‑month range just as a midterm-year summer seasonal window that has never favored the long side approaches.
Price as of Jun 29, 2026: $97.28 (last close).
What is the seasonal pattern for Lean Hogs (HE)?
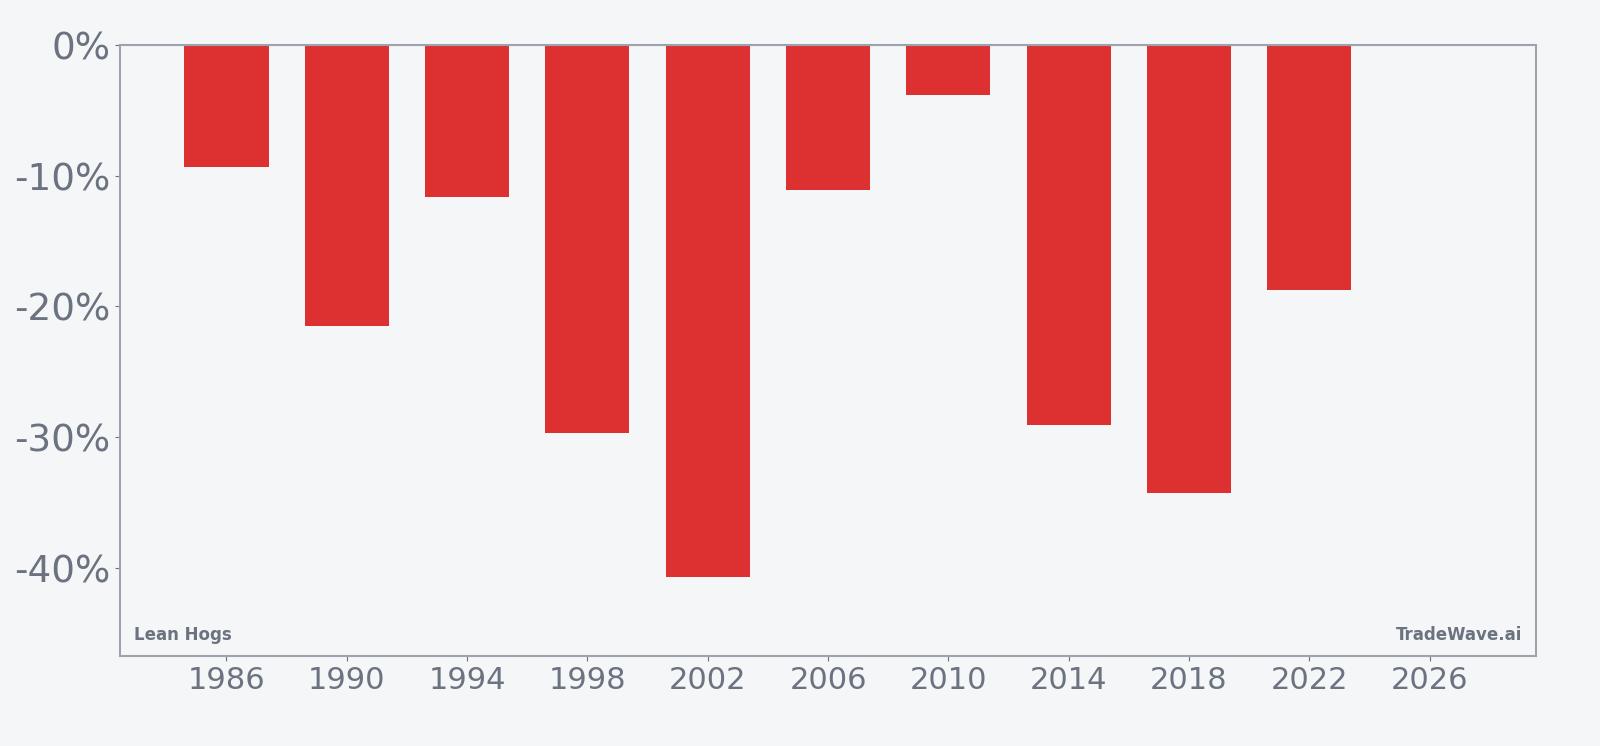
Lean Hogs has fallen in 10 of 10 midterm-year summer windows during this 52-day pattern, with an average gain of 20.98% in winning years for short positions.
- 10 for 10 in this window, with short trades averaging 20.98% gains in winning years across the last 10 midterm election cycles.
- The upcoming 52-day Lean Hogs trading window begins Jul 5, 2026 and has historically favored downside moves for prices.
- Percent Profitable is 100%, with 10 winners and 0 losers for the short-side seasonal pattern.
- Average profit per winning year is 20.98%, with a cumulative return of 542% across all 10 historical windows.
- The TradeWave Ratio of 1.83 signals that price has typically traveled meaningfully in the trade direction within the window, while intraperiod drawdowns have still been sizable.
- A Sharpe ratio of 1.68 for this pattern points to strong risk-adjusted results for shorts in prior midterm-year summers.
According to historical data from TradeWave.ai, this specific midterm-year summer stretch in Lean Hogs has behaved very differently from an average month on the calendar, and the next iteration is just days away.
How has Lean Hogs (HE) traded in past midterm-year summer windows?
Lean Hogs has fallen in every one of the last 10 midterm election years during this 52-day summer window, with short positions averaging 20.98% gains. The next iteration begins on Jul 5, 2026, with futures recently settling at 97.275, near the upper end of a 12‑month band that runs from 77.35 to 110.025. That combination of elevated prices and a historically bearish Lean Hogs seasonal pattern is why this window is on many commodity desks’ radar.
Grouping the data by the presidential election cycle matters here because midterm years often bring shifting farm policy debates, budget wrangling and trade headlines that can hit livestock demand and feed costs at the same time. This Lean Hogs seasonal pattern is built specifically on the last 10 midterm election years, so it reflects how the contract has behaved in that policy backdrop rather than in a generic average year.
The trade direction for this window is short, and the track record is unusually clean. Percent Profitable is 100%, with 10 winners and 0 losers, and the cumulative return across those shorts is 542%. Average profit per year is 20.98%, while the median outcome is close at 20.12%, which tells you the distribution has been consistently skewed toward sizable declines rather than a few outliers doing all the work.
The per-year table shows how broad that weakness has been. The mildest year in the sample was 2010, when a short in this window would have captured a 3.81% decline from entry to exit, while the strongest year was 2002, when prices dropped 40.67% over the 52 days. Several other cycles, including 1998, 2014 and 2018, saw net returns between roughly 29% and 34% for shorts, underscoring how often this Lean Hogs trading window has lined up with heavy selling pressure.
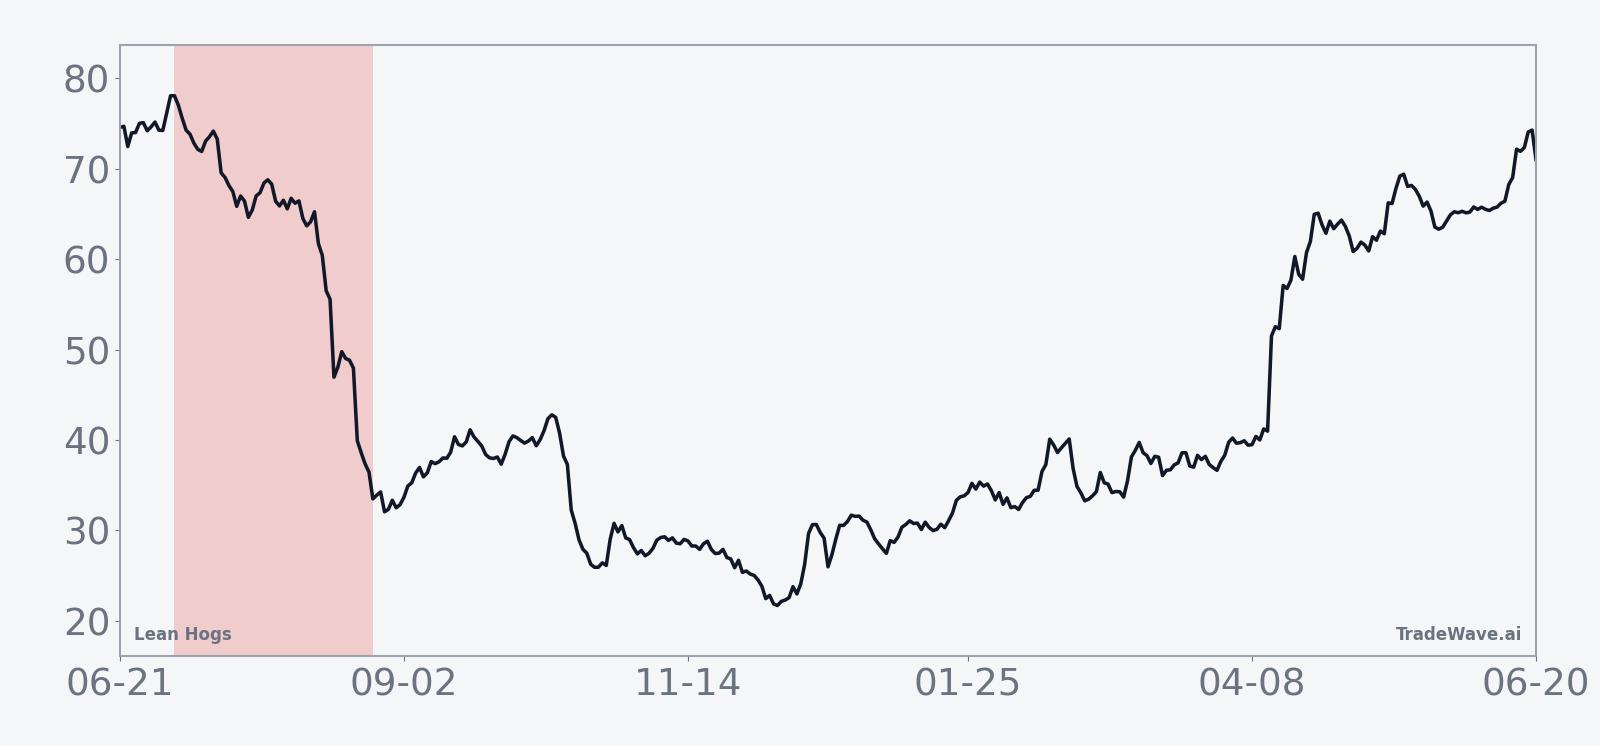
The historical seasonal trend chart shows that prices have typically started to roll over early in the window and then accelerated lower into the back half. There are brief pauses and countertrend bounces, but the average path is a steady grind down rather than a single crash day, which fits with the idea of demand softening and supply staying firm through mid to late summer.
Year-by-year bars that include both peak moves and worst drawdowns help frame how far Lean Hogs has tended to swing inside this window.
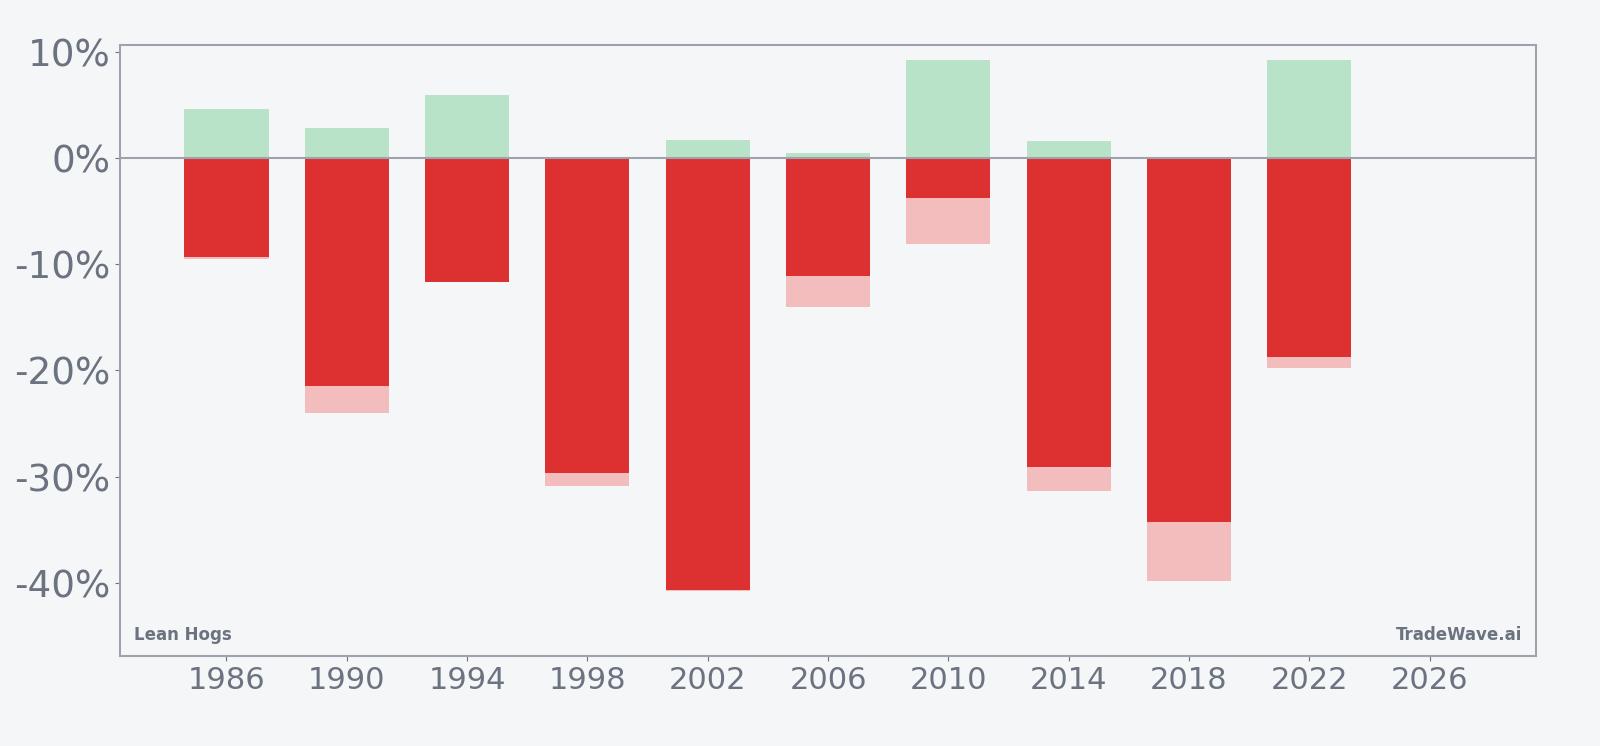
The combined net, maximum favorable excursion and maximum adverse excursion bars show that even in winning years for shorts, Lean Hogs has often seen sharp intraperiod swings. In 2010 and 2022, for example, the best point-to-peak move against the short reached around 9% before prices ultimately rolled over, while in heavy years like 2002 and 2018 the worst drawdown from entry ran close to the final net decline, signaling relatively one-way selling. The TradeWave Ratio of 1.83 captures this tendency for price to travel meaningfully in the trade direction within the window, even when there are countertrend rallies along the way.
History does not guarantee future results; adverse excursions can still be large inside this window even when the final outcome has favored shorts in prior years.
Why does Lean Hogs (HE) follow this seasonal pattern?
This midterm-year summer pattern in Lean Hogs likely reflects commodity supply and demand seasonality layered on top of the policy calendar. One likely driver is that hog supplies and slaughter schedules tend to build through midyear just as grilling demand starts to fade and retailers finish early-summer promotions, which can pressure prices. Analysts also point to midterm-year uncertainty around trade policy and farm support programs, which may encourage hedging and risk reduction in livestock markets during this stretch.
What is driving Lean Hogs (HE) today?
Lean Hogs futures most recently settled at 97.275, with the prior session’s close leaving the contract roughly in the upper third of its 52‑week range between 77.35 and 110.025. One-month performance sits at 1.49%, and the front-month is trading above its 50-day moving average of 94.372 on moderate volume of 23,375 contracts, compared with a 20-day average of 11,351.45. That backdrop suggests a market that has firmed into early summer but is not in a runaway squeeze, which makes the upcoming historical seasonality window particularly relevant for traders watching for a shift in tone.
The chart below situates the latest move in its recent multi-month context and overlays the next 60 days of seasonal projection.
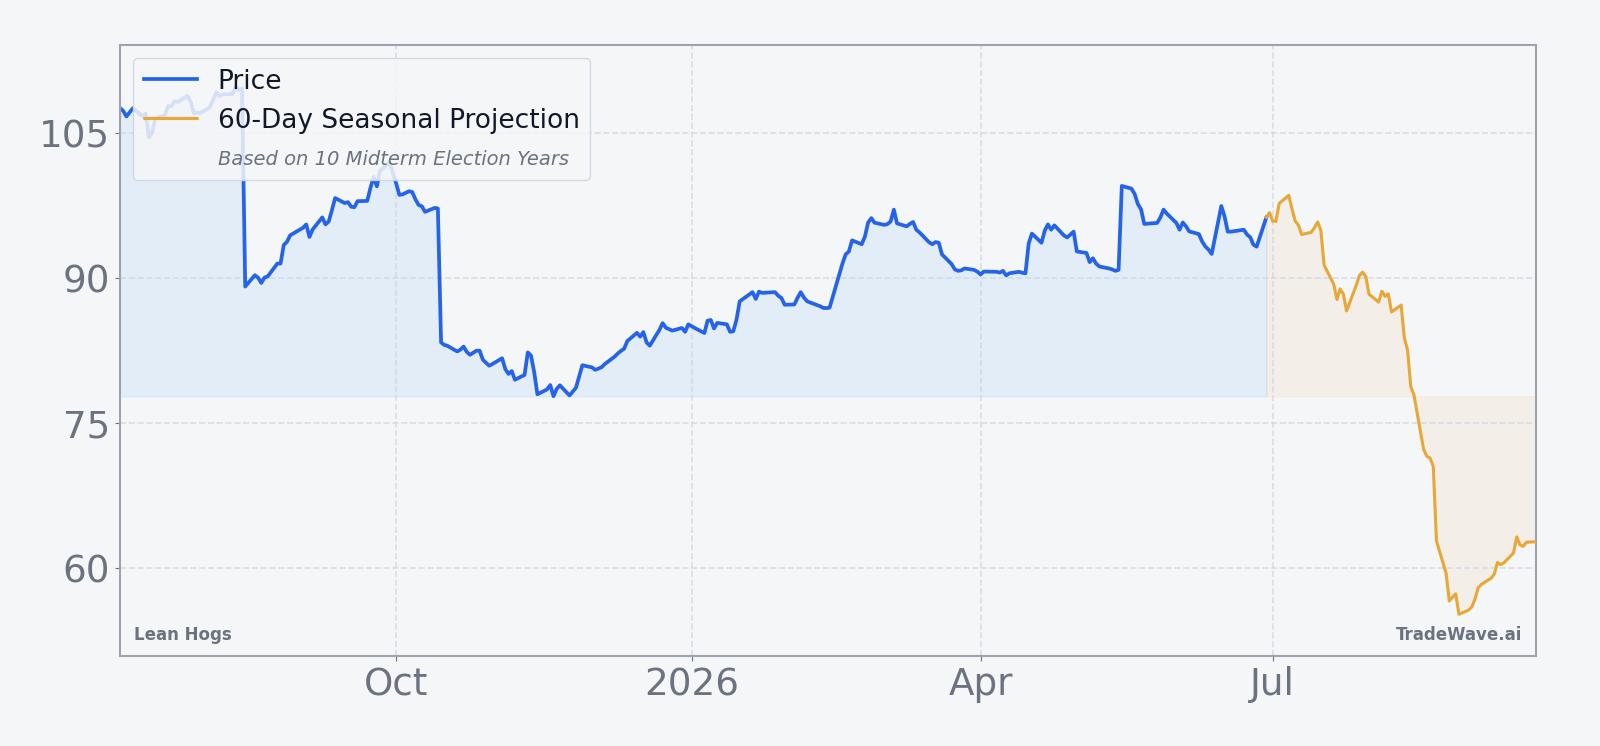
Lean Hogs is an important reference point for protein inflation and producer margins, so a historically weak summer window can ripple into packer equities and broader food inflation expectations. If prices start to roll over as the Jul 5 window opens, traders will be watching whether the move tracks the historical seasonal pattern or whether strong domestic demand and export flows keep the contract supported instead. Either way, the combination of elevated prices, above-average recent volume and a 10-for-10 bearish seasonal record means this is a calendar stretch that livestock desks are unlikely to ignore.
What should traders watch as this Lean Hogs seasonal window opens?
Three things stand out for this year’s iteration of the Lean Hogs seasonal pattern. First, watch how price behaves around the 50-day moving average near 94.372 and the recent high zone just below 100; a decisive break lower early in the window would be consistent with the historical tendency for weakness to build quickly. Second, monitor intraday volatility and depth of order books, since prior years show that maximum adverse excursions against shorts can reach high single digits before the prevailing downtrend reasserts itself. Third, keep an eye on policy and trade headlines that could alter demand expectations, because a sustained bid through the upper end of the 12‑month range would contradict the historical pattern and signal that this midterm-year summer may be different.
Sources
About this seasonal analysis
Seasonal pattern data is sourced from TradeWave.ai, which analyzes historical price behavior across annual calendar windows going back up to 30 years. Read the full data methodology or the book The 100-Year Pattern by Afshin Moshrefi (2026 edition). Past performance of seasonal patterns does not guarantee future results. This article is for informational purposes only and does not constitute investment advice.