8-for-8 Midterm Run: Amphenol (APH) Enters 273-Day Window Averaging 22.25% Gains
Amphenol is hovering just below its 52-week high as it heads toward a long midterm-election seasonal window that has never been negative in the last eight cycles.
Price as of Jun 29, 2026: $166.42 (last close).

What is the seasonal pattern for Amphenol (APH)?
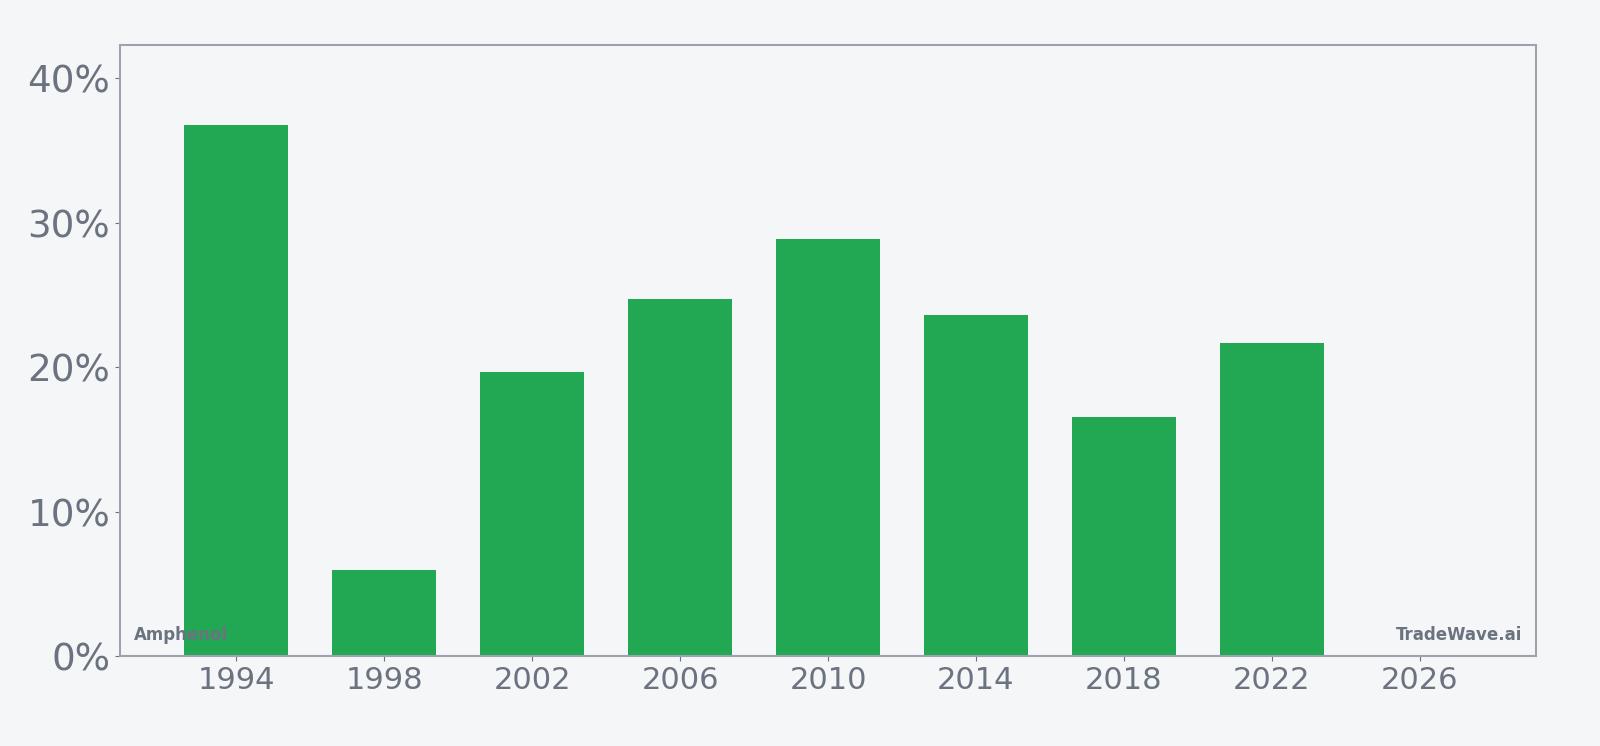
Amphenol has risen in 8 of 8 midterm-election-year windows starting around Jul 11 and lasting 273 calendar days, with an average gain of 22.25% in winning years.
- 8 for 8 in this window, averaging 22.25% gains in winning years across the last eight midterm election years.
- Seasonal window starts Jul 11, 2026 and runs for 273 calendar days, spanning the back half of the midterm year into the pre-election year.
- Percent Profitable is 100%, with 8 winners and 0 losers in the historical sample.
- Annualized return across these windows is 21.95%, with a Sharpe ratio of 2.14 based on end-of-window outcomes.
- TradeWave Ratio (TWR) of 2.29 indicates that price has typically traveled meaningfully in the long direction within the window.
- Individual years have seen maximum favorable moves as high as 52.79% and adverse excursions as deep as -28.47%, underscoring real volatility inside an otherwise strong pattern.
According to historical data from TradeWave.ai, Amphenol’s behavior in midterm election years has followed a distinct long-duration seasonal path that differs from its average year-round performance.
How strong is Amphenol’s (APH) midterm-year seasonal window starting in July?
Amphenol has posted gains in every one of the last eight midterm-election-year windows that begin in mid-July and run for 273 calendar days, averaging 22.25% per cycle. Shares finished Monday at 166.42, up 1.6% on the day and about 1.4% below their 52-week high of 168.75. That combination of a clean win streak, double-digit average gains and a stock already pressing record territory makes this upcoming Amphenol trading window hard for seasonal investors to ignore.
The presidential election cycle matters here because this pattern is built only from midterm election years, a phase that often features policy uncertainty early in the year followed by a more supportive backdrop as Washington gridlock firms up and the market starts to discount the coming pre-election year. In this case, the Amphenol seasonal trend captures that late-midterm to pre-election stretch, which has historically been one of the friendliest parts of the calendar for risk assets.
This seasonal window begins on Jul 11, 2026 and spans 273 calendar days. Historically, during this period, Amphenol has shown a strong bullish tendency in midterm election years, with all eight cycles finishing higher and a cumulative return of 389% across the sample. The trade direction is explicitly long, and the pattern’s 21.95% annualized return and 2.14 Sharpe ratio point to a historically favorable risk-adjusted profile for holding the stock through this regime.
Average profit of 22.25% reflects the mean gain across those eight winning windows, while the median outcome of 22.67% shows that results have clustered around the low-20s rather than being driven by a single outlier year. The strongest historical run came in 1994, when the stock gained 36.8% in the window, while the softest was 1998 with a still-positive 5.97% advance. Add it up: eight midterm-election cycles, eight green outcomes, and no losing years in this specific Amphenol trading window.
Intraperiod swings have been meaningful. Maximum favorable excursions, or the best point-to-peak moves within each window, have ranged from 17.22% in 1998 to 52.79% in 1994, showing that when Amphenol has trended higher in this regime it has often done so with sizable upside bursts. On the downside, maximum adverse excursions, the worst drawdowns from entry, have stretched as far as -28.47% in 1998, with several other years seeing temporary pullbacks in the mid-teens before recovering into positive territory by the end of the window.
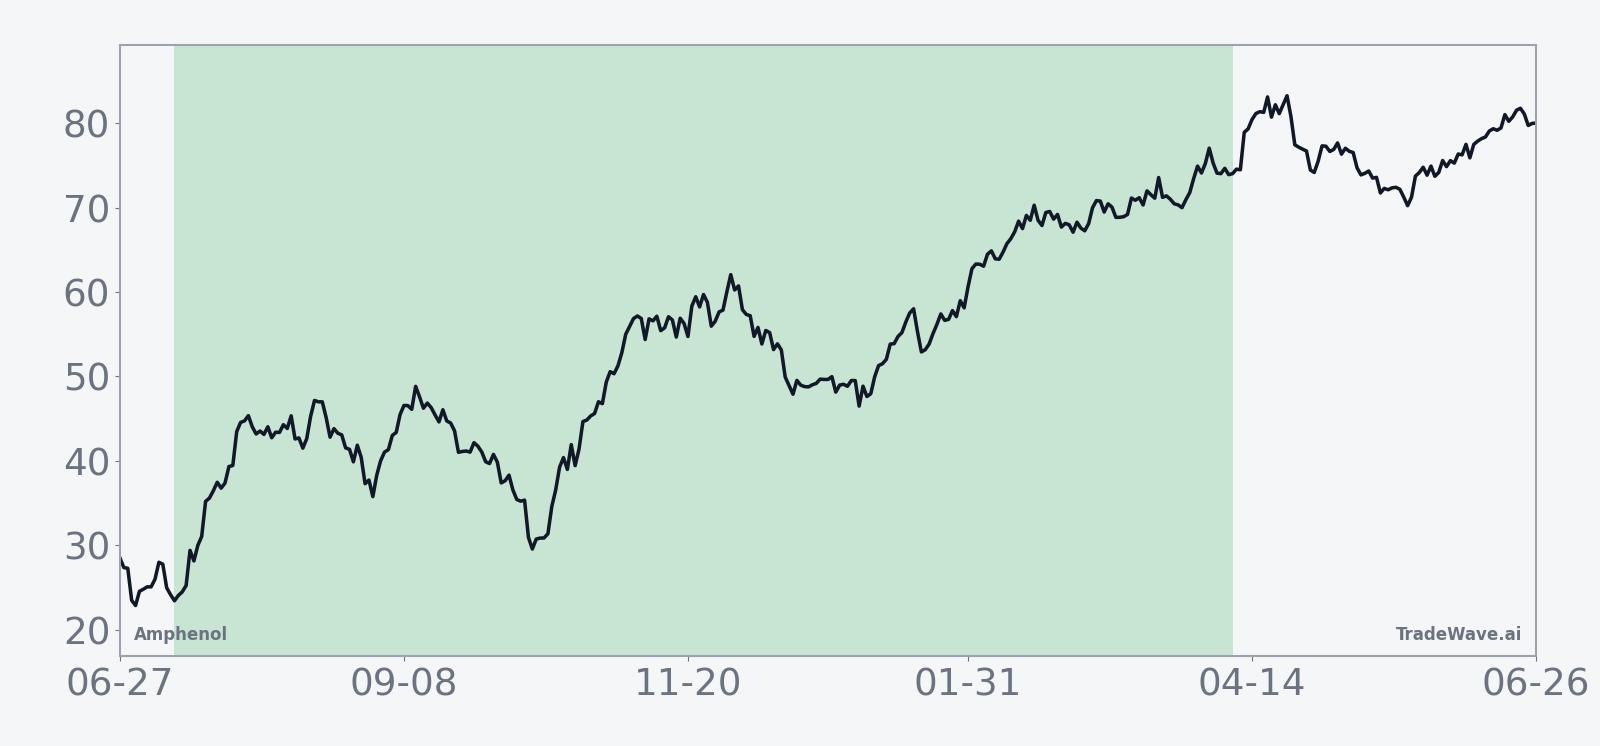
The historical seasonal trend line slopes steadily higher across most of the 273 days, with only modest flat spots, which suggests that gains have tended to accrue over time rather than arriving in a single short burst. Early in the window, the pattern shows a firming bias, then a stronger climb as the calendar moves deeper into the pre-election year, consistent with the broader equity tendency to perform well in that phase of the presidential cycle.
Year-by-year bars that combine net results with peak run-ups and worst drawdowns show how consistently positive outcomes have coexisted with real downside volatility.
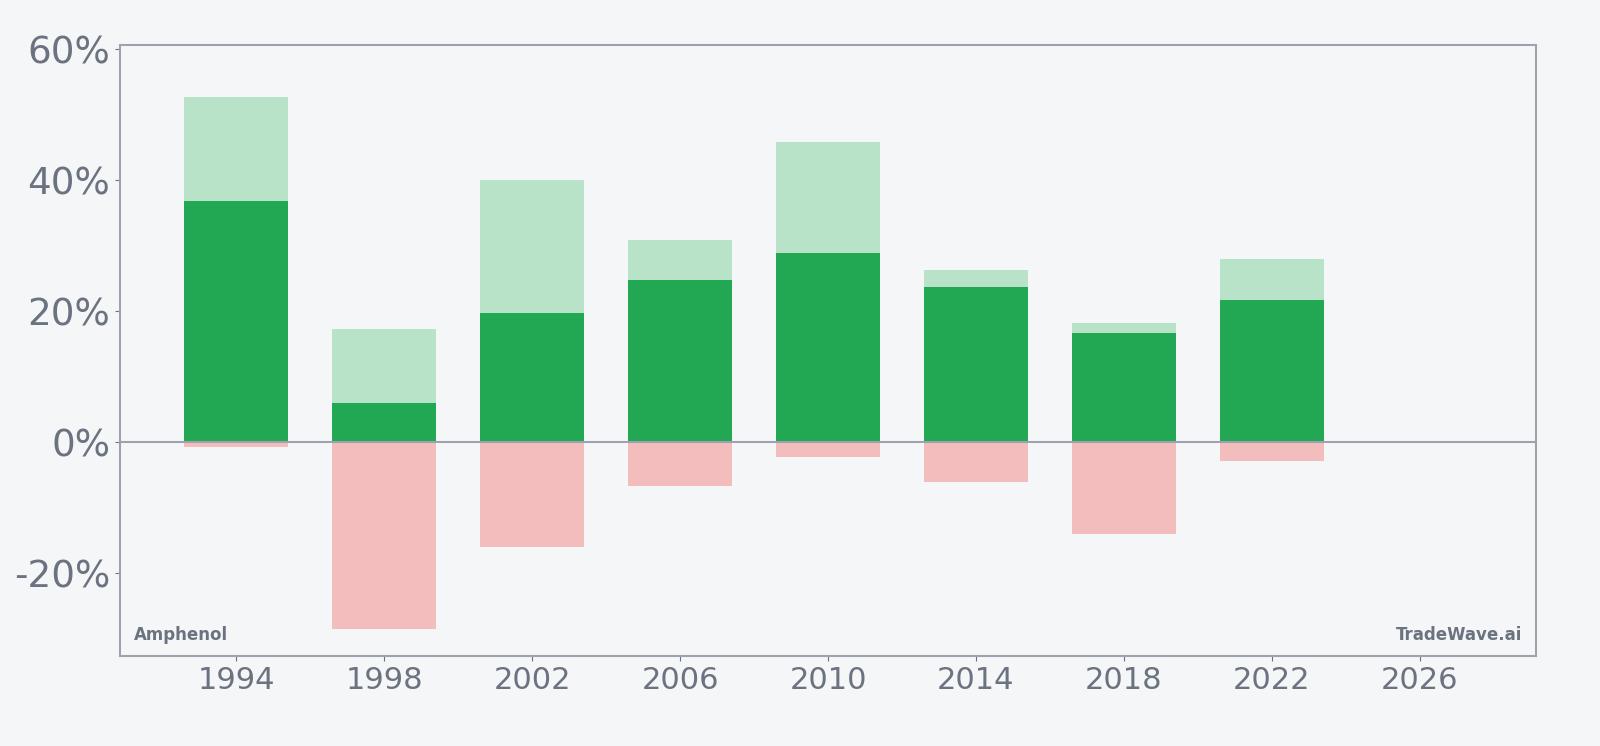
The combined net, maximum favorable and maximum adverse bars make the trade-off clear: every year finished in the green, but several paths included double-digit drawdowns before recovering, while others delivered large upside spikes with relatively shallow pullbacks. For a long-only seasonal strategy, that mix has historically rewarded patience, yet it also underlines that this is a high-variance window where timing and risk tolerance matter.
History does not guarantee future results; even in windows where every past outcome was positive, adverse excursions can be large before any recovery takes hold.
Why does Amphenol (APH) follow this seasonal pattern?
One likely driver is the clustering of Amphenol’s earnings and capital spending decisions with the broader tech and industrial complex, which often sees stronger order visibility and budget clarity in the back half of midterm years and into the pre-election year. Analysts have also pointed to institutional portfolio repositioning around the presidential cycle, with investors adding to structural growth names like Amphenol as policy risk recedes and fiscal and regulatory paths look more predictable.[1] For a company tied to communications, broadband and defense interconnects, that backdrop can translate into steadier demand expectations and a willingness by large holders to lean into the stock during this part of the calendar.[2]
What is driving Amphenol (APH) today?
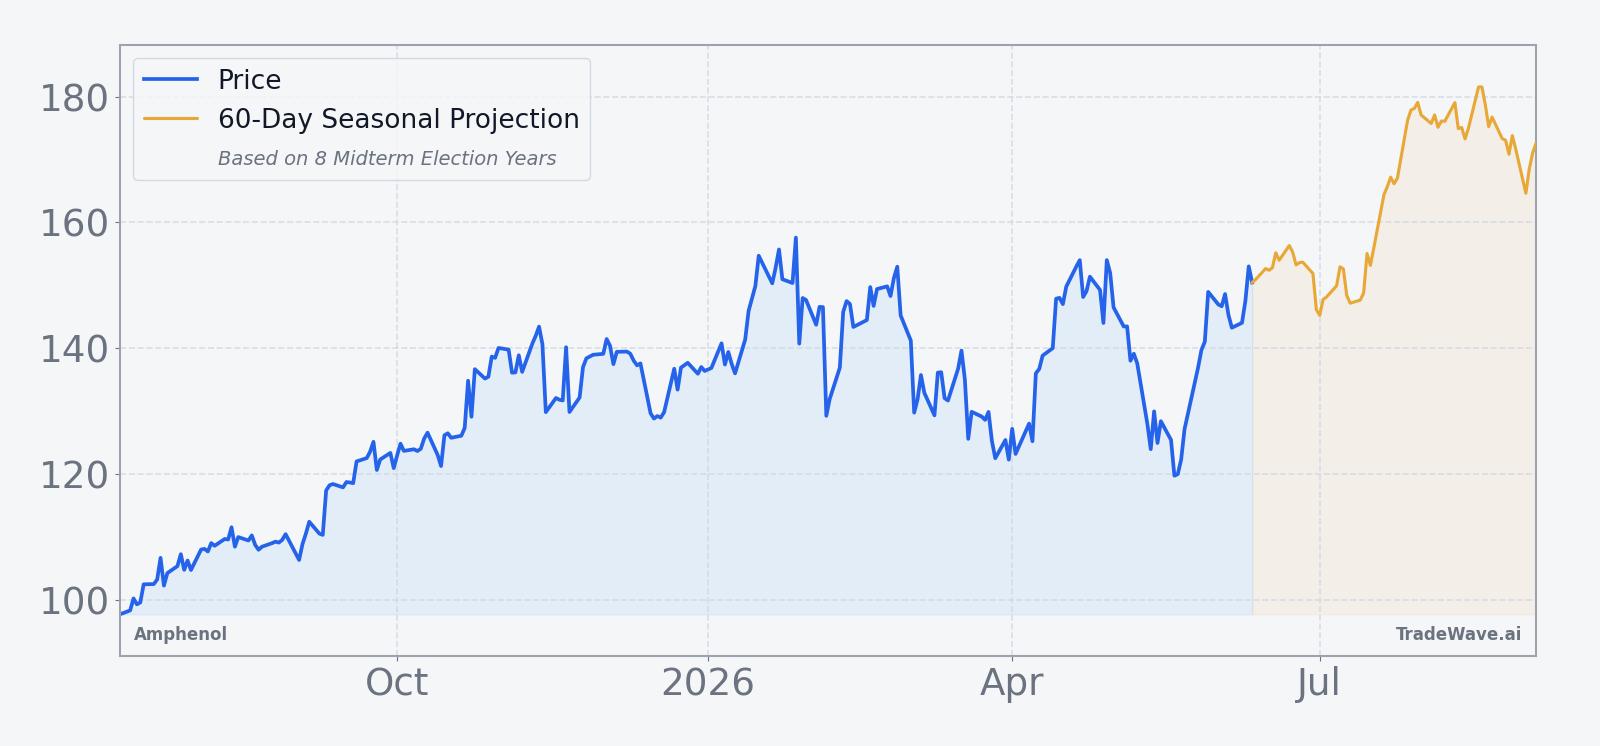
Amphenol closed at 166.42 on Jun 30, up 2.7 points or 1.6% on the day, with roughly 6.2 million shares changing hands against a 20-day average volume of about 9.5 million. The stock has climbed 12.21% over the past month and sits just 1.4% below its 52-week high of 168.75, far above its 52-week low near 93.91, underscoring how strong the recent uptrend has been. The 50-day moving average around 144.57 shows how extended the move is relative to its intermediate trend, reflecting investors’ enthusiasm for Amphenol’s role in AI-related connectivity and its expanding footprint in broadband and defense interconnects.[1][2]
The chart below situates the latest move in its recent multi-month context, alongside a short-term seasonal projection.
In August 2025, reports surfaced that Amphenol was in late-stage talks to acquire CommScope’s broadband connectivity and cable unit for about $10.5 billion including debt, a deal that would significantly expand its broadband and fiber footprint and add another leg to its inorganic growth story.[2] Later that month, the company agreed to buy Trexon, a defense interconnect and cable assemblies provider, for roughly $1 billion in cash, adding about $290 million of expected 2025 sales and deepening its exposure to defense and harsh-environment applications.[3] Those transactions, while dated, frame why investors have been willing to pay up for Amphenol as a diversified connectivity supplier tied to communications, broadband and defense end markets.[2][3]
In October 2025, Bank of America upgraded Amphenol to Buy and raised its price target to $150, citing expected triple-digit AI revenue growth, higher content per AI rack and a strong M&A cadence as key drivers.[1] Shares climbed more than 2% following that call, and the AI demand narrative has remained central to the stock’s appeal into 2026 as investors look for “picks and shovels” beneficiaries of data center build-outs rather than only headline chip names.[1] Against that backdrop, the approaching midterm-year seasonal window adds another layer to the Amphenol stock pattern analysis, suggesting that the calendar has historically lined up with the company’s growth story in this phase of the presidential cycle.
What should traders watch in this Amphenol (APH) seasonal window?
First, the calendar. The 273-day midterm-year window kicks off on Jul 11, 2026, so traders watching Amphenol’s seasonal trend will be focused on how the stock behaves as that date approaches and in the first few weeks after it begins. Historically, the pattern has favored staying long through the bulk of the window, but the per-year paths show that early drawdowns of 10% to nearly 30% have occurred even in ultimately positive cycles, so how the stock handles any pullbacks from near-record levels will be important.
Second, levels. With Amphenol trading just below its 52-week high, the 168.75 area is the first reference point on the upside, while the 50-day moving average near 144.57 and the prior 52-week low around 93.91 mark deeper support zones if volatility picks up. Behavior around those levels during the window will help confirm whether the historical seasonality is reasserting itself or if this cycle is breaking the pattern.
Third, catalysts. While there is no specific earnings date in view from the current dataset, Amphenol’s story is tightly linked to AI infrastructure spending, broadband build-outs and defense budgets, so any updates on large data center orders, integration of the CommScope broadband unit or Trexon, or changes in AI capex plans could either reinforce or challenge the bullish seasonal backdrop.[1][2][3] Traders will also be watching the broader policy calendar as the United States moves from the midterm election year into the pre-election year, a phase that has often coincided with more supportive liquidity and risk appetite.
Finally, confirmation. For a pattern this strong, the tell will be whether Amphenol can hold its uptrend without suffering a rare losing year in this window. If the stock consolidates near highs and resumes higher into the pre-election year, that would be consistent with the last eight cycles. A sharp and persistent break below key moving averages during the window, by contrast, would be an early sign that this midterm-year seasonal regime is behaving differently from the historical script.
Sources
- Bank of America upgrades Amphenol to Buy and raises price target to $150 (CNBC, Oct 15, 2025).
- Amphenol set to acquire CommScope unit in $10.5B deal - report (Seeking Alpha, Aug 4, 2025).
- Amphenol to Buy Trexon From Audax Private Equity for $1 Billion (The Wall Street Journal, Aug 18, 2025).
About this seasonal analysis
Seasonal pattern data is sourced from TradeWave.ai, which analyzes historical price behavior across annual calendar windows going back up to 30 years. Read the full data methodology or the book The 100-Year Pattern by Afshin Moshrefi (2026 edition). Past performance of seasonal patterns does not guarantee future results. This article is for informational purposes only and does not constitute investment advice.