Nasdaq 100 (NDX) Has Rallied in 9 of 9 Midterm Aug-Jun Windows, Averaging 22.8% Gains
Nasdaq 100 is easing after an AI-fueled melt-up just as it approaches a 298-day midterm-year seasonal window that has never finished lower in the past nine cycles.
Price as of Aug 5, 2026: $29,487.79 (last close).

What is the seasonal pattern for Nasdaq 100 (NDX)?
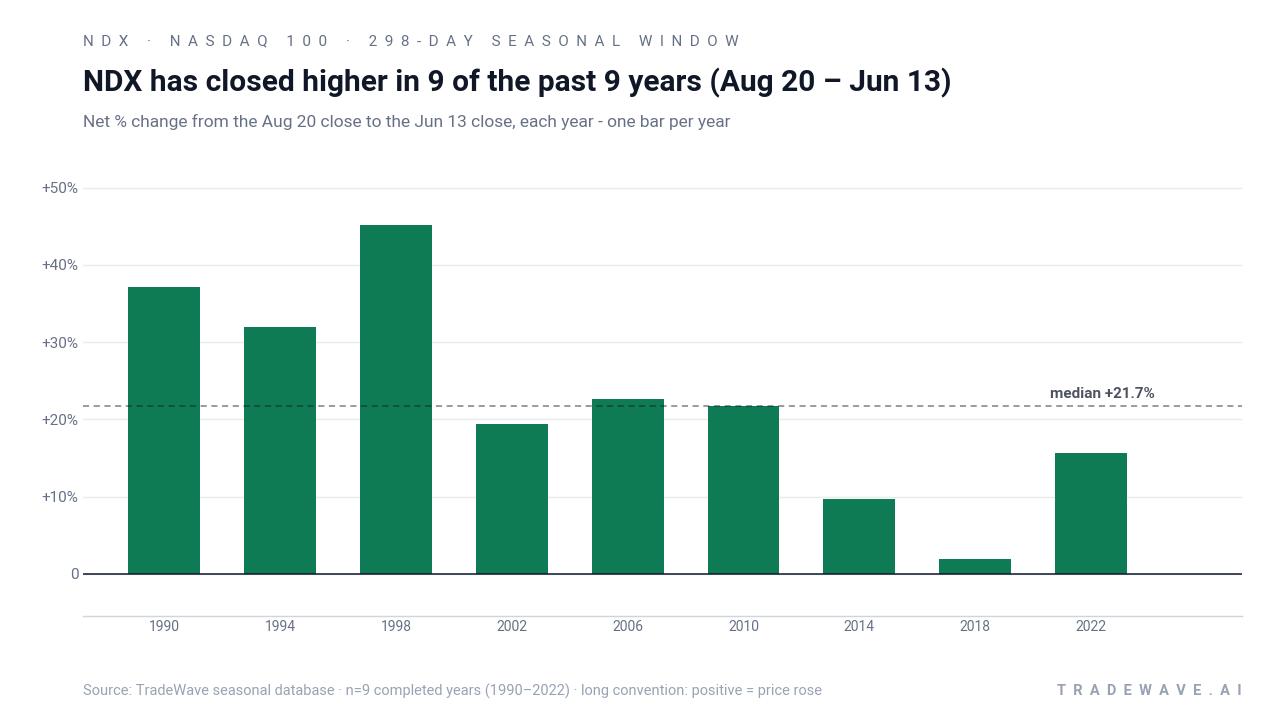
Nasdaq 100 has risen in 9 of 9 midterm-year Aug 20 to Jun 13 windows, with an average gain of 22.8% in winning years.
- 9 for 9 in this window, with Nasdaq 100 posting gains every midterm-year Aug 20 to Jun 13 stretch in the sample.
- Percent Profitable is 100%, with 9 winners and 0 losers across the last nine midterm election years.
- Average profit in winning years is 22.8%, contributing to a 504% cumulative return when the window is stacked over time.
- The trade direction is long, with a TradeWave Ratio of 1.45 and a Sharpe ratio of 1.45, pointing to strong risk-adjusted returns.
- Individual years have seen sizeable swings, with best point-to-peak rallies above 60% and worst intraperiod drawdowns near 24%.
- The upcoming 298-day Nasdaq 100 trading window begins on Aug 20 and runs through Jun 13, spanning the handoff from the midterm election year into the year before the presidential election.
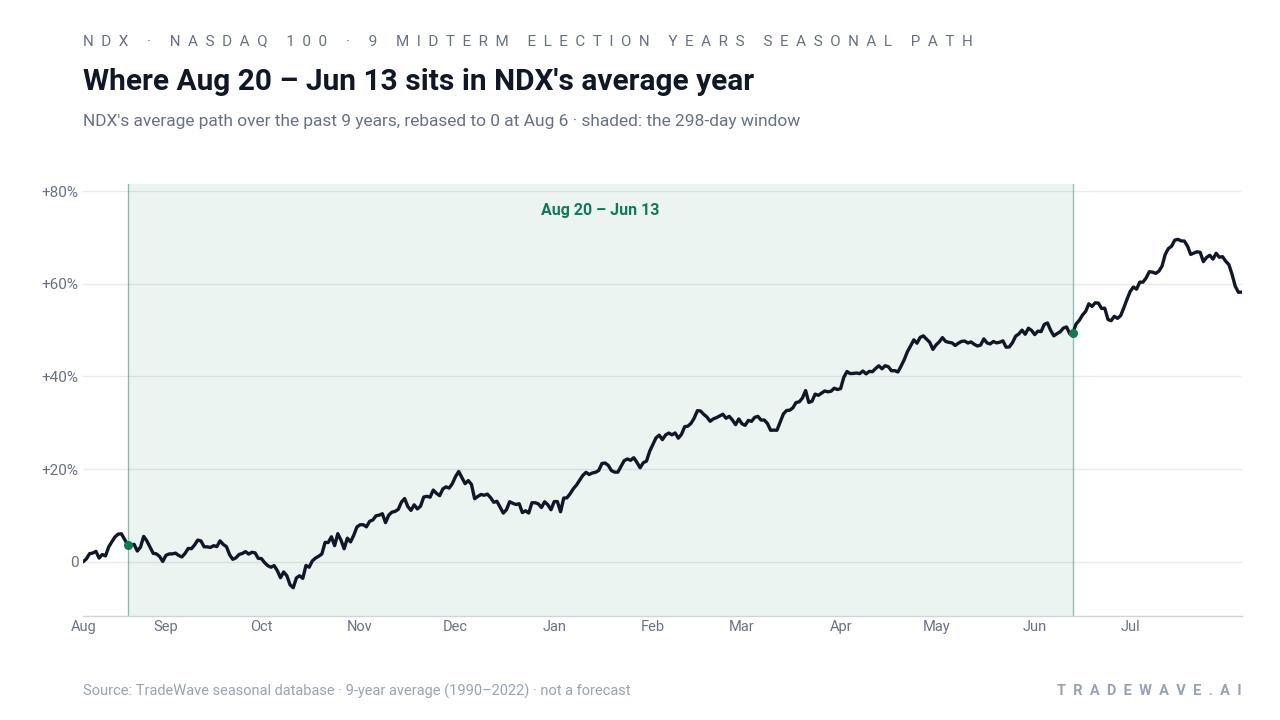
According to historical data from TradeWave.ai, this long midterm-year stretch has behaved very differently from an average calendar year for the Nasdaq 100. The next section walks through that election-cycle seasonal pattern in detail, separate from any short-term headlines.
How has Nasdaq 100 (NDX) traded in this midterm-year window?
Nasdaq 100 has finished higher in every single Aug 20 to Jun 13 midterm-year window across the last nine cycles, averaging a 22.8% gain for long exposure. Today the index closed at 29,487.79, down 0.8% on the session and sitting about 4.1% below its 52-week high of 30,762.20. That combination of a brief pullback and a historically powerful 298-day window is why this specific slice of the calendar is on traders’ radar.
The pattern is built on the last nine midterm election years, a phase where policy uncertainty, rate cycles and fiscal debates often weigh on risk assets early in the year but give way to stronger risk-on behavior as the calendar rolls toward the year before the presidential election. In this specific Nasdaq 100 trading window, that midterm-to-pre-election handoff has historically lined up with a durable uptrend rather than a choppy grind.
Across those nine cycles, every Aug 20 entry and Jun 13 exit produced a positive net return for a long position. The median gain of 21.72% sits close to the 22.8% average, which suggests the wins are not just a couple of outliers carrying the series. Add it up and stacking the window year after year would have compounded to roughly 504% over the sample.
The strongest year in the table is 1998, when the index logged a 45.11% net gain between the August entry and the June exit, with a best point-to-peak move of 63.32% before giving some of it back. On the other side of the spectrum, 2018 still finished positive at 1.89% but saw a worst intraperiod drawdown of 20.03%, a reminder that even “winning” years can feel rough in the middle.
Those intraperiod swings show up clearly in the maximum favorable move and maximum adverse move profile. In several years, the best rally from the entry point ran into the mid-20% to low-60% range, while the worst drawdowns from entry stretched into the mid-teens or low-20s. That combination points to a high-energy Nasdaq 100 seasonal trend where upside has historically dominated by the finish, but the path has not been smooth.
A second view combines yearly net results with the full intraperiod range from worst drawdown to best rally.
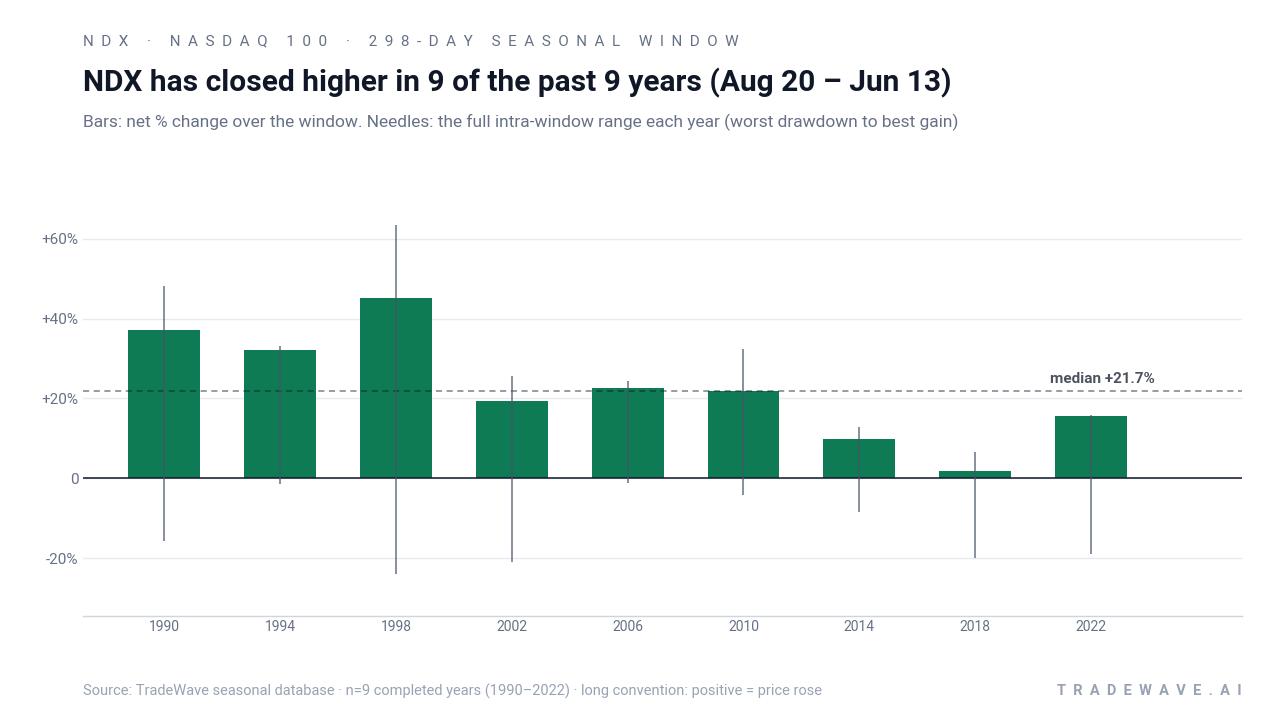
History does not guarantee future results; adverse excursions can be large even in winning windows, and past drawdowns near 20% show that timing and risk management still matter.
Why does Nasdaq 100 (NDX) follow this seasonal pattern?
One likely driver is the way the tech-heavy Nasdaq 100 lines up with the earnings and policy calendar between late summer of the midterm election year and early summer of the year before the presidential election. Analysts have pointed to a mix of post-midterm policy clarity, fiscal positioning and institutional portfolio rebalancing that often channels fresh risk appetite into growth and AI-linked names during this stretch.[9] The window also captures multiple quarterly earnings seasons and year-end positioning, which can amplify sector rotation into technology when macro conditions are supportive.[1]
What is driving Nasdaq 100 (NDX) today?
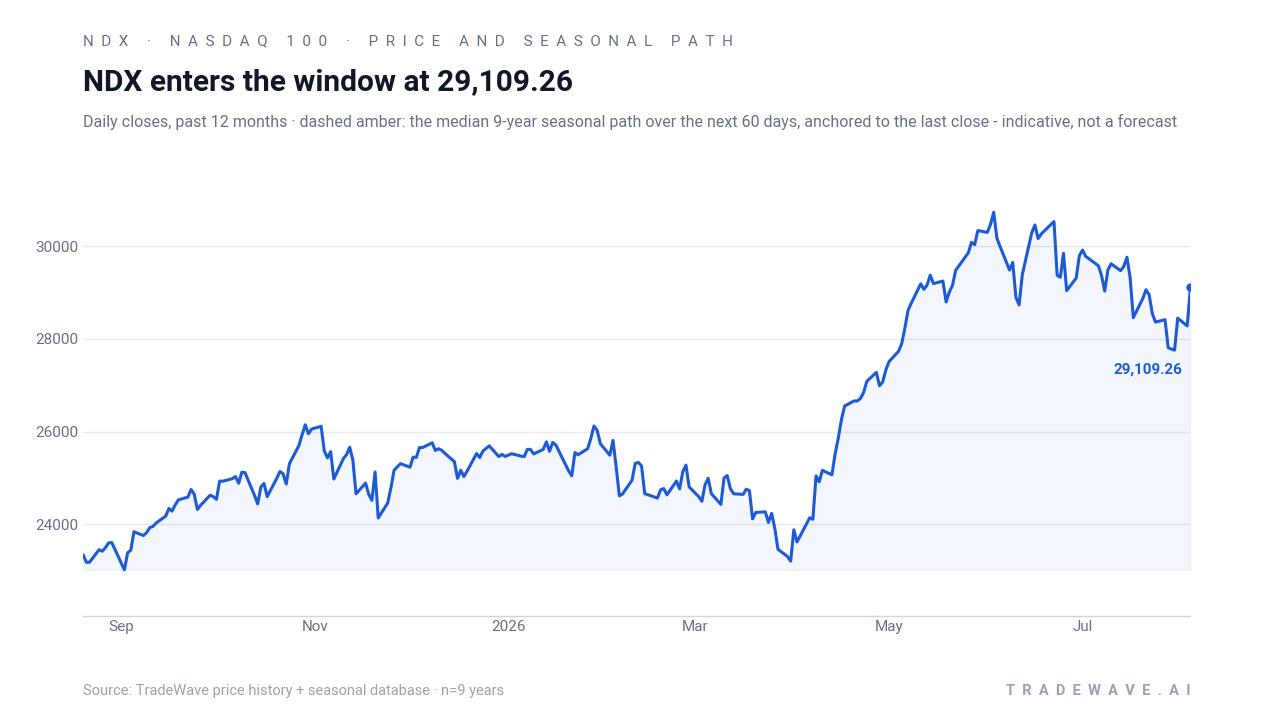
Nasdaq 100 slipped 0.8% to 29,487.79 at the prior session’s close, easing from record territory after a blistering AI-led run that added about 3.5 trillion dollars in market value over just four trading days.[1] Even after the pullback, the index is still up over the past month and sits roughly 4.1% below its 52-week high, with trading volume running above its 20-day average as investors debate whether the latest reversal is a pause or the start of something bigger.
On one side of that debate, some market watchers frame the recent reversal as a classic “bear trap,” arguing that similar pullbacks in the Nasdaq 100 have historically resolved higher rather than morphing into full-blown downtrends.[9] On the other, skeptics warn that the AI-driven melt-up has the hallmarks of an overheating bubble and that rallies into strength could be vulnerable if earnings or macro data disappoint.[4] For traders focused on NDX seasonal trend analysis, that split view makes the approaching Aug 20 to Jun 13 window more than just a calendar curiosity; it is a potential stress test of whether historical seasonality or bubble-risk narratives dominate the next phase.
The chart below situates the latest move against the past year of trading and a median 60-day seasonal projection.
What should traders watch as this seasonal window approaches?
First, the calendar. The 298-day Nasdaq 100 trading window opens on Aug 20, so price action in the next two weeks will determine whether the index enters this historically strong stretch from a position of strength near the highs or after a deeper shakeout. A firm base above the 50-day moving average around 29,386 would keep the current uptrend intact heading into the window, while a break below that level would signal that volatility is already picking up.
Second, the macro and policy calendar that defines this phase of the presidential election cycle. The back half of the midterm election year often brings more clarity on fiscal priorities and regulation, which can either reinforce or undercut the tech sector’s seasonal tailwind.[1] Watch upcoming inflation prints, central bank meetings and any shifts in AI-related policy or antitrust rhetoric, since those have been key drivers of Nasdaq 100 leadership.
Third, behavior inside the window relative to the historical pattern. In prior cycles, strong years often saw early drawdowns of 10% to 20% from the entry before the index pushed to new highs, while weaker years like 2018 still managed to claw back into positive territory by the Jun 13 exit. If this iteration sees NDX respecting those historical intraperiod ranges and recovering from dips, it would be consistent with the established NDX seasonal trend. A sustained break that fails to recover by late spring would be a clear departure from the nine-for-nine record.
Finally, sentiment around the AI trade. If earnings and spending updates keep validating the recent melt-up, the seasonal window’s long bias could align with continued inflows into mega-cap tech and AI beneficiaries.[1] If bubble concerns gain the upper hand and investors start rotating away from high-multiple growth, then even a historically strong Nasdaq 100 trading window could deliver a rockier ride than the averages suggest.[4] Either way, the intersection of this midterm-year seasonal pattern with a market dominated by AI narratives makes the upcoming Aug 20 to Jun 13 stretch one of the most consequential on the calendar for tech-heavy portfolios.
Sources
About this seasonal analysis
Seasonal pattern data is sourced from TradeWave.ai, which analyzes historical price behavior across annual calendar windows going back up to 30 years. Read the full data methodology or the book The 100-Year Pattern by Afshin Moshrefi (2026 edition). Past performance of seasonal patterns does not guarantee future results. This article is for informational purposes only and does not constitute investment advice.