Apple Inc. (AAPL) Has Risen in 10 of 10 Midterm Runs, Averaging 51.84% Gains
Apple Inc. is stepping into a historically powerful midterm-year seasonal window just as investors digest softer guidance, rising component costs and a $309 share price.
Price as of Aug 4, 2026: $309.38 (last close).

What is the seasonal pattern for Apple Inc. (AAPL)?
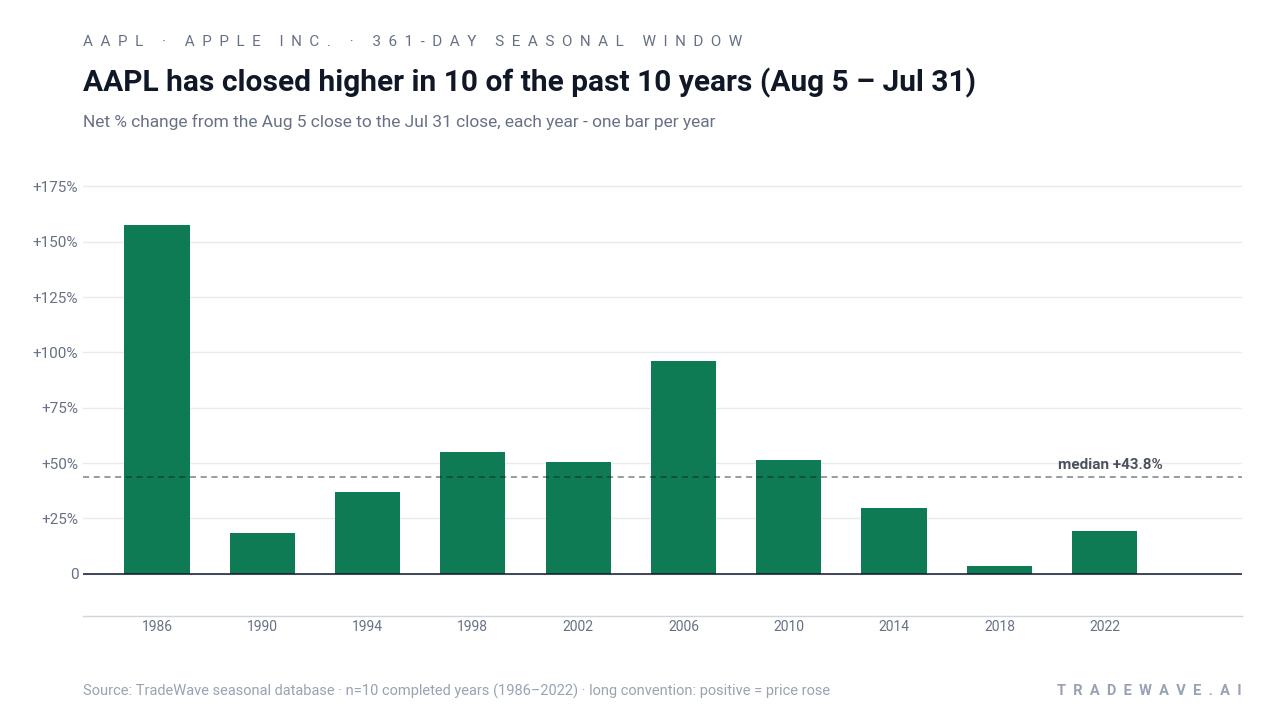
Apple Inc. has risen in 10 of 10 midterm-election-year Aug 5 to Jul 31 windows, with an average gain of 51.84% in winning years.
- 10 for 10 in this window, with Apple Inc. averaging 51.84% gains across winning years.
- Seasonal window runs roughly 361 days from Aug 5 to Jul 31 in the last 10 midterm election years.
- Percent Profitable is 100%, with 10 winners and 0 losers in the historical sample.
- Annualized return across these windows clocks in at 46.76%, with a Sharpe ratio of 1.06 for the long setup.
- The TradeWave Ratio of 1.3 signals that price has typically traveled meaningfully in the long direction within the window.
- Intraperiod swings have been wide in some years, with adverse moves as deep as about 38% before recovering into gains.
According to historical data from TradeWave.ai, this midterm-election-year stretch has behaved very differently from an average year for Apple, with a distinct long-biased pattern that traders rarely see laid out in one place.
How strong is Apple Inc. (AAPL)’s midterm-year seasonal window?
Apple Inc. has risen in every single Aug 5 to Jul 31 window across the last 10 midterm election years, averaging gains of 51.84% for the long side. The stock enters this latest iteration around $309.38 after a choppy month, leaving it below its 52-week high of $344.57 and well above the $199.91 low of the past year, or about 10.2% under the high and 54.7% above the low. That combination of a clean 10-for-10 record and a still-elevated share price makes this seasonal regime one of the most consequential on Apple’s calendar.
Grouping by the presidential election cycle matters here because Apple’s biggest moves have often lined up with policy and liquidity shifts between the midterm election year and the year before the presidential election, when Washington tends to lean more supportive of markets and corporate spending plans. This specific window sits squarely in that midterm-to-pre-election handoff, a phase that has historically favored large-cap growth and mega-cap tech leadership.
Historically, this 361-day Apple Inc. trading window has been a strong long setup rather than a mixed or volatile stretch. Percent Profitable sits at 100%, with 10 winners and 0 losers, and the median gain of 43.8% shows that the upside has not been driven only by a single outlier year. Average profit of 51.84% across all years lines up with a 46.76% annualized return, while a Sharpe ratio of 1.06 indicates that the reward has come with meaningful but not extreme volatility for a mega-cap stock.
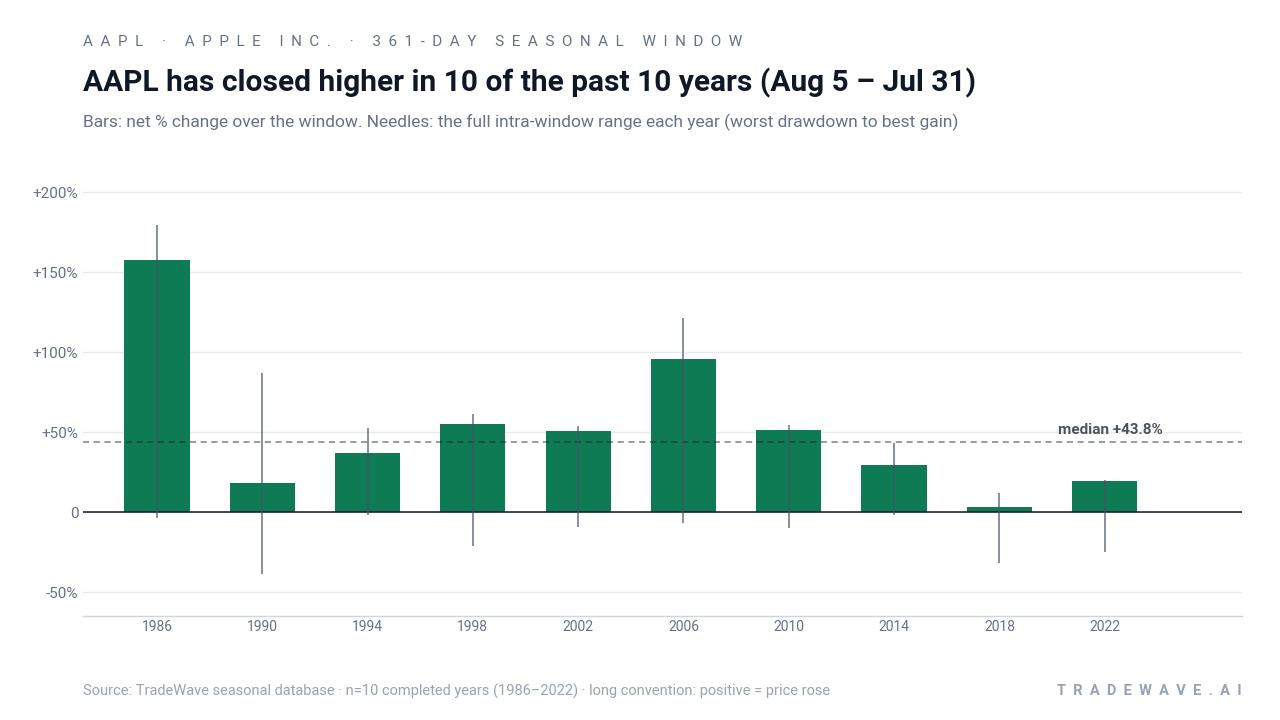
The per-year table shows how wide that range can be. The strongest year in this sample was 1986, when Apple gained 157.34% between the Aug 5 entry and the Jul 31 exit, with a maximum favorable move of 179.19% and only a shallow 3.43% worst drawdown from the starting point. At the other end of the spectrum, 2018 still finished positive at 3.45% but saw a maximum adverse move of 31.6% before recovering, underscoring that even “winning” years can feel painful in the middle.
Those intraperiod swings show up clearly in the maximum favorable and adverse excursions. In 1990, for example, Apple’s best run-up inside the window reached 86.99%, but the worst drawdown from entry was 38.43% before the stock closed the period with an 18.35% gain. In 2022, the maximum favorable move was 20.43% with a 24.78% worst drawdown, again ending the window higher by 19.35%. The pattern has rewarded patience, but it has not been a straight line.
Year-by-year ranges show how far Apple has tended to travel in both directions before settling at a higher close.
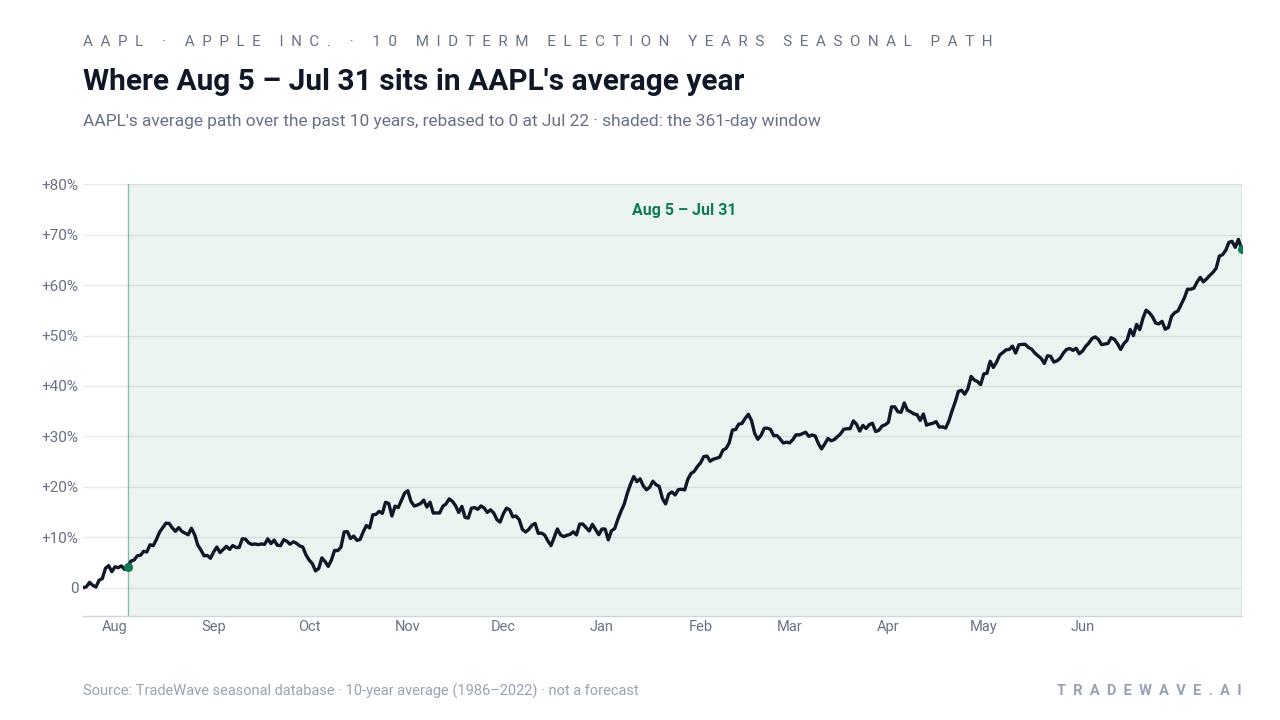
The cumulative chart of this Apple Inc. seasonal trend is even starker. Stacking the Aug 5 to Jul 31 window across the 10 midterm election years compounds to a 4,534% cumulative return, reflecting how consistently the stock has added value in this slice of the calendar. Add it up: 10 straight winning windows, no losing years, and a long bias that has persisted across very different macro and product cycles.
History does not guarantee future results; adverse excursions can be large even in winning windows, and Apple’s worst drawdowns in this pattern have exceeded 30% before recovering.
Why does Apple Inc. (AAPL) follow this seasonal pattern?
One likely driver is the way Apple’s product and earnings calendar clusters around the midterm-to-pre-election transition, with fall iPhone launches, holiday demand and fiscal-year-end portfolio rebalancing all landing inside this window.[1] Analysts have also pointed to the tendency for policy makers to lean more supportive of growth and liquidity heading into the year before a presidential election, which can amplify risk appetite for mega-cap tech.[2] This pattern may reflect that mix of product-cycle strength, institutional repositioning and a friendlier macro backdrop rather than any single catalyst.
What is driving Apple Inc. (AAPL) today?
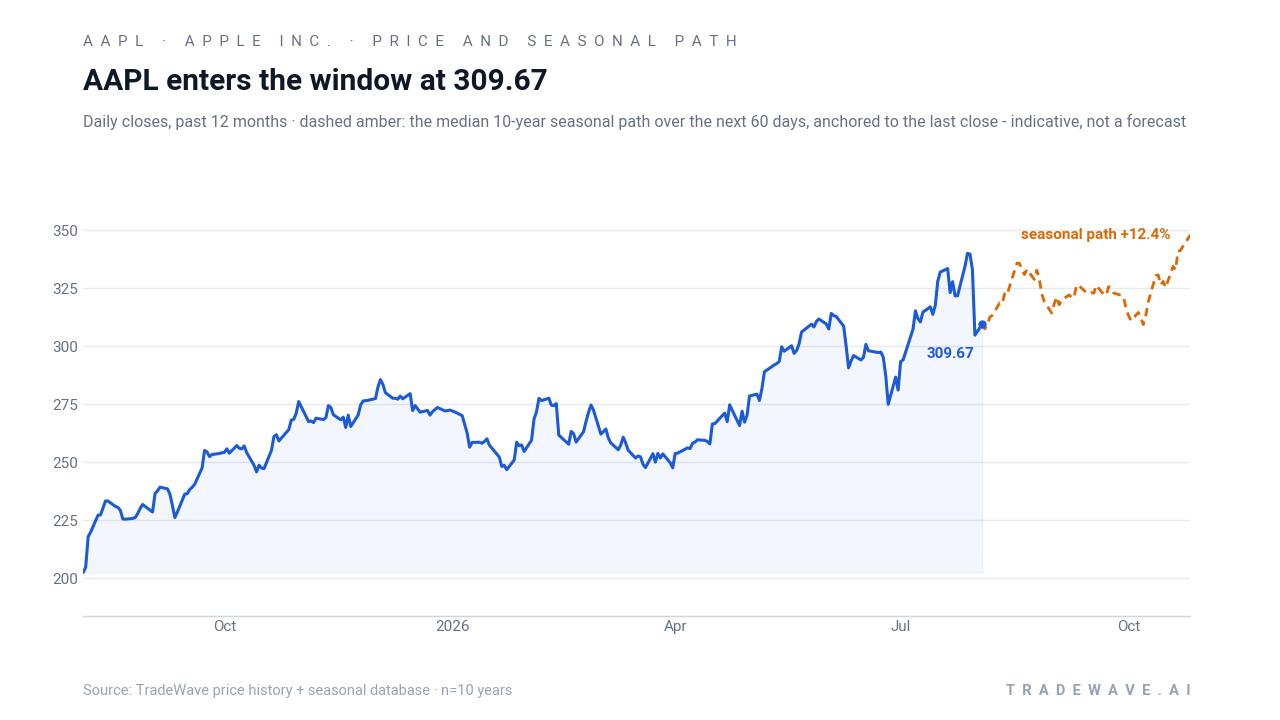
Apple shares closed at $309.38 on Aug 5, up 1.96% on the day, after a volatile stretch that has left the stock about 2.96% lower over the past month and roughly 10.2% below its 52-week high of $344.57 while still far above the $199.91 low of the past year. Trading volume of about 66.6 million shares topped the recent 20-day average of 54.6 million, and the stock is hovering almost exactly on its 50-day moving average of $309.52, a sign that investors are still debating the next leg.[1]
The near-term debate is all about growth versus margins. On Jul 30, Apple reported June-quarter revenue of $109.42 billion, slightly ahead of its internal estimate, but Services revenue of $30.74 billion and Greater China sales of $18.82 billion both missed expectations, and the stock slipped after the report.[1][3] Management guided September-quarter revenue growth to 9–11%, below roughly 12% Street expectations, and warned that gross margins would be pressured by higher component costs, particularly memory chips.[1][3] Analysts have since highlighted rising DRAM prices as a key headwind and at least one firm downgraded the stock on Aug 4 on that theme, arguing that Apple may need to absorb more of the cost or risk pushing through price increases on new devices.[2]
At the same time, the sector story is shifting toward AI and Services. The upcoming September iPhone launch and rollout of enhanced Siri AI capabilities are seen as critical for driving iCloud+ adoption and Services growth, a segment that has become central to Apple’s valuation case even after the latest revenue miss.[1] In the broader consumer electronics and services space, investors are watching whether Apple can convert its massive installed base into higher-margin recurring revenue fast enough to offset hardware margin pressure and a more competitive AI landscape.[1][4]
The chart below situates the latest move in its recent multi-month context and overlays the median seasonal path for the next two months.
What should traders watch in this Apple Inc. seasonal window?
First, watch how Apple trades around the September earnings update and iPhone launch. Historically, this Aug 5 to Jul 31 window has captured both the fall product cycle and the following spring’s demand, and strong follow-through after guidance updates has often aligned with the better seasonal years.[1][3] If the stock can hold above its 50-day moving average and start to close the gap toward the $344.57 high while margins remain under pressure, that would echo the pattern of prior cycles where macro or cost worries faded as product momentum took over.[2]
Second, monitor margin commentary and component pricing. Any sign that DRAM inflation is easing, or that Apple can pass through higher costs without denting demand, would reduce one of the main macro headwinds flagged in the latest downgrade and could help the stock track closer to its historical seasonal trend.[2] Conversely, if memory prices stay elevated into year-end and Apple leans harder on promotions or absorbs more of the hit, the intraperiod drawdowns inside this window could look more like the deeper MAE years such as 1990 or 2018.
Third, keep an eye on Services growth and AI adoption metrics. The seasonal pattern has historically rewarded periods when Apple’s ecosystem story is gaining traction, and analysts are laser-focused on whether enhanced Siri and iCloud+ bundles can re-accelerate Services after the latest miss.[1][4] Strong attach rates on new devices, higher subscription conversion and improving commentary on China would all be signs that the fundamental backdrop is lining up with what has been one of Apple’s most reliable seasonal stretches.
Finally, place Apple’s moves in the broader election-cycle context. The market is in a midterm election year, heading toward the year before the presidential election, a phase that has often coincided with friendlier policy and liquidity conditions for large-cap growth.[3] If Apple, as a key weight in major indices, starts to behave in line with its 10-for-10 midterm-year seasonal record, that strength could have ripple effects across the broader tech sector and the S&P 500.
Sources
- CNBC – Apple’s earnings leave Street divided as it faces series of headwinds (Jul 31, 2026)
- CNBC – Apple shares downgraded due to memory chip inflation (Aug 4, 2026)
- The Wall Street Journal – Apple Expects Slower Growth After AI Boom Drives Up Costs (Jul 30, 2026)
- Barchart – Apple vs. HP: The $5 Trillion Giant, or the Stock That Pays 15x the Dividend (Jul 31, 2026)
About this seasonal analysis
Seasonal pattern data is sourced from TradeWave.ai, which analyzes historical price behavior across annual calendar windows going back up to 30 years. Read the full data methodology or the book The 100-Year Pattern by Afshin Moshrefi (2026 edition). Past performance of seasonal patterns does not guarantee future results. This article is for informational purposes only and does not constitute investment advice.