Monster Beverage (MNST) Enters 7-for-7 Midterm Window Averaging 38.13% Gains
Monster Beverage is heading into a historically powerful midterm-year seasonal window just as shares trade near record highs and a 2-for-1 stock split approaches, raising the stakes for this year’s move.
Price as of Aug 3, 2026: $93.55 (last close).
What is the seasonal pattern for Monster Beverage (MNST)?
Monster Beverage has risen in 7 of 7 midterm-year windows starting Aug 31, with an average gain of 38.13% in winning years.
- 7 for 7 in this window, averaging 38.13% gains in winning years across the last 7 midterm election cycles.
- Percent Profitable is 100%, with 7 winners and 0 losers over the 319-day Aug 31 to Jul 15 trading window.
- Trade Direction is long, with a TradeWave Ratio of 1.69 and a Sharpe ratio of 1.4, pointing to strong upside relative to volatility.
- Cumulative return from repeatedly holding this window across cycles totals 771%, highlighting how powerful this MNST seasonal trend has been.
- Intraperiod swings have been meaningful, with some years seeing double-digit drawdowns before finishing higher, so the ride has not been smooth.
- This pattern is specific to midterm election years, tying Monster Beverage’s strongest seasonal stretch to a distinct phase of the presidential cycle.
According to historical data from TradeWave.ai, Monster Beverage’s performance around the late-August midterm-year pivot has behaved very differently from an average calendar year. The next section unpacks how that election-cycle pattern has played out in prior windows and what it means for the upcoming stretch.
How has Monster Beverage (MNST) traded in the Aug 31 midterm-year window?
Monster Beverage has risen in every single Aug 31 to Jul 15 midterm-year window across the last seven cycles, averaging 38.13% gains for long positions. Shares finished the prior session at 93.55, down 2.9% on the day but still up 21.94% year to date and within sight of their 52-week high of 100.34.[10] That combination of a strong historical seasonal pattern and a stock already near record territory gives this year’s window unusual weight for traders watching the Consumer Defensive sector.
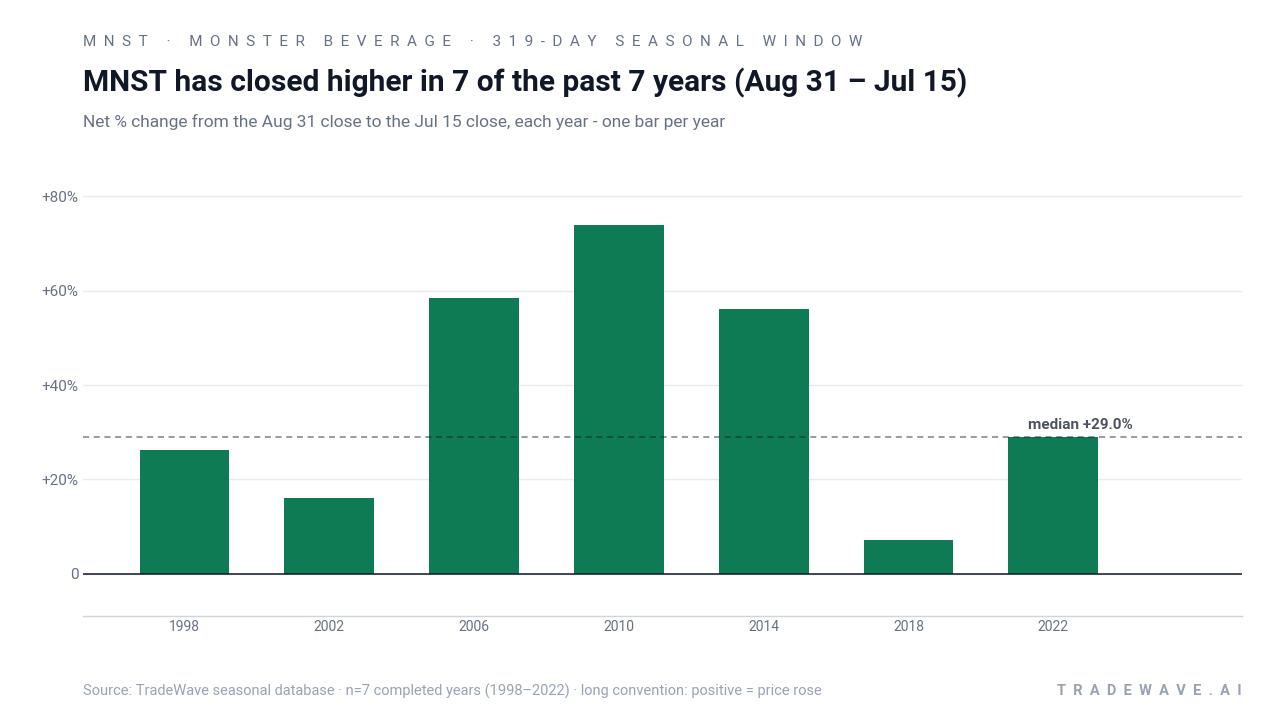
The pattern is built on the last seven midterm election years, so it lines up with a specific phase of the presidential cycle rather than consecutive calendar years. In those midterm phases, long trades initiated around Aug 31 and held for 319 days through roughly mid-July have been profitable every time, with a cumulative return of 771% when the window is stacked across cycles. For a Consumer Defensive name, that is an unusually clean seasonal bias.
A second view shows how each year’s best rally and worst drawdown have stacked up inside the same window.
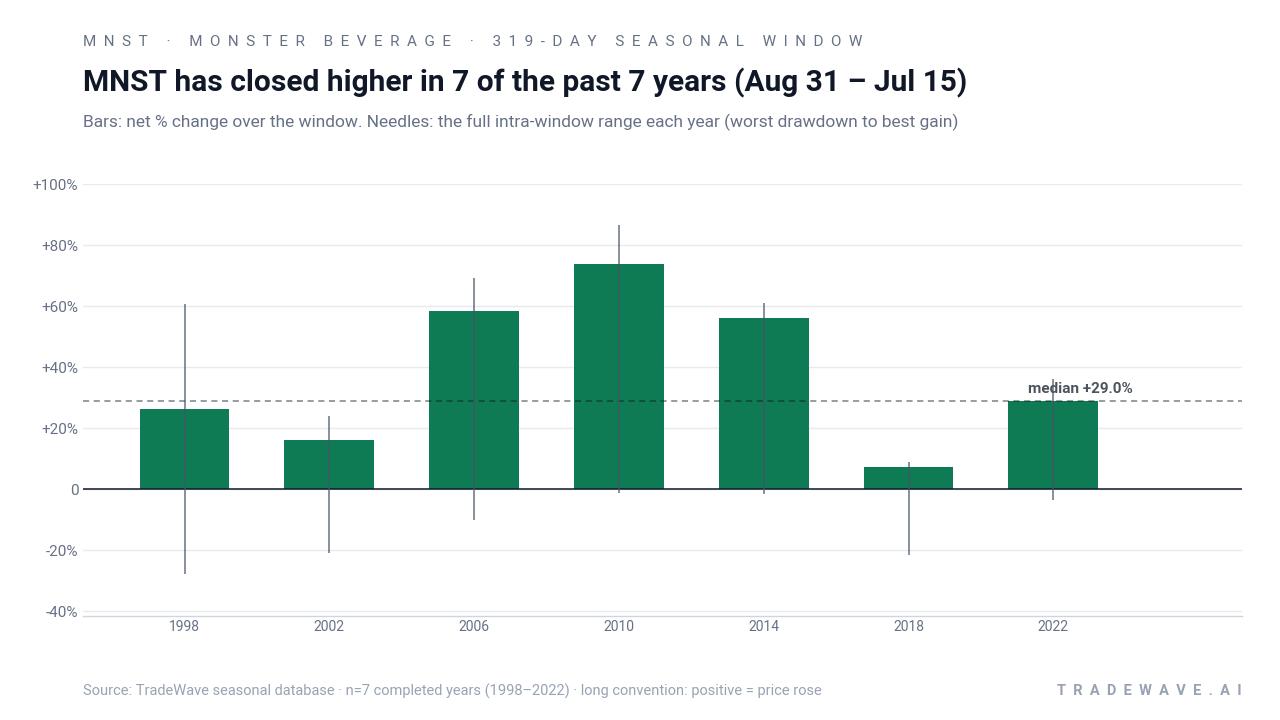
Per-year data underline how that volatility has looked in practice. In 2010, for example, Monster Beverage logged a 73.83% net gain in the window, with a maximum favorable move of 86.5% and only a 1.2% worst drawdown from the entry. By contrast, 1998 and 2018 still finished higher, up 26.24% and 7.18% respectively, but saw adverse excursions of 27.77% and 21.6% along the way, showing that even winning years could test conviction before the trend reasserted itself.
The TradeWave Ratio of 1.69 captures how far price has typically traveled in the trade direction within the window, independent of the final close. Combined with a Sharpe ratio of 1.4, it points to a regime where upside has historically outweighed volatility for long holders, even though the path has not been linear. The cumulative chart of this window compounds to 771% over seven completed years, which is what you get when a stock goes 7 for 7 with average gains north of 30% in a single recurring slice of the calendar.
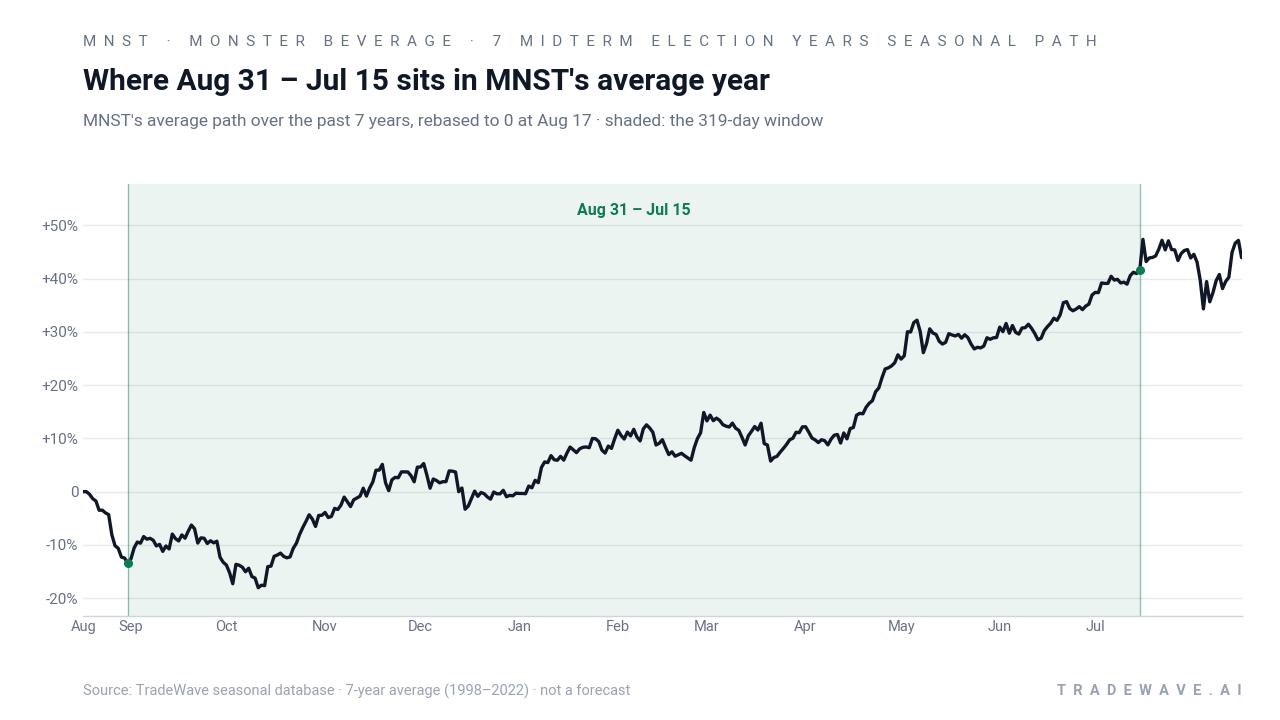
In the context of the presidential cycle, this window straddles the back half of the midterm election year and runs deep into the following pre-election year. That matters because midterm years often bring policy noise and choppy markets, while pre-election years have historically been friendlier for risk assets as fiscal and regulatory paths become clearer. Monster Beverage’s pattern suggests that for this stock, the handoff from midterm uncertainty to pre-election clarity has tended to coincide with a long, favorable trading stretch.
History does not guarantee future results; adverse excursions can be large even in winning windows, and traders should be prepared for meaningful drawdowns inside the pattern.
Why does Monster Beverage (MNST) follow this seasonal pattern?
One likely driver is the way Monster Beverage’s earnings calendar and product demand line up with the midterm-to-pre-election stretch, from late-summer energy drink season through the following summer’s promotional cycle.[10][11] Analysts have also pointed to institutional portfolio repositioning around the midterm year, which can favor steady Consumer Defensive names as policy uncertainty peaks and then fades.[8] The result is a window where both consumer spending cycles and asset-allocation flows may be pulling in the same direction for MNST more often than not.
What is driving Monster Beverage (MNST) today?
Monster Beverage closed the prior session at 93.55, down 2.83 points or 2.9% on the day, after trading between 92.64 and 97.35, yet the stock remains up 21.94% year to date and about 6.8% below its 52-week high of 100.34.[10] The pullback comes ahead of a 2-for-1 stock split slated for mid-August, a mechanical move that will halve the share price and double the share count without changing the company’s fundamentals, but that often draws in additional retail interest around Consumer Defensive names.
Fundamentally, Monster Beverage is coming off a solid first quarter of fiscal 2026, with revenue of $2.35 billion and earnings of $569.49 million, reflecting continued strength in its core energy drink franchise.[11] The company sits in the Beverages – Non-Alcoholic industry within the Consumer Defensive sector, a pocket of the market that investors often lean on when growth stocks wobble or macro uncertainty rises.[10] That backdrop has helped MNST outperform many peers this year, even as the broader market has rotated between risk-on and safety trades.
On the competitive front, Morgan Stanley recently highlighted that Red Bull’s U.S. price increases could support Monster Beverage’s own pricing power, potentially cushioning margins if input costs or promotional spending rise.[8] At the same time, Simply Wall St coverage cited in a Yahoo Finance piece flagged significant insider selling over the past three months, a reminder that some executives have been taking chips off the table after the stock’s strong run.[8] In July, Yahoo Finance also noted that MNST was trading above a consensus analyst price target of 89.69, suggesting that at least part of the sell-side framework still reflects an earlier, lower price regime rather than today’s higher trading band.[8][9]
The chart below situates the latest pullback against MNST’s 12-month rally and the historical seasonal projection for the weeks ahead.
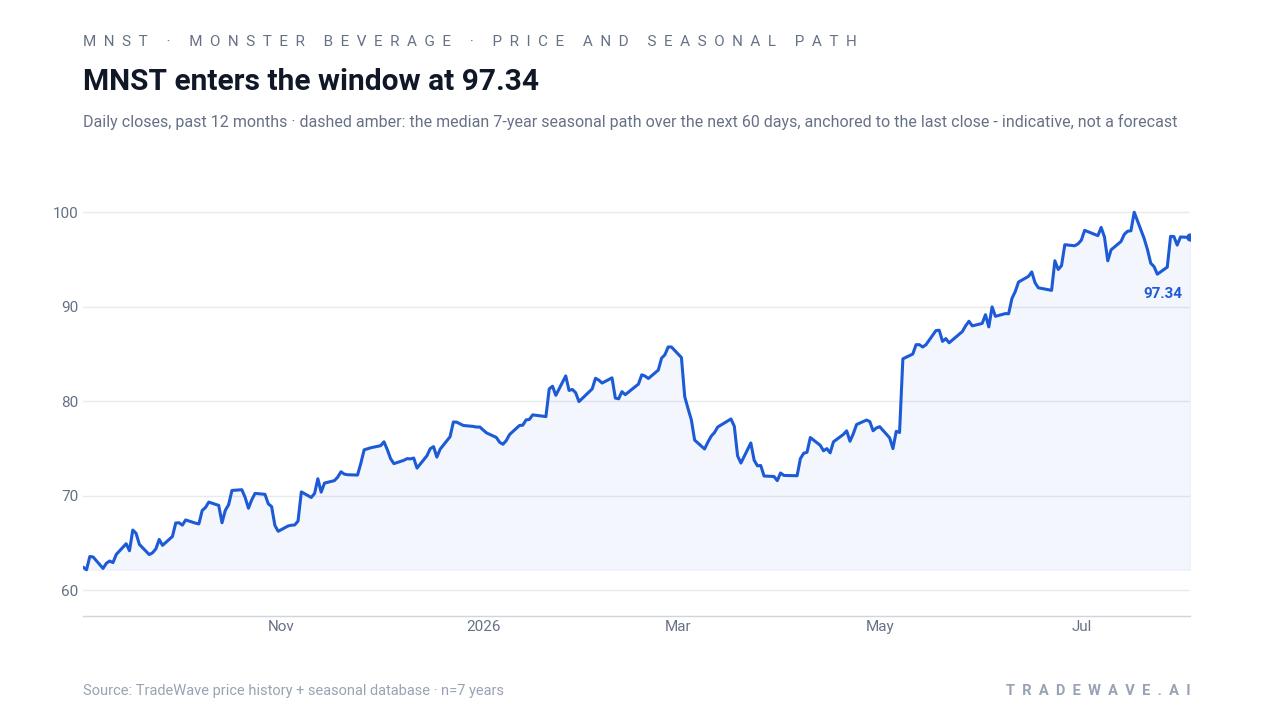
From a macro lens, the key swing factor is how consumer pricing power holds up into late summer and early fall. Moves by competitors like Red Bull to raise U.S. prices suggest that the category can still absorb higher shelf tags, which could support Monster Beverage’s margins if volumes remain resilient.[8] For a stock already near its highs and heading into a historically strong seasonal window, the interplay between pricing, volumes and any further insider or institutional positioning shifts will likely dictate whether this midterm-year pattern can extend its perfect record.
What should traders watch as the Aug 31 window approaches?
First, the calendar: the 319-day seasonal window opens on Aug 31 and runs through roughly Jul 15, covering the back half of the midterm election year and most of the following pre-election year. Historically, that specific slice has been 7 for 7 for long MNST exposure, with average gains above 30%, so traders will be watching how the stock behaves as the start date nears. A firm tape into late August would be consistent with prior cycles, while a sharp breakdown ahead of the window would mark a departure from the usual pattern.
Second, price levels and volatility. With MNST about 6.8% below its 52-week high and still well above its 50-day moving average of 93.61, the key question is whether pullbacks stay shallow or begin to resemble the 20% plus intraperiod drawdowns seen in some past windows.[10] If the stock can digest the split and any macro jitters without breaking its recent range, that would align more closely with the stronger historical years like 2010 and 2014, where downside was limited and upside built steadily.
Third, insider and institutional behavior. The recent wave of insider selling highlighted in Yahoo Finance coverage is a live signal to monitor: if selling slows or reverses as the window opens, it would suggest management confidence is stabilizing at higher prices, whereas continued heavy selling into strength could temper enthusiasm about the seasonal edge.[8] On the institutional side, any shift in analyst tone or target resets closer to current levels would indicate that the Street is recalibrating to the stock’s new trading range rather than anchoring to older, lower regimes.[8][9]
Finally, the policy and macro calendar. As the midterm election year progresses, investors will parse fiscal and regulatory headlines for clues on consumer spending, sugar and caffeine regulation, and broader risk appetite. If the market leans into the typical pre-election-year optimism once the political dust settles, Monster Beverage’s historically strong midterm-to-pre-election trading window could again line up with a friendlier backdrop for Consumer Defensive growth names. If instead macro conditions tighten or consumer demand softens, this could be the cycle that breaks the 7-for-7 streak.
Sources
- Yahoo Finance: Monster Beverage (MNST) Gets A Lift As Red Bull Raises U.S. Prices (Jul 5, 2026).
- Yahoo Finance / Insider Monkey: Wells Fargo Lowers Monster Beverage (MNST) Price Target to $90 (Mar 28, 2026).
- Yahoo Finance (Canada): Monster Beverage Corporation (MNST) Stock Price, News, Quote & History (Jul 24, 2026).
- Yahoo Finance: Monster Beverage (MNST) Releases Q1 2026 Financial Results (May 12, 2026).
About this seasonal analysis
Seasonal pattern data is sourced from TradeWave.ai, which analyzes historical price behavior across annual calendar windows going back up to 30 years. Read the full data methodology or the book The 100-Year Pattern by Afshin Moshrefi (2026 edition). Past performance of seasonal patterns does not guarantee future results. This article is for informational purposes only and does not constitute investment advice.