S&P 500 SPDR (SPY) Has Risen in 7 of 7 Midterm Aug 3 Windows, Averaging 15.55% Gains
S&P 500 SPDR is stepping into a historically powerful 361-day seasonal window as megacap earnings and Fed expectations shape the next leg of the index.

What is the seasonal pattern for S&P 500 SPDR (SPY)?
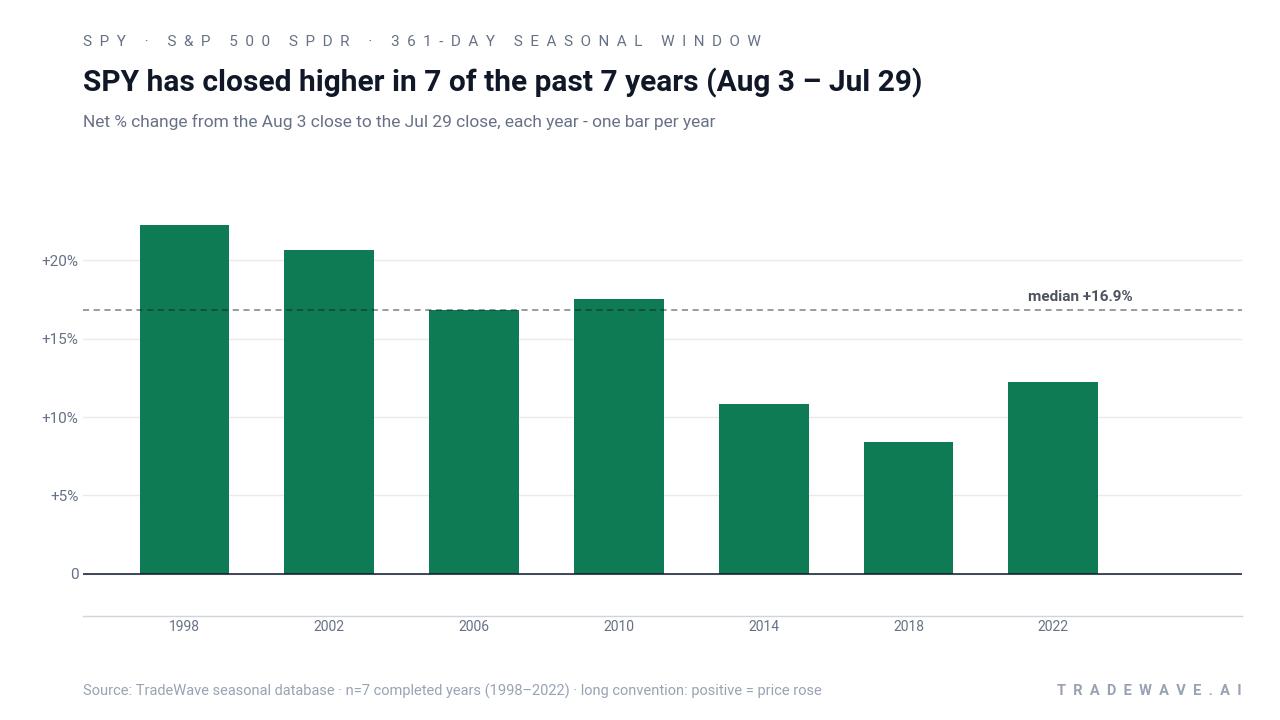
S&P 500 SPDR has risen in 7 of 7 midterm-year windows starting Aug 3, with an average gain of 15.55% in winning years.
- 7 for 7 in this window, with SPY posting gains every time and winning years averaging 15.55%.
- The seasonal window runs from Aug 3 through Jul 29, spanning 361 calendar days across the last 7 midterm election years.
- Percent Profitable is 100%, with 7 winners and 0 losers in the historical sample.
- Annualized return across these windows is 15.45%, with a Sharpe ratio of 2.24 on end-of-window outcomes.
- The TradeWave Ratio of 1.94 indicates that price has typically traveled meaningfully in the long direction within the window, not just at the close.
- Individual years have seen sizeable intraperiod drawdowns even in winning windows, underscoring that the ride has not been smooth.
According to historical data from TradeWave.ai, this midterm-year stretch for SPY has behaved very differently from an average calendar year, with a distinct long-biased profile that traders rarely see laid out in one place.
How strong is the upcoming seasonal window for S&P 500 SPDR (SPY)?
S&P 500 SPDR has closed higher in every one of the last seven midterm-year windows that began on Aug 3 and ran for 361 days, averaging a 15.55% gain. The ETF enters this latest iteration around 747, leaving it about 1.3% below its 52-week high and well above its 52-week low, after a modest 0.3% advance over the past month.
The presidential election cycle matters here because this window always starts in a midterm election year and runs deep into the year before the presidential election, a phase that has often coincided with friendlier policy tone and improving risk appetite for equities.[1] Grouping only those midterm-to-pre-election stretches filters out noise from other parts of the cycle and isolates how SPY has behaved when Washington is past the early-term policy shock but not yet in the heat of a presidential vote.
Historically, the trade direction for this pattern is long, and the record is clean: 7 winners, 0 losers, with Percent Profitable at 100%. Average profit across those winning years is 15.55%, while the median outcome is slightly higher at 16.87%, which tells you the gains have not been driven by a single outlier year. The annualized return of 15.45% and a Sharpe ratio of 2.24 on end-of-window results point to a profile that has been both strong and relatively consistent compared with many other SPY seasonal windows.
Looking at individual years, the strongest net return came in 1998, when SPY gained 22.24% between the Aug 3 entry and the Jul 29 exit, with a maximum favorable move of 29.37% before giving some of it back. The softest outcome in this sample was 2018, which still finished up 8.4% but saw a maximum adverse move of -16.72% at one point, a reminder that even “all green” windows can feel rough in real time.
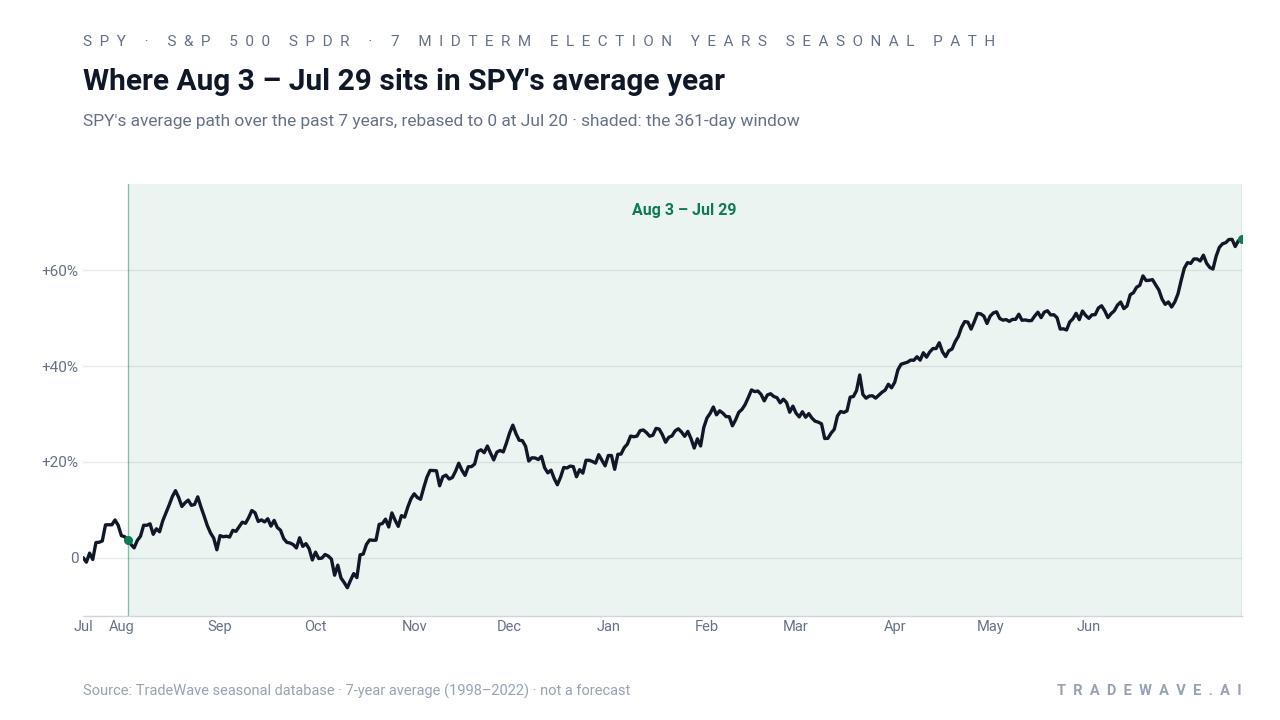
The historical seasonal average shows SPY tending to grind higher through much of this 361-day stretch, with gains building gradually rather than in a single burst. The path is not a straight line, but the composite suggests that pullbacks inside the window have typically been followed by recoveries that kept the full-period result positive.
The next view shows how far SPY has swung both up and down inside each of these windows.
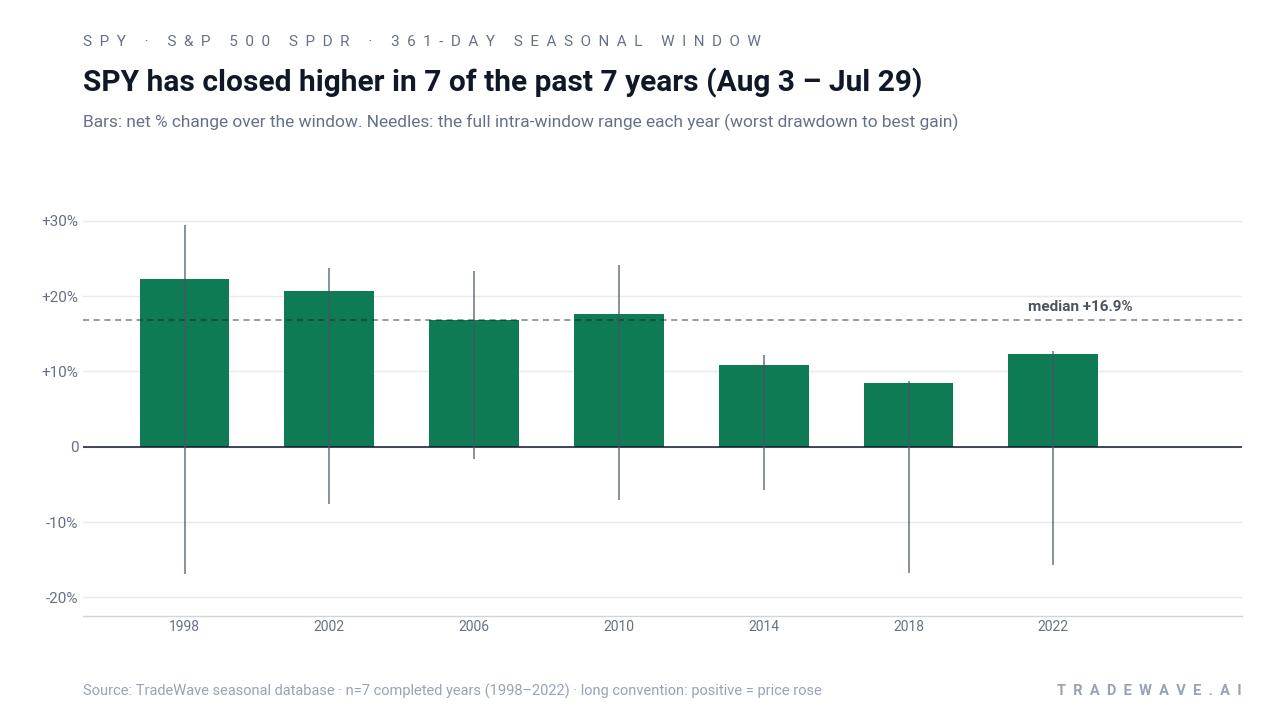
The combined net / maximum favorable / maximum adverse view shows that while every year finished higher, SPY often traveled through a wide range along the way. In 1998 and 2018, for example, the worst drawdowns of -16.86% and -16.72% sat alongside double-digit peak gains, illustrating a high-variance ride that still ended positive for a long holder. Other years such as 2006 and 2014 saw more contained downside, with maximum adverse moves of -1.67% and -5.73%, which made the climb feel smoother.
The TradeWave Ratio of 1.94 reinforces that point by capturing how far SPY has typically moved in the trade direction within the window, independent of the final close. In plain English, the ETF has usually offered meaningful upside swings for longs during this midterm-to-pre-election stretch, even when some of that move was given back before the exit date.
History does not guarantee future results; adverse excursions can still be large inside this window, and past drawdowns near -17% show that even winning seasons can test conviction.
Why does S&P 500 SPDR (SPY) follow this seasonal pattern?
One likely driver is the way the policy and earnings calendar lines up between the midterm election year and the year before the presidential election. By this point in the cycle, Washington has often moved past early-term policy fights, while corporate earnings tend to benefit from clearer fiscal and regulatory visibility, encouraging institutional portfolio managers to add equity risk. This pattern may also reflect systematic rebalancing and sector rotation into growth and cyclicals as rate expectations stabilize and investors position for the historically strong pre-election year environment.
What is driving S&P 500 SPDR (SPY) today?
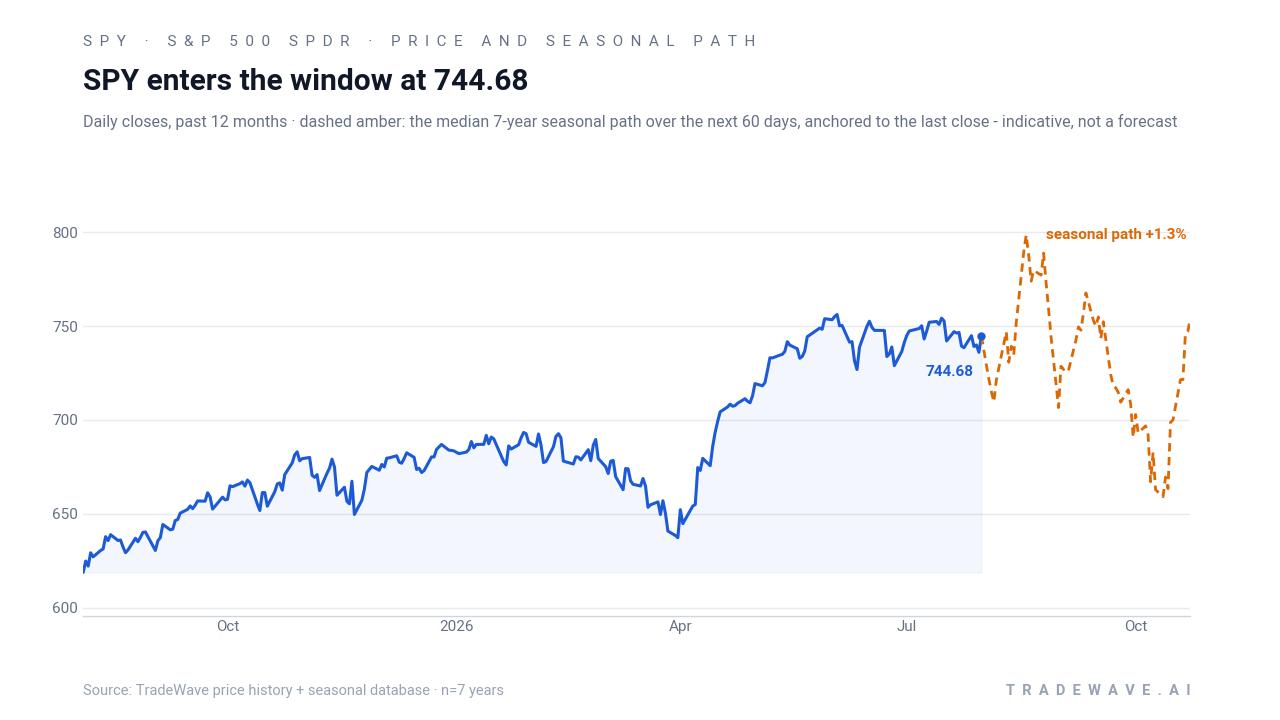
SPY is trading around 747, up about 0.72% on the day, leaving it roughly 1.3% below its 52-week high of about 756.50 and well above its 52-week low near 605.79. The ETF has been supported by a broadly constructive earnings season, with strong megacap technology results, including Microsoft’s late-July report, helping to offset lingering concerns about the durability of AI spending and the path of interest rates.[1] Commentary around the Federal Reserve has shifted toward the idea that additional rate hikes may be unlikely, a backdrop that has historically been friendly to large-cap equities and index products like SPY when growth data holds up.[1]
The chart below places that move in the context of the past year and overlays the median seasonal path for the next two months.
In late July, Microsoft’s earnings helped spark a tech-led rally that lifted SPY and other major benchmarks, reinforcing the idea that megacap balance sheets remain a key support for the index.[1] Sector commentary has highlighted technology, utilities, and financials as areas of relative earnings strength, a mix that can keep SPY’s earnings base resilient even if more cyclical pockets wobble.[1] At the same time, the ETF’s dividend yield near 1% leaves most of the return burden on price appreciation, which makes the interaction between this historically strong seasonal window and the evolving macro backdrop especially important for index-focused traders.
What should traders watch in this SPY seasonal window?
First, watch how SPY behaves on pullbacks inside this window. In prior midterm-year cycles, drawdowns of 5% to 15% within the Aug 3 – Jul 29 stretch have not been unusual, even when the full-period result ended positive, so whether buyers step in on weakness will be a key tell for whether the historical pattern is repeating.
Second, keep an eye on the policy calendar and Fed rhetoric. The historical midterm-to-pre-election pattern has often lined up with a friendlier policy tone and more stable rate expectations, so any renewed push toward tighter policy or a surprise inflation flare-up would be a clear test of this cycle’s ability to track the past.[1]
Third, monitor leadership inside the index. Prior strong midterm-year windows have tended to feature solid earnings breadth and outperformance from sectors like technology and financials; if gains narrow to a handful of megacaps while the rest of the index stalls, the seasonal tailwind could be fighting a more fragile internal tape.[1]
Finally, watch how SPY trades as the calendar transitions from the midterm election year into the year before the presidential election. Historically, that handoff has been one of the more constructive phases for U.S. equities, and behavior around that pivot will show whether this cycle is tracking the long-term SPY seasonal trend or carving its own path.
Sources
About this seasonal analysis
Seasonal pattern data is sourced from TradeWave.ai, which analyzes historical price behavior across annual calendar windows going back up to 30 years. Read the full data methodology or the book The 100-Year Pattern by Afshin Moshrefi (2026 edition). Past performance of seasonal patterns does not guarantee future results. This article is for informational purposes only and does not constitute investment advice.